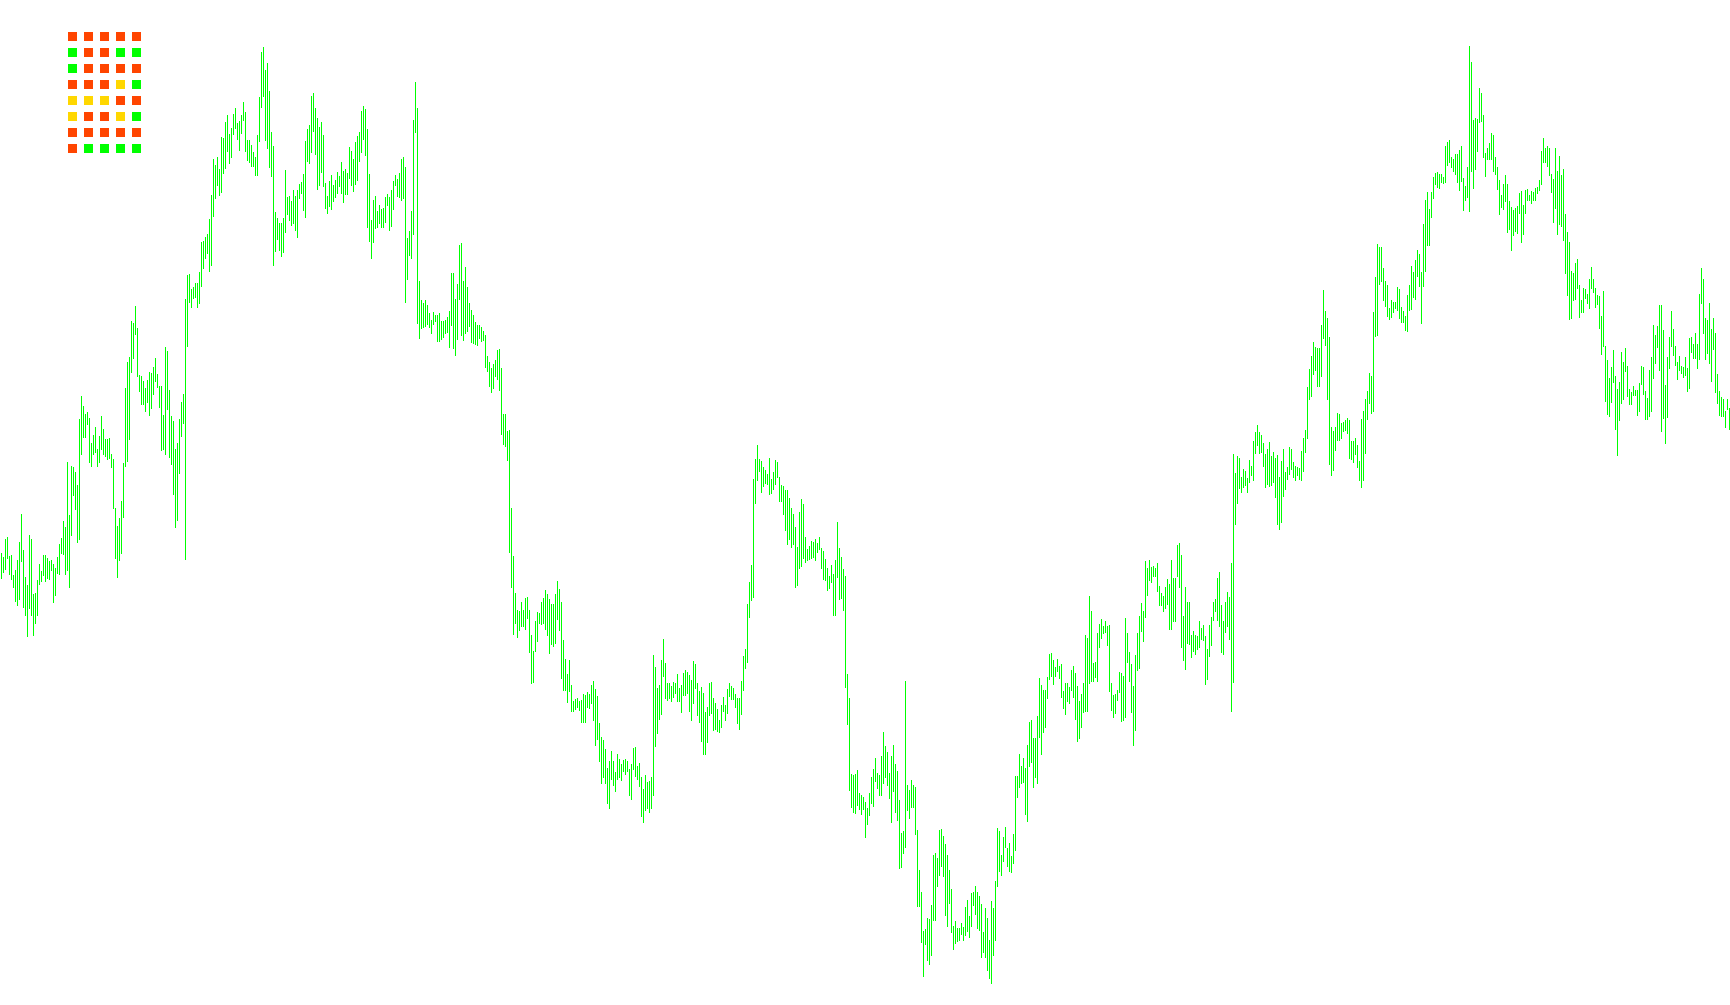
This script is designed to give you a quick visual overview of the trend direction for several currency pairs across different timeframes, all displayed directly on your chart. It achieves this by using a moving average indicator and comparing the current price to this average. Here's a breakdown:
-
Setup:
- The script starts by defining a few settings that you can adjust. These include the number of timeframes it will analyze (like 5-minute, 15-minute, etc.), the specific timeframes (in minutes), and a list of currency pairs you want to track (like EURUSD, GBPUSD, etc.).
- It also sets up visual elements like colors for different trend directions (up, down, flat), the font color, and where the information will be displayed on your chart.
-
Initialization:
- When the script starts running, it creates a series of small labels on your chart.
- Each label will represent a currency pair and a specific timeframe combination. For example, one label might be for "EURUSD" on the "5-minute" timeframe.
- Initially, these labels are just placeholders with a neutral symbol.
-
Trend Calculation:
- The script then looks at each currency pair on each specified timeframe.
- For each combination, it calculates a moving average (a line that smooths out price fluctuations over a certain period). You can customize the period that is used to calculate the moving average.
- It then compares the current price to this moving average. In particular, it looks at whether the price is above or below the moving average and also at the current high or low in relation to the moving average.
- If the price is consistently above the moving average, it considers it an uptrend.
- If the price is consistently below the moving average, it considers it a downtrend.
- If the price is hovering around the moving average, it considers it a sideways or ranging market (flat).
-
Visual Display:
- Based on the trend direction calculated, the script changes the symbol displayed in the corresponding label on your chart.
- It uses different colors to represent the trend:
- A green symbol indicates an uptrend.
- A red/orange symbol indicates a downtrend.
- A yellow/gold symbol indicates a flat/ranging market.
-
Ongoing Updates:
- The script continues to run and recalculate the trend direction and update the symbols on your chart, giving you a real-time visual overview of the trends for the currency pairs and timeframes you've selected.
- When you remove the script from your chart, it deletes all the labels it created.
In essence, this script provides a simplified, color-coded "dashboard" showing you the prevailing trends across multiple currency pairs and timeframes, based on moving average calculations.
//+------------------------------------------------------------------+
//|                                                 JJN-BigTrend.mq4 |
//|                                      Copyright © 2012, JJ Newark |
//|                                            http:/jjnewark.atw.hu |
//|                                             jjnewark@freemail.hu |
//+------------------------------------------------------------------+
#property copyright "Copyright © 2012, JJ Newark"
#property link      "http:/jjnewark.atw.hu"


#property indicator_chart_window


//+------------------------------------------------------------------------------------------------------------------+
// YOU CAN CHANGE THESE PARAMETERS ACCORDING TO YOUR TASTE:
//+------------------------------------------------------------------------------------------------------------------+
int     tfnumber      = 5; // Number of the timeframes
int     tframe[]      = {5,15,30,60,240}; // Timeframes in minutes
double  IndVal[][5]; // Be the second array-index equal with tfnumber
int     NumberOfPairs = 8; // Number of the pairs
string  Pairs[]       = {"EURUSD","GBPUSD","AUDUSD","NZDUSD","USDJPY","GBPJPY","EURJPY","USDCHF"}; // Requested pairs
//+------------------------------------------------------------------------------------------------------------------+
//+------------------------------------------------------------------------------------------------------------------+


extern int        TrendPeriod                 = 55;
extern int        Ma_Price                    = PRICE_CLOSE;
extern color      UpColor                     = Lime;
extern color      DownColor                   = OrangeRed;
extern color      FlatColor                   = Gold;
extern color      FontColor                   = Black;
extern int        PosX                        = 20;
extern int        PosY                        = 20;

double val_0,val_1;


//+------------------------------------------------------------------+
//| Custom indicator initialization function                         |
//+------------------------------------------------------------------+
int init()
  {
//----
   for(int w=0;w<NumberOfPairs;w++)
      {
      for(int j=0;j<tfnumber;j++)
      {
         ObjectCreate("BigTrendInd"+w+j,OBJ_LABEL,0,0,0,0,0);
         ObjectSet("BigTrendInd"+w+j,OBJPROP_CORNER,0);
         ObjectSet("BigTrendInd"+w+j,OBJPROP_XDISTANCE,j*16+PosX+50);
         ObjectSet("BigTrendInd"+w+j,OBJPROP_YDISTANCE,w*16+PosY+10);
         ObjectSetText("BigTrendInd"+w+j,CharToStr(110),12,"Wingdings",Silver);
      }
      }

   for(w=0;w<NumberOfPairs;w++)
      {
         ObjectCreate("BigTrendPairs"+w,OBJ_LABEL,0,0,0,0,0);
         ObjectSet("BigTrendPairs"+w,OBJPROP_CORNER,0);
         ObjectSet("BigTrendPairs"+w,OBJPROP_XDISTANCE,PosX);
         ObjectSet("BigTrendPairs"+w,OBJPROP_YDISTANCE,w*16+PosY+12);
         ObjectSetText("BigTrendPairs"+w,Pairs[w],8,"Tahoma",FontColor);
      }

   ObjectCreate("BigTrendLine0",OBJ_LABEL,0,0,0,0,0);
   ObjectSet("BigTrendLine0",OBJPROP_CORNER,0);
   ObjectSet("BigTrendLine0",OBJPROP_XDISTANCE,PosX+10);
   ObjectSet("BigTrendLine0",OBJPROP_YDISTANCE,NumberOfPairs*16+PosY+6);
   ObjectSetText("BigTrendLine0","   ----------------------",8,"Tahoma",FontColor);

   ObjectCreate("BigTrendLine1",OBJ_LABEL,0,0,0,0,0);
   ObjectSet("BigTrendLine1",OBJPROP_CORNER,0);
   ObjectSet("BigTrendLine1",OBJPROP_XDISTANCE,PosX+10);
   ObjectSet("BigTrendLine1",OBJPROP_YDISTANCE,NumberOfPairs*16+PosY+8);
   ObjectSetText("BigTrendLine1","   ----------------------",8,"Tahoma",FontColor);

   ObjectCreate("BigTrendIndName",OBJ_LABEL,0,0,0,0,0);
   ObjectSet("BigTrendIndName",OBJPROP_CORNER,0);
   ObjectSet("BigTrendIndName",OBJPROP_XDISTANCE,PosX+20);
   ObjectSet("BigTrendIndName",OBJPROP_YDISTANCE,NumberOfPairs*16+PosY+16);
   ObjectSetText("BigTrendIndName","JJN-BigTrend ("+TrendPeriod+")",8,"Tahoma",FontColor);


   ArrayResize(IndVal,NumberOfPairs);
//----
   return(0);
  }
//+------------------------------------------------------------------+
//| Custom indicator deinitialization function                       |
//+------------------------------------------------------------------+
int deinit()
  {
//----
   for(int w=0;w<NumberOfPairs;w++)
      {
      for(int j=0;j<tfnumber;j++)
      {
      ObjectDelete("BigTrendInd"+w+j);
      }
      }

   for(w=0;w<NumberOfPairs;w++)
      {
         ObjectDelete("BigTrendPairs"+w);
      }

   ObjectDelete("BigTrendLine0");
   ObjectDelete("BigTrendLine1");
   ObjectDelete("BigTrendIndName");

//----
   return(0);
  }
//+------------------------------------------------------------------+
//| Custom indicator iteration function                              |
//+------------------------------------------------------------------+
int start()
  {

   for(int z=0;z<NumberOfPairs;z++)
      {
   for(int x=0;x<tfnumber;x++)
      {

      val_0=iMA(Pairs[z],tframe[x],TrendPeriod,0,MODE_EMA,Ma_Price,0);
      val_1=iMA(Pairs[z],tframe[x],TrendPeriod,1,MODE_EMA,Ma_Price,0);


        if (val_0 > val_1 && iLow(Pairs[z],tframe[x],0) > val_0) // UPTREND
        {
        IndVal[z][x]=1;
        }
        else if (val_0 < val_1 && iHigh(Pairs[z],tframe[x],0) < val_0) // DOWNTREND
        {
        IndVal[z][x]=-1;
        }
        else IndVal[z][x]=0; // RANGING
      }
      }


   for(int q=0;q<NumberOfPairs;q++)
      {
      for(int y=0;y<tfnumber;y++)
      {
         if(IndVal[q][y]==-1) ObjectSetText("BigTrendInd"+q+y,CharToStr(110),12,"Wingdings",DownColor);
         if(IndVal[q][y]==0) ObjectSetText("BigTrendInd"+q+y,CharToStr(110),12,"Wingdings",FlatColor);
         if(IndVal[q][y]==1) ObjectSetText("BigTrendInd"+q+y,CharToStr(110),12,"Wingdings",UpColor);
      }
      }


//----
   return(0);
  }
//+------------------------------------------------------------------+
Comments