Heat_Map_MultiColor
Indicator

Heat_Map_MultiColor

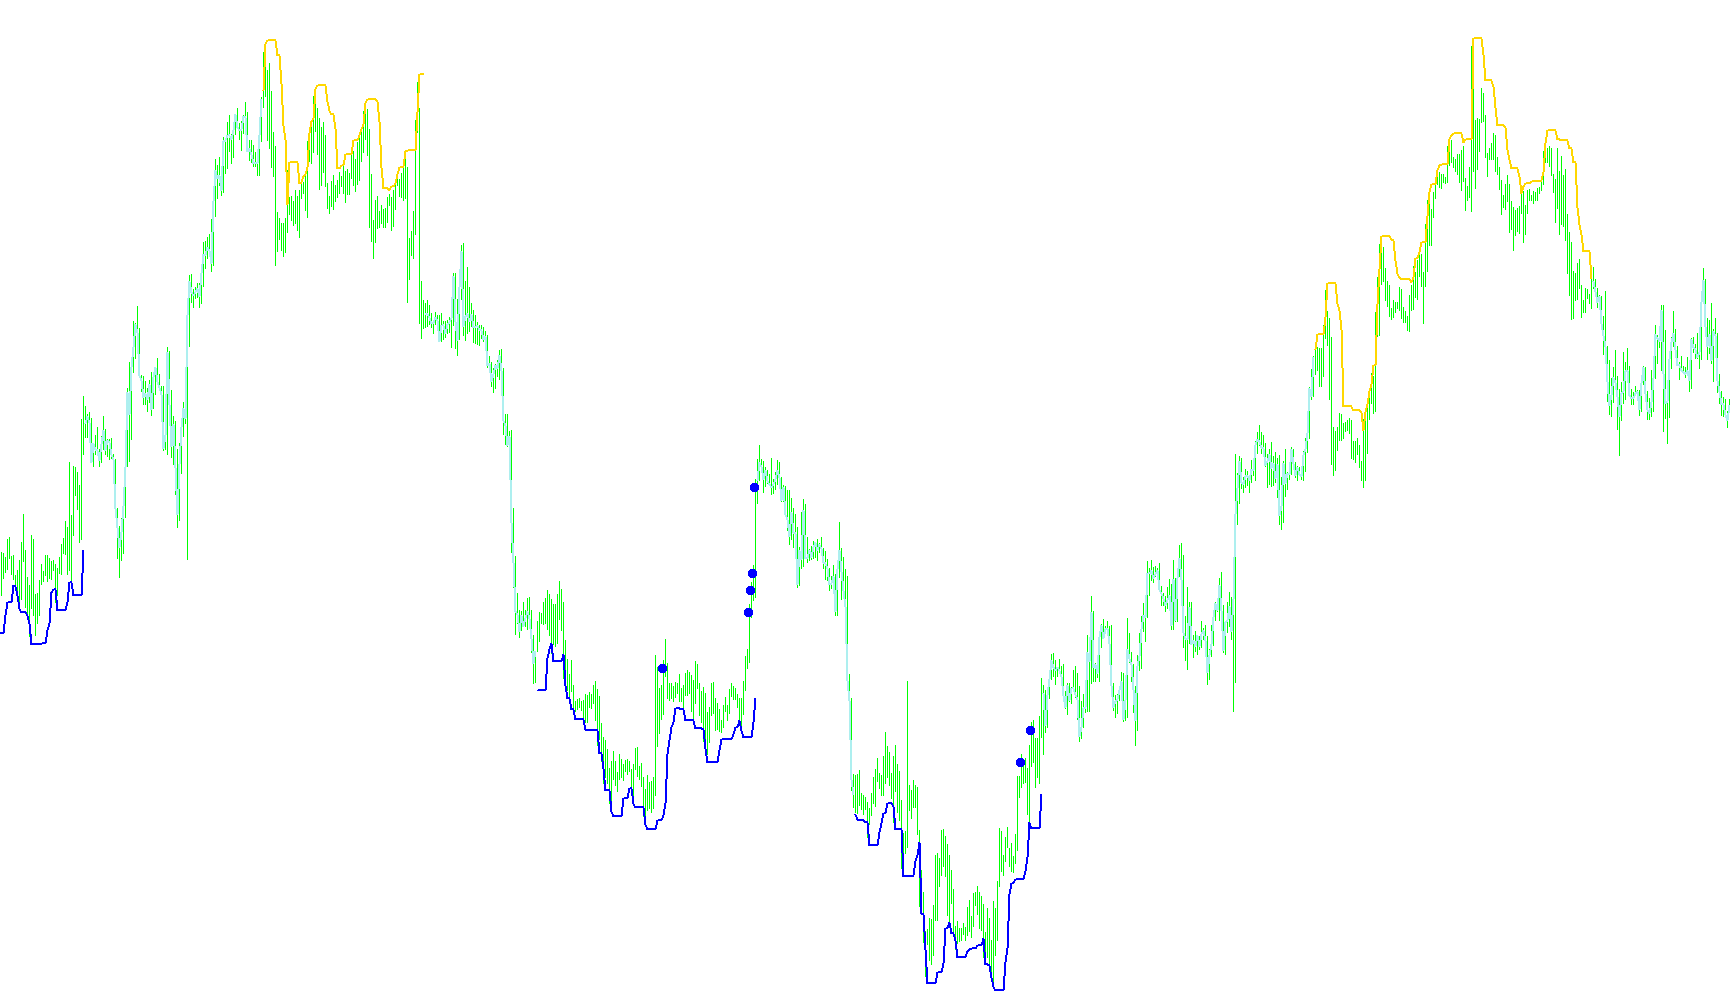
This indicator visualizes price action intensity by projecting a multi-colored gradient onto specific price zones based on historical volatility and touch frequency.

Heijden_MAC3D
Indicator

Heijden_MAC3D

iMA

This indicator identifies hierarchical market structures by analyzing the confluence between short-term EMA clusters and long-term SMA anchors to detect synchronized global and local price momentum.

HeikenAshiCount
Indicator

HeikenAshiCount

This indicator quantifies trend momentum by calculating the cumulative frequency of Heiken Ashi price polarity shifts across consecutive bars.

HeikenAshiHistogram
Indicator

HeikenAshiHistogram

iMAOnArray

This indicator visualizes the absolute volatility of Heiken Ashi price medians while segregating bullish and bearish momentum into distinct histogram components.

HeikenAshiIdea
Indicator

HeikenAshiIdea

iATR

This automated trading system identifies momentum shifts by validating Heiken Ashi candle patterns against ATR-based volatility expansion to execute pending limit orders.

HeikenAshiOscillator
Indicator

HeikenAshiOscillator

iMAOnArray

This indicator quantifies the rate of change between median Heiken Ashi price points to visualize directional momentum and trend velocity.

HeikenAshi_DojiSpotter
Indicator

HeikenAshi_DojiSpotter

This indicator calculates Heiken Ashi values dynamically and highlights specific price candles where the body size is negligible relative to the total range, signaling potential market indecision.

Heiken_Ashi4
Indicator

Heiken_Ashi4

This indicator transforms standard price action into a smoothed candlestick representation by calculating mid-point averages to filter out market noise and highlight underlying directional momentum.

heiken_ashi_arrows
Indicator

heiken_ashi_arrows

This indicator identifies trend shifts by detecting consecutive bullish or bearish price actions within Heiken Ashi open and high/low data streams to trigger visual signals.

HiddenSLandTP
Indicator

HiddenSLandTP

This script identifies active positions and monitors virtual price thresholds to execute automated exits while maintaining a stealthy, broker-invisible visual interface.

highertimeframe
Indicator

highertimeframe

This indicator projects historical price action data from a selected higher timeframe onto the current chart to visualize overarching market structure and trend alignment.

Higher_TimeFrame_Trend
Indicator

Higher_TimeFrame_Trend

iMAiRSI

This indicator identifies macro trend direction by aligning sequential exponential moving averages across higher timeframes while triggering entry signals based on relative strength oscillations and price channel extremes.

Highest-Lowest
Indicator

Highest-Lowest

This indicator plots continuous price boundaries by identifying the peak and trough values within a user-defined historical lookback period.

Indicator

HighLowBands

High_Low_v2
Indicator

High_Low_v2

This indicator identifies and maps structural swing points by evaluating local price oscillations against a rolling window to isolate significant trend reversals.

histogram_blanket
Indicator

histogram_blanket

This indicator identifies and maps alternating local extrema by tracking successive price peaks and troughs to visualize multi-layered structural boundaries.

HMA_Cross
Indicator

HMA_Cross

This indicator identifies trend reversals by detecting the intersection of two distinct Hull Moving Average lines and provides visual signals alongside customizable auditory and textual alerts.

Holt_double_exponential_smoothing_2.2
Indicator

Holt_double_exponential_smoothing_2.2

This indicator utilizes double exponential smoothing to calculate trend bias, slope dynamics, and a projected price horizon based on multi-variant price inputs.

Holt_double_exponential_smoothing_trend
Indicator

Holt_double_exponential_smoothing_trend

This indicator utilizes double exponential smoothing to calculate and visualize momentum trends by isolating the underlying velocity of price movements across multiple data types.

hotkeys
Indicator

hotkeys

Triggers instantaneous multi-timeframe transitions by intercepting specific numeric keypad inputs to update the active chart period.

HPMA102
Indicator

HPMA102

This indicator utilizes a Hodrick-Prescott filter to isolate underlying cycles from noise, identifying structural trends and volatility boundaries through recursive data smoothing.

HPT - Heiken Ashi Smoothed Bar
Indicator

HPT - Heiken Ashi Smoothed Bar

This indicator identifies bullish, bearish, and neutral market states by analyzing consecutive price trends derived from a smoothed Heiken Ashi source.

Indicator

Hurst Difference

H_Bulls_n_Bears
Indicator

H_Bulls_n_Bears

iMA

This indicator quantifies the relative strength between fast and slow weighted moving averages to reveal the prevailing tug-of-war between bullish and bearish market participants.

i-divergencebar
Indicator

i-divergencebar

iAlligator

This indicator identifies potential price reversals by detecting candles that close significantly away from their extremes while interacting with the Alligator moving average boundaries.

i-GentorCCIM_vv1d_0_2
Indicator

i-GentorCCIM_vv1d_0_2

iCCI

This indicator synthesizes fast and slow Commodity Channel Indices to detect trend reversals through zero-line crossovers and historical histogram state transitions.

Indicator

i-MA-ATR-ROC

iATRiMA
i-regr
Indicator

i-regr

This indicator utilizes Gaussian elimination to solve for a variable-degree polynomial regression, constructing a volatility-adjusted price channel based on standard deviation.

I-Regr_Notifier
Indicator

I-Regr_Notifier

Triggers real-time alerts when the current Ask price transpires through pre-calculated linear regression boundaries based on specific standard deviation thresholds.

iACfunc
Indicator

iACfunc

iMAiMAOnArray

Calculates a secondary momentum oscillator by subtracting a smoothed moving average of the Awesome Oscillator from the original Awesome Oscillator value.

iAOfunc
Indicator

iAOfunc

iMA

This function calculates the Awesome Oscillator value by computing the arithmetic difference between two Moving Averages of varying periods on a specific symbol and timeframe.

iBearsBullsfuncs
Indicator

iBearsBullsfuncs

iMA

Quantifies market pressure by calculating the absolute distance between extreme price wicks and smoothed moving average baselines.

iclock_mod1
Indicator

iclock_mod1

A non-tick dependent visual countdown timer that calculates remaining candle time and triggers customizable audio or pop-up alerts on new bar formation.

icrosshair
Indicator

icrosshair

An interactive charting tool that projects dynamic crosshairs to provide real-time candle anatomy metrics and exact coordinate distance calculations upon mouse movement.

IDWma
Indicator

IDWma

Calculates a dynamic moving average by applying a weight to price points inversely proportional to their distance from the current bar across multiple timeframes.

id_lite_info_ma
Indicator

id_lite_info_ma

iMA

This indicator calculates and visualizes the real-time price delta between two moving averages, displaying the results in a customizable on-chart table with dynamic color coding based on trend direction.

ifibonacci
Indicator

ifibonacci

This indicator dynamically renders comprehensive Fibonacci retracements, arcs, fans, and expansions based on ZigZag price swings, while simultaneously overlaying multi-timeframe high/low levels, pivot points, and real-time candle countdowns.

iFractals_4all_TF
Indicator

iFractals_4all_TF

iFractals

Identifies potential reversal points by detecting instances where current candle opening prices breach established upper or lower fractal price extremes.

IH_Fibo
Indicator

IH_Fibo

This indicator automatically identifies recent price extremes to plot real-time Fibonacci retracement levels and extension targets based on detected swing direction.

imaxmintrends
Indicator

imaxmintrends

This indicator plots historical high and low price boundaries across daily, weekly, monthly, and yearly intervals while dynamically projecting trend lines between current and previous period peaks.

impulseMACD
Indicator

impulseMACD

This indicator visualizes three distinct market regimes by plotting high and low price boundaries based on the specific output states of a multi-period MACD derivative.

Imp_MA
Indicator

Imp_MA

This indicator calculates versatile moving averages (SMA, EMA, SMMA, and LWMA) by allowing users to define custom weighted coefficients for Open, High, Low, and Close prices.

Indicator

Ind-Fractals-1t08SEP05s

indi2csv
Indicator

indi2csv

iCCIiATRiMACDiRSI

Synchronizes historical price action and multiple technical oscillators into a structured CSV format for external quantitative analysis.

indicatorarrows
Indicator

indicatorarrows

iMACDiOsMAiMAiStochastic
indicatorcandles
Indicator

indicatorcandles

iCCIiMAiRSI

This indicator projects synthetic price candles onto a separate window based on real-time calculations from PRI, RSI, CCI, or standard price data to visualize momentum and trend strength.

indicator_to_csv
Indicator

indicator_to_csv

iCCIiRSI

This script captures concurrent CCI and RSI oscillator metrics alongside historical OHLCV data to export them into a structured CSV format.

Indicator

ind_aMU

iMA
IND_Monitoring-Spread
Indicator

IND_Monitoring-Spread

The indicator archives and visualizes real-time spread fluctuations by calculating rolling maximum, minimum, and average liquidity costs across specific time intervals.

ind_tracer
Indicator

ind_tracer

Extracts real-time numerical values from specific indicator buffers at a user-defined historical coordinate via interactive vertical line positioning.