Instrument
Download script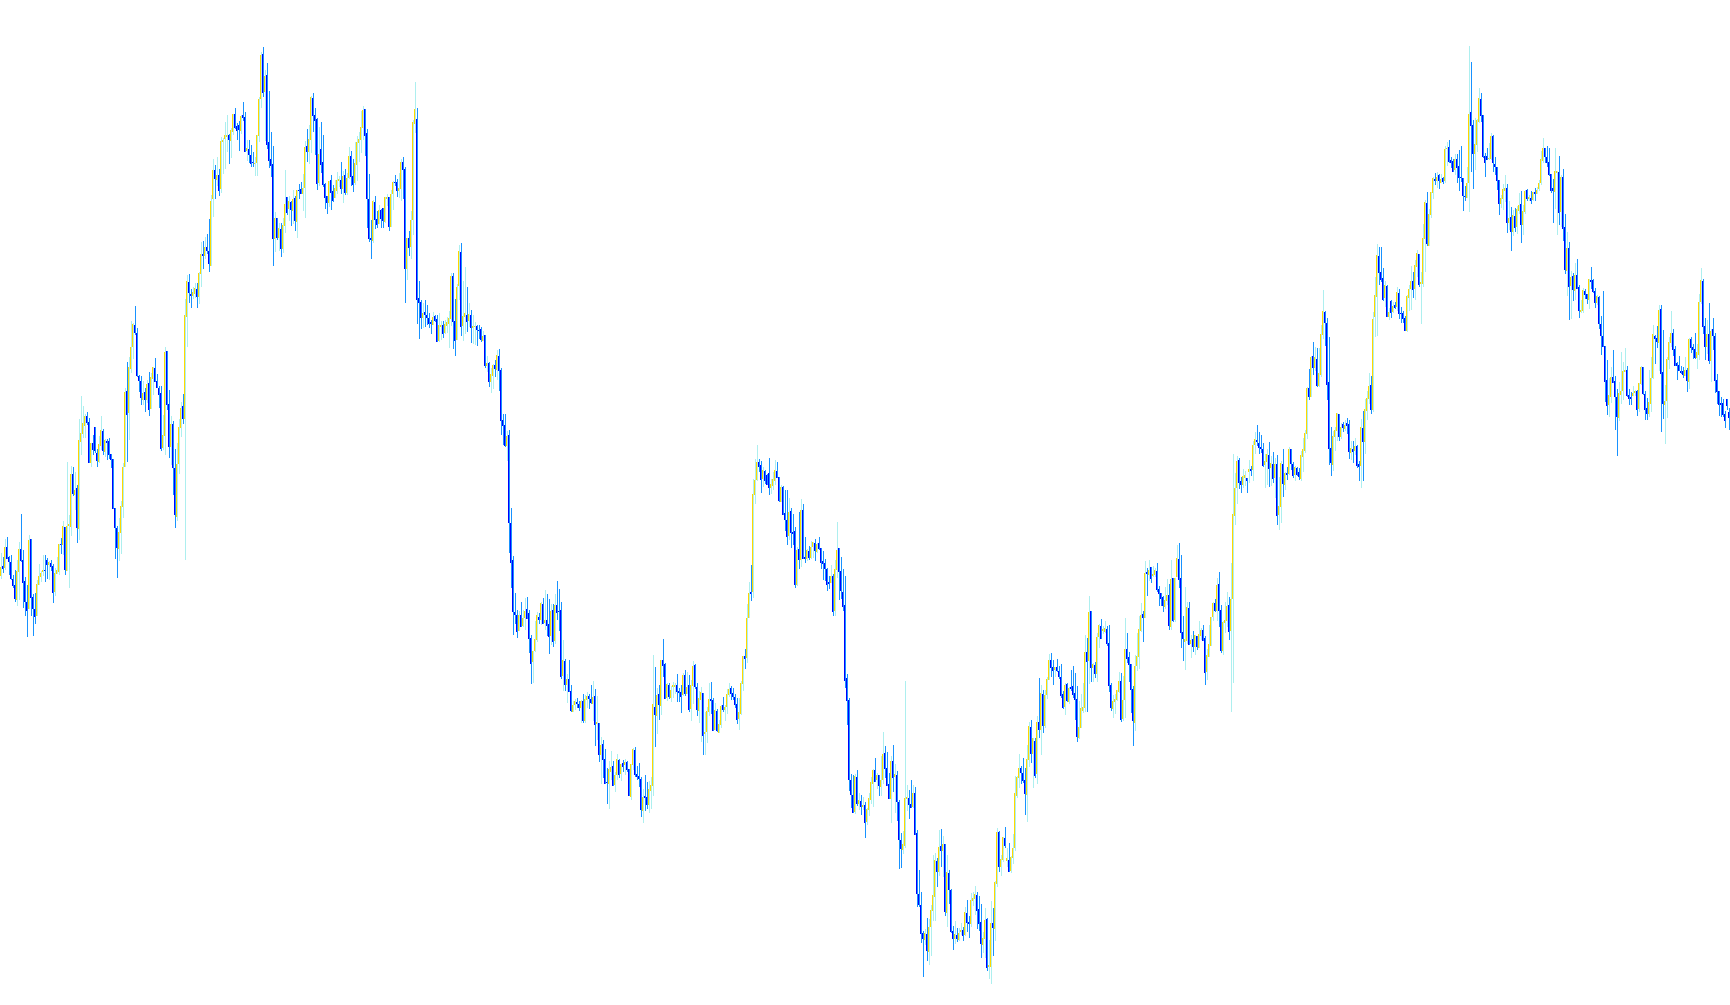
This script is a visual trading tool designed for the MetaTrader platform that maps out price action history on your charts. Rather than using complex mathematical formulas or lagging averages, it focuses on highlighting the physical boundaries of price movement (Highs, Lows, Opens, and Closes) to provide a clear picture of market dynamics.
Core Functionality
The tool works by scanning through historical price data and identifying the extremes of every candle. It visualizes this information using four distinct types of histograms that represent the "body" and the "range" of the price movement.
How the Logic Processes Data
For every candle on your chart, the script looks at four specific values: the High, Low, Open, and Close prices. It then categorizes each candle into one of three scenarios to determine how the visuals should be drawn:
- Bullish Movement (Price closed higher than it opened): The tool identifies the body of the candle and its full range, plotting them clearly to show the upward momentum.
- Bearish Movement (Price closed lower than it opened): The script flips the logic to prioritize the downward movement, highlighting the extent of the price drop relative to where it started.
- Neutral Movement (Price closed exactly where it opened): In cases where there is no directional movement in the body, the script applies a slight offset to ensure the data remains visible on your chart rather than overlapping into a single point.
Key Features and Customization
The logic includes several user-friendly options to tailor the visual experience:
- Shift Controls: You can adjust the "Vertical Shift" to move the markings up or down, and the "Horizontal Shift" to move them forward or backward on the timeline. This is helpful for preventing the markings from overlapping with your current price candles.
- History Depth: You can define exactly how many past bars the script should analyze, allowing you to balance between seeing a vast amount of history or focusing only on recent trends.
- Multi-Instrument Support: While it defaults to the current chart, the logic allows for the tracking of specific instruments and timeframes.
- Visual Themes: There is a dedicated "Gold Color" mode that changes the color scheme of the histograms (switching to Yellows and Oranges), which can be useful for highlighting specific assets or changing your visual aesthetic.
Summary for the Trader
In simple terms, this script acts as a "price map." It takes the raw data of where prices started and ended and paints them onto your screen as distinct visual blocks. This helps you see the relationship between the candle bodies and their total ranges at a glance, making it easier to identify patterns in price volatility and directionality without the clutter of standard technical indicators.
//+------------------------------------------------------------------+
//|                                                   Instrument.mq4 |
//|                                                      Denis Orlov |
//|                                    http://denis-or-love.narod.ru |
/*

Äåíèñ Îðëîâ
http://denis-or-love.narod.ru

***
Âñå ìîè èíäèêàòîðû:
http://codebase.mql4.com/ru/author/denis_orlov
***
ÏÎËÜÇÓÉÒÅÑÜ È ÏÐÎÖÂÅÒÀÉÒÅ!

Sorry for my English!)

Denis Orlov
http://denis-or-love.narod.ru
***
All my indicators:

http://codebase.mql4.com/author/denis_orlov

*/
//+------------------------------------------------------------------+
#property copyright "Denis Orlov"
#property link      "http://denis-or-love.narod.ru"

#property indicator_chart_window
#property indicator_buffers 4

#property indicator_color1 DarkTurquoise
#property indicator_color2 DarkBlue
#property indicator_color3 DarkTurquoise
#property indicator_color4 DarkBlue

double Line1[], Line2[], Line3[], Line4[];

extern string Instrument="";
extern int TimeFrame=0;
extern int VertShift=0;
extern int HorizShift=0;
extern int History=1000;
extern bool GoldColor=False;

//+------------------------------------------------------------------+
//| Custom indicator initialization function                         |
//+------------------------------------------------------------------+
int init()
  {
//---- indicators
   SetIndexStyle(0,DRAW_HISTOGRAM,0,3);
   SetIndexBuffer(0,Line1);
   SetIndexShift( 0, HorizShift);

   SetIndexStyle(1,DRAW_HISTOGRAM,0,3);
   SetIndexBuffer(1,Line2);
   SetIndexShift( 1, HorizShift);

   SetIndexStyle(2,DRAW_HISTOGRAM,0,1);
   SetIndexBuffer(2,Line3);
   SetIndexShift( 2, HorizShift);

   SetIndexStyle(3,DRAW_HISTOGRAM,0,1);
   SetIndexBuffer(3,Line4);
   SetIndexShift( 3, HorizShift);

      if(GoldColor)
      {
         SetIndexStyle(0,DRAW_HISTOGRAM,0,3,Yellow);
         SetIndexStyle(1,DRAW_HISTOGRAM,0,3,Orange);
         SetIndexStyle(2,DRAW_HISTOGRAM,0,1,Yellow);
         SetIndexStyle(3,DRAW_HISTOGRAM,0,1,Orange);
      }

    if (Instrument=="") Instrument=Symbol();
    if (TimeFrame==0) TimeFrame=Period();
    IndicatorShortName(Instrument+" "+PeriodToStr(TimeFrame)+": shift "+VertShift);
//----
   return(0);
  }
//+------------------------------------------------------------------+
//| Custom indicator deinitialization function                       |
//+------------------------------------------------------------------+
int deinit()
  {
//----

//----
   return(0);
  }
//+------------------------------------------------------------------+
//| Custom indicator iteration function                              |
//+------------------------------------------------------------------+
int start()
  {
      int    Counted_bars=IndicatorCounted();
//----
      int      i=Bars-Counted_bars-1;           // Èíäåêñ ïåðâîãî íåïîñ÷èòàííîãî
     if (History>0&&i>History)                 // Åñëè ìíîãî áàðîâ òî ..
       i=History;

      while(i>=0)                      // Öèêë ïî íåïîñ÷èòàííûì áàðàì
      {

             double
           H=iHigh(Instrument, TimeFrame,i),
           L=iLow(Instrument, TimeFrame,i),
           O=iOpen(Instrument,TimeFrame,i),
           C=iClose(Instrument, TimeFrame,i);

           if(C>O)
            {
               Line1[i]=C+VertShift*Point; Line2[i]=O+VertShift*Point;
               Line3[i]=H+VertShift*Point; Line4[i]=L+VertShift*Point;
            }
            else
            if(C<O)
            {
               Line1[i]=C+VertShift*Point; Line2[i]=O+VertShift*Point;
               Line3[i]=L+VertShift*Point; Line4[i]=H+VertShift*Point;
            }
            else
            if(C==O)
            {
               Line1[i]=O+VertShift*Point; Line2[i]=Line1[i]+0.01*Point;
               Line3[i]=L+VertShift*Point; Line4[i]=H+VertShift*Point;
            }


      i--;
      }
//----
   return(0);
  }
//+------------------------------------------------------------------+
string PeriodToStr(int Per)
   {
      switch(Per)                 // Ðàñ÷¸ò êîýôôèöèåíòîâ äëÿ..
      {                              // .. ðàçëè÷íûõ ÒÔ
      case     1: return("M1");  // Òàéìôðåéì Ì1
      case     5: return("M5");  // Òàéìôðåéì Ì5
      case    15: return("M15");  // Òàéìôðåéì Ì15
      case    30: return("M30");  // Òàéìôðåéì Ì30
      case    60: return("H1");  // Òàéìôðåéì H1
      case   240: return("H4");  // Òàéìôðåéì H4
      case  1440: return("D1");  // Òàéìôðåéì D1
      case 10080: return("W1");  // Òàéìôðåéì W1
      case 43200: return("ÌN");  // Òàéìôðåéì ÌN
      }
   }
///=======================
Comments