i_daybears_v1_1
Download script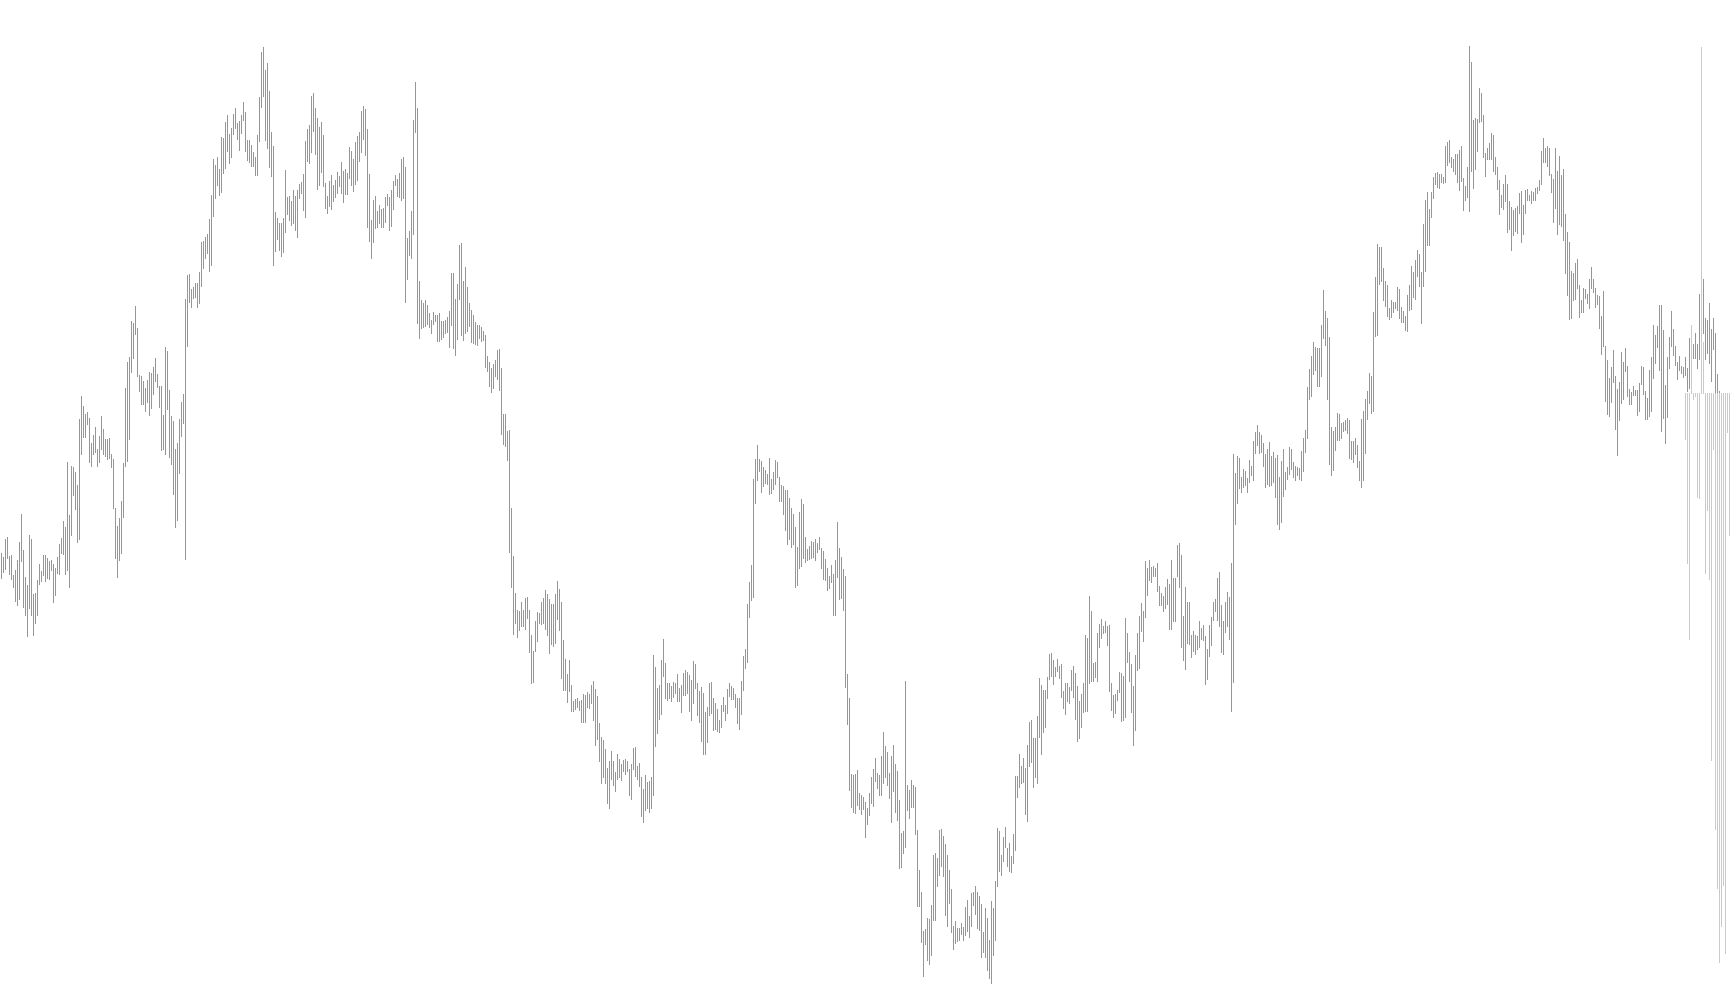
This tool is designed to provide a visual representation of "Bearish Power" on your trading charts. It calculates the momentum and strength of売り (selling) pressure by analyzing price action over specific historical timeframes.
Core Logic and Functionality
Timeframe Compatibility The script is specifically engineered for intraday analysis. It includes a built-in safety check to ensure it is only used on charts with a timeframe smaller than one day. If you attempt to apply it to a daily or higher timeframe, the system will provide an alert, as the underlying math requires more granular data to function correctly.
Dynamic Day Tracking The primary logic of the script involves determining how many trading bars occur within a specific window of time. It looks back at the chart and calculates the number of bars that belong to a single day. This allows the tool to normalize the data, ensuring that the "power" it measures is consistent regardless of how many candles appear in a day on different timeframes.
The Calculation Process For every point on your chart, the script performs the following steps:
- Time Windowing: It identifies a lookback period based on a user-defined setting (the number of days).
- Bar Counting: It iterates through the price history to count exactly how many bars exist within that timeframe.
- Power Measurement: Once it knows the bar count, it feeds that information into a "Bears Power" calculation. This determines the strength of the downward movement relative to the price type selected (such as the opening, closing, or average price).
Visual Representation
The results are displayed in a separate window at the bottom of your trading screen as a histogram.
- The Zero Line: The script includes a silver dotted horizontal line at the zero mark. This acts as your baseline.
- Histogram Bars: The gray bars represent the calculated bear power. When these bars move away from the zero line, they indicate the intensity of the selling pressure during that specific period.
Key User Controls
- Applied Price: Allows you to choose which price point the script should use as its reference (e.g., focusing on where the market actually closed vs. where it opened).
- Days for Calculation: This allows you to adjust the "memory" of the indicator—determining how many days of historical data the script should factor into the current power reading.
//+------------------------------------------------------------------+
//|                                                     DayBears.mq4 |
//|                                 Copyright 2010-2015, Excstrategy |
//|                                        http://www.ExcStrategy.ru |
//+------------------------------------------------------------------+
#property copyright "ExcStrategy"
#property link      "http://www.ExcStrategy.ru"
#property version   "1.1"
#property description "Bears Power"
#property strict
//+------------------------------------------------------------------+
#property indicator_separate_window
#property indicator_buffers 1
#property indicator_color1 Gray
#property indicator_width1 1
#property indicator_level1     0.0
#property indicator_levelcolor clrSilver
#property indicator_levelstyle STYLE_DOT
//----
extern int Applied_price=0;
//----
extern int DaysForCalculation=2;
//---- buffers
double Buffer1[];
//+------------------------------------------------------------------+
//|                                                                  |
//+------------------------------------------------------------------+
int init()
  {
   IndicatorBuffers(1);
//---- indicator lines
   SetIndexStyle(0,DRAW_HISTOGRAM);
   SetIndexBuffer(0,Buffer1);
//----
   SetIndexLabel(0,"Bears");
//---
   DaysForCalculation=DaysForCalculation+1;
//----
   return(0);
  }
//+------------------------------------------------------------------+
//|                                                                  |
//+------------------------------------------------------------------+
int start()
  {
   if(Period()>1400)
     {
      Alert("Error! Period can not be greater than D1");
      return(0);
     }
//----
   int counted_bars=IndicatorCounted();
   int barsday;
   bool rangeday;
   datetime Time1=Time[0],Time2;
//----
   if(counted_bars>0) counted_bars--;
   int limit=Bars-counted_bars;
//----
   for(int i=0; i<limit; i++)
     {
      //----
      rangeday= false;
      barsday = 0;
      //----
      Time2=Time[i]+(1440*60*DaysForCalculation);
      if(Time1<Time2)
         if(i<Bars-MathRound(1500/Period()))
            for(int a=i; a<i+1441; a++)
              {
               //----
               barsday++;
               //----
               if(TimeDayOfYear(Time[a])!=TimeDayOfYear(Time[a+1])) a=i+1442;
              }
      //----
      Buffer1[i]=iBearsPower(NULL,0,barsday,Applied_price,i);
     }
//----
   return(0);
  }
//+------------------------------------------------------------------+
Comments