KoliErBands_Indi
Download script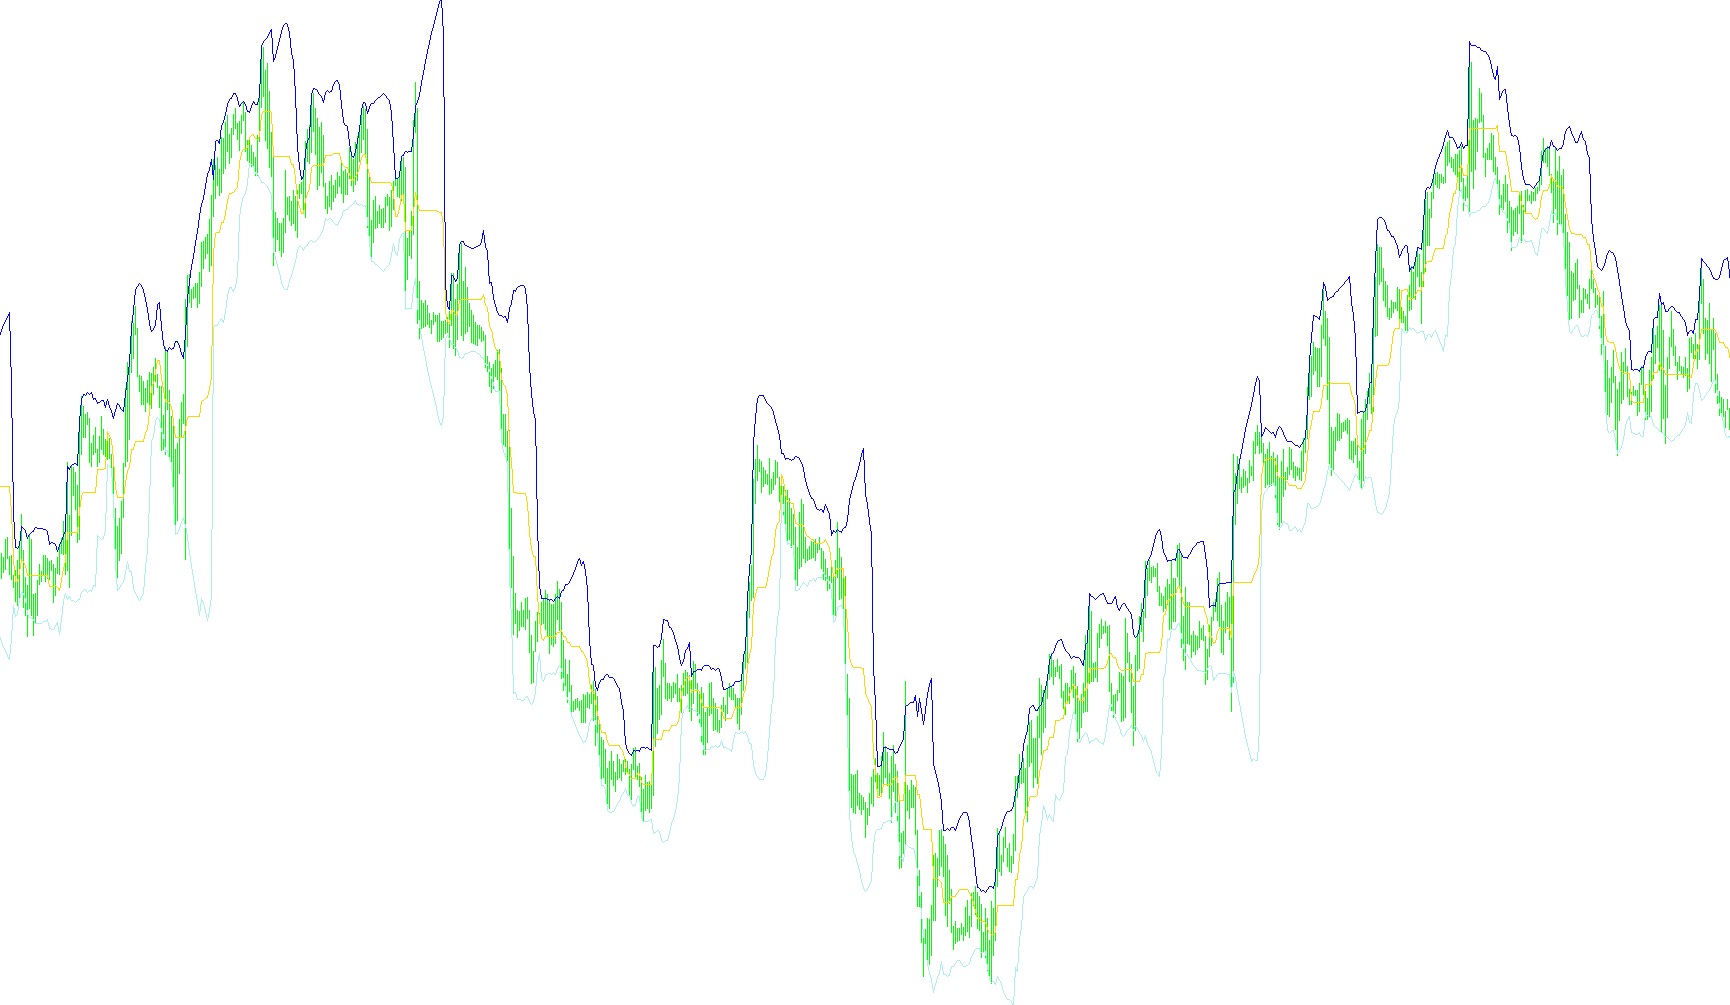
The KoliErBands is a custom technical analysis indicator designed for the MetaTrader 4 platform to help traders visualize market volatility and price boundaries. It identifies key zones where the price may face resistance or support by calculating a central "midline" and an outer boundary based on historical price movement.
Core Logic Overview
The indicator operates through a two-step mathematical process to determine its visual components:
1. Establishing the Baseline (Midline) Instead of simply looking at the current closing price, the tool identifies the highest point reached and the lowest point touched over a specific period (defined by the user). It then calculates the average of these two extremes to create a central baseline. This represents the "equilibrium" price for that specific timeframe.
2. Calculating Volatility Bands Once the central baseline is established, the indicator measures how much the market has fluctuated relative to that midpoint. It performs the following steps:
- Variance Calculation: It analyzes the difference between the actual closing prices and the central baseline over the designated period.
- Standard Deviation: It applies a mathematical formula to calculate the "deviation"—essentially measuring how far the price typically swings away from the middle.
- Band Creation: The indicator then projects an Upper Band (Baseline + Deviation) and a Lower Band (Baseline - Deviation).
Visual Representation
On your trading chart, the script renders three distinct components:
- The Central Line: Represents the calculated midpoint of price action.
- The Upper and Lower Bands: These act as dynamic boundaries. When the price moves significantly toward or outside these bands, it often indicates that the market is stretched in one direction, potentially signaling a reversal or a period of high exhaustion.
User Customization
The logic allows for three primary adjustments to fit different trading styles:
- Period: Determines how far back into the past the indicator looks to calculate its averages and deviations (e.g., looking at the last 14 bars).
- Deviation Level: Adjusts the "width" of the bands. A higher number creates wider bands for more conservative trading, while a lower number creates tighter bands for more sensitive price reactions.
- Bars to Count: Allows the user to limit the calculation to a specific amount of historical data on the chart.
//+------------------------------------------------------------------+
//|                                             KoliErBands_Indi.mq4 |
//|                                       Copyright 2010, KoliEr Li. |
//|                                                 http://kolier.li |
//+------------------------------------------------------------------+
#property copyright "Copyright 2010, KoliEr Li."
#property link      "http://kolier.li"

/*
 * I here get paid to program for you. Just $15 for all scripts.
 *
 * I am a bachelor major in Financial-Mathematics.
 * I am good at programming in MQL for Meta Trader 4 platform. The ability is between medium and top level.
 * No matter what it is, create or modify any indicators, expert advisors and scripts.
 * I will ask these jobs which are not too large, price from $15, surely refundable if you are not appreciate mine.
 * All products will deliver in 3 days.
 * Also, I am providing EA, Indicator and Trade System Improvement Consultant services, contact me for the detail.
 * If you need to have it done, don't hesitate to contact me at: kolier.li@gmail.com
 */

#property indicator_chart_window
#property indicator_buffers 3
#property indicator_color1 Red
#property indicator_width1 1
#property indicator_color2 Red
#property indicator_width2 1
#property indicator_style2 STYLE_DOT
#property indicator_color3 Red
#property indicator_width3 1
#property indicator_style3 STYLE_DOT

//+------------------------------------------------------------------+
//| Universal Constants                                              |
//+------------------------------------------------------------------+

//+------------------------------------------------------------------+
//| User input variables                                             |
//+------------------------------------------------------------------+
extern string IndicatorName = "KoliErBands";
extern int      BarsToCount = 0;    // Set to 0 to count all bars
extern int        KB_Period = 14;   // Peroid of KoliEr Bands
extern int     KB_Deviation = 2;    // Deviation Level

//+------------------------------------------------------------------+
//| Universal variables                                              |
//+------------------------------------------------------------------+
double buffer_kb[], buffer_upper[], buffer_lower[];

//+------------------------------------------------------------------+
//| Custom indicator initialization function                         |
//+------------------------------------------------------------------+
int init()
  {
   IndicatorShortName(IndicatorName);
   SetIndexBuffer(0, buffer_kb);
   SetIndexStyle(0, DRAW_LINE);
   SetIndexLabel(0, "SB");
   SetIndexDrawBegin(0, KB_Period);
   SetIndexBuffer(1, buffer_upper);
   SetIndexStyle(1, DRAW_LINE);
   SetIndexLabel(1, "Upper");
   SetIndexDrawBegin(1, KB_Period);
   SetIndexBuffer(2, buffer_lower);
   SetIndexStyle(2, DRAW_LINE);
   SetIndexLabel(2, "Lower");
   SetIndexDrawBegin(2, KB_Period);

   return(0);
  }

//+------------------------------------------------------------------+
//| Custom indicator deinitialization function                       |
//+------------------------------------------------------------------+
int deinit()
  {
   return(0);
  }

//+------------------------------------------------------------------+
//| Custom indicator iteration function                              |
//+------------------------------------------------------------------+
int start()
  {
   int bars_counted = IndicatorCounted();
   if(bars_counted < 0) {
      return(1);
   }
   else if(bars_counted > 0) {
      bars_counted--;
   }
   int limit = Bars - bars_counted;
   if(BarsToCount>0 && limit>BarsToCount) {
      limit = BarsToCount;
   }

   int i, k;
   double sum, val_old, val_new, deviation;
   for(i=limit; i>=0; i--) {
      buffer_kb[i] = (High[iHighest(Symbol(),0,MODE_HIGH,KB_Period,i)] + Low[iLowest(Symbol(),0,MODE_LOW,KB_Period,i)])/2;
   }

   for(i=limit; i>=0; i--) {
      sum = 0;
      k = i + KB_Period - 1;
      val_old = buffer_kb[i];
      while(k>=i) {
         val_new = Close[k] - val_old;
         sum += val_new*val_new;
         k--;
      }
      deviation = KB_Deviation * MathSqrt(sum/KB_Period);
      buffer_upper[i] = buffer_kb[i] + deviation;
      buffer_lower[i] = buffer_kb[i] - deviation;
   }

   return(0);
  }
Comments