Figurelli RSI
Indicator

Figurelli RSI

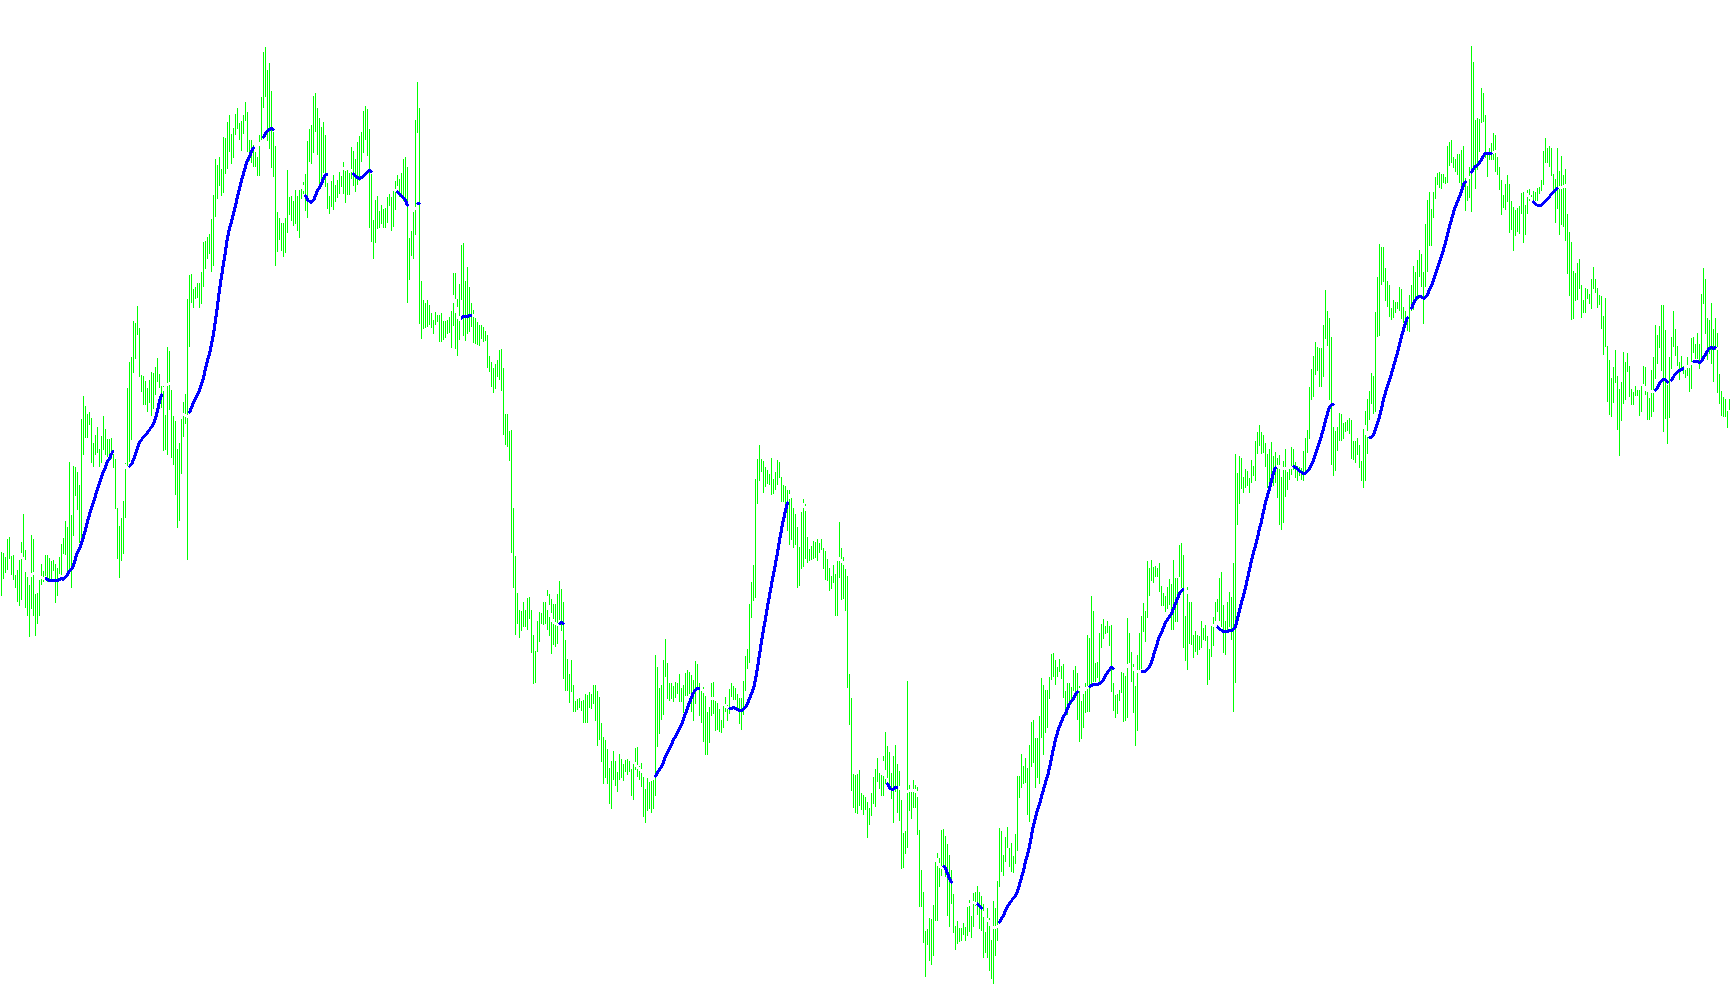
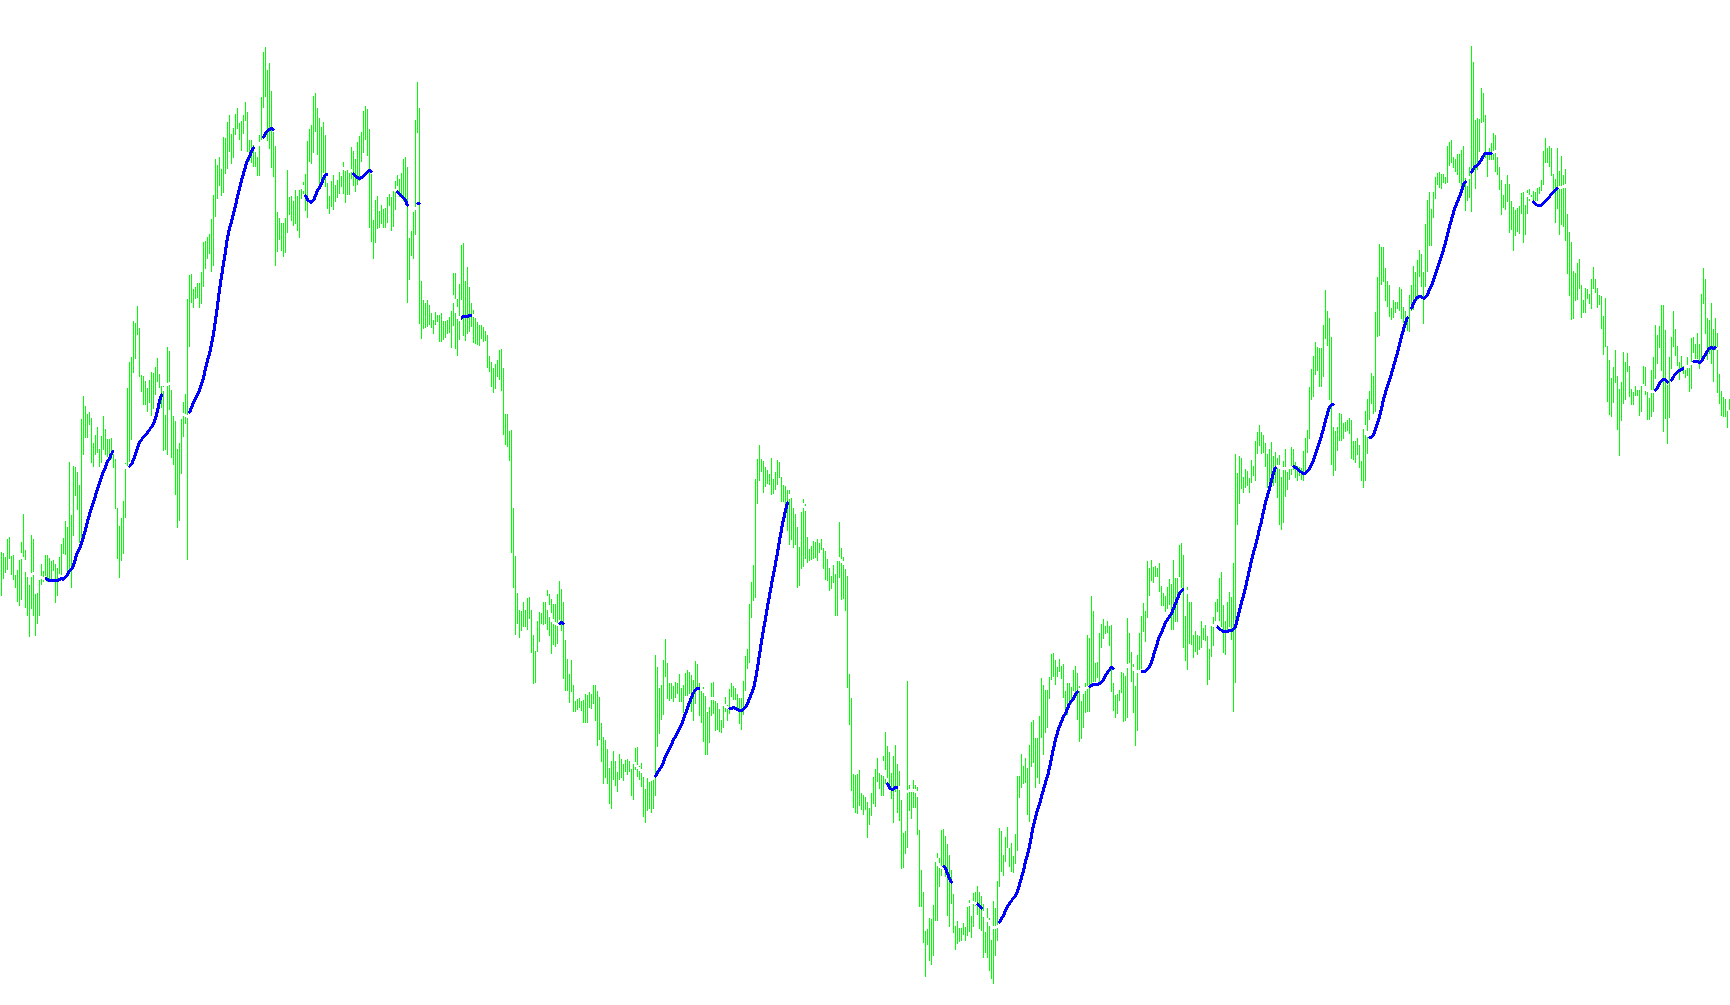
This indicator computes a weighted relative strength ratio utilizing a recursive smoothing technique to stabilize price velocity fluctuations within a defined period.
FineFractalChannel
Indicator

FineFractalChannel

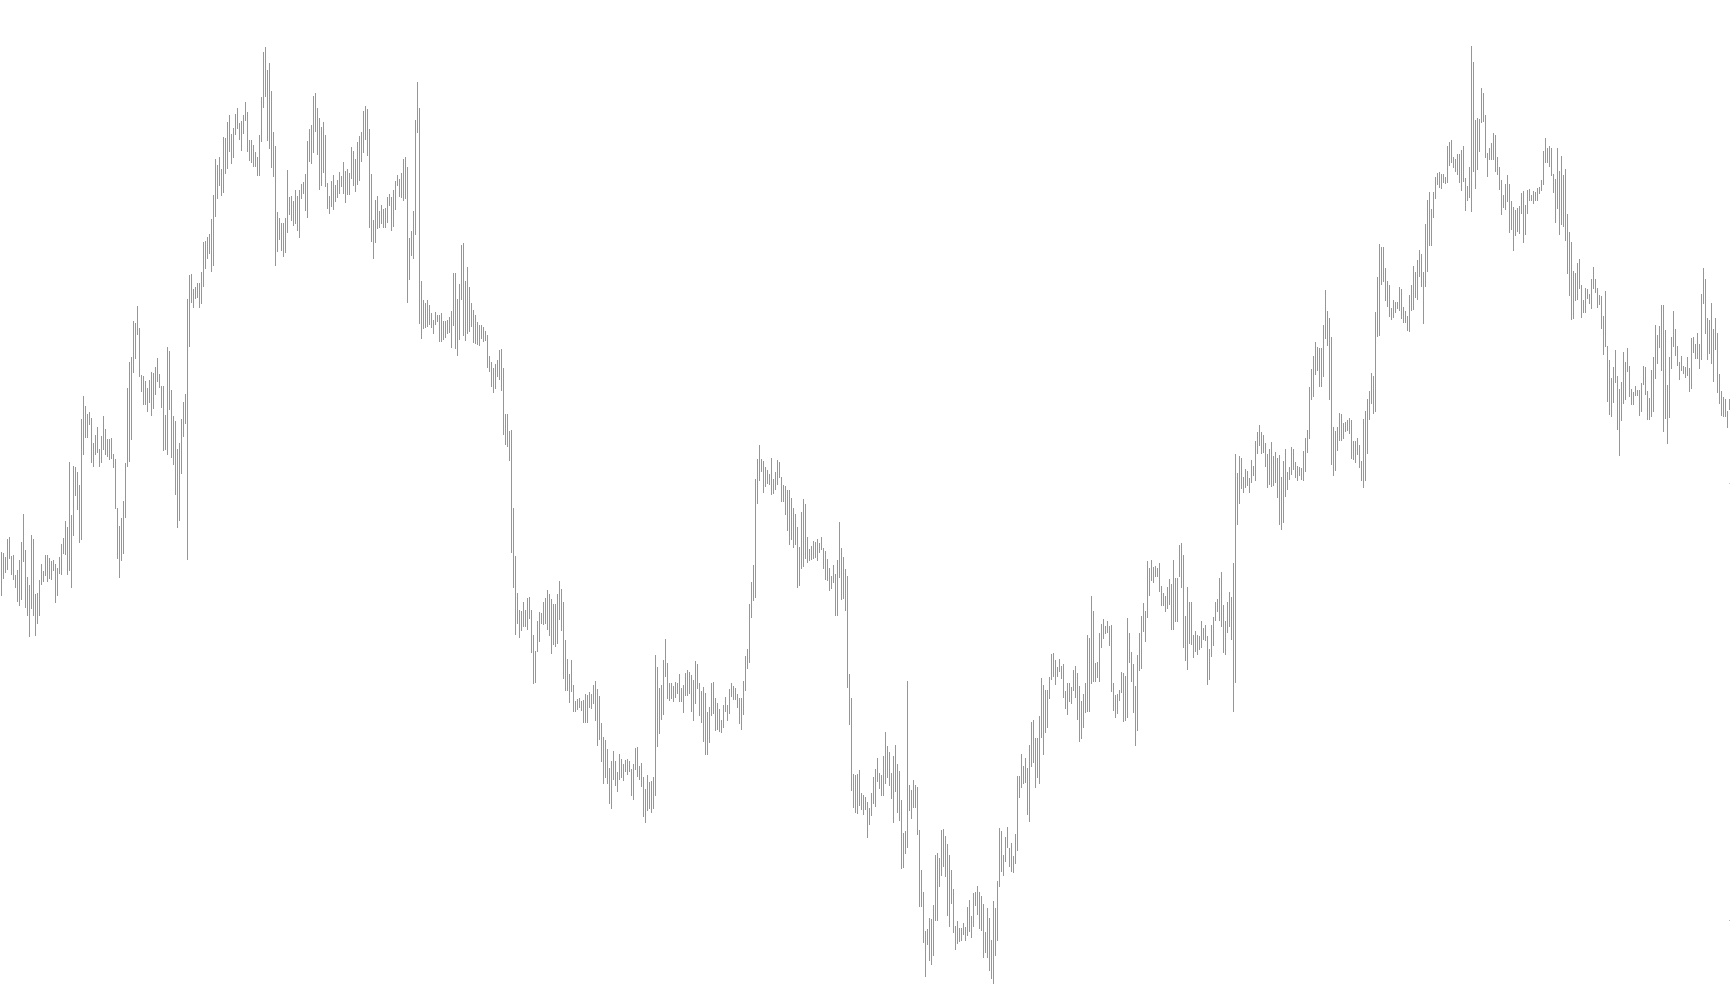
This indicator projects persistent price levels by propagating the most recent local fractal highs and lows into continuous structural corridors.

FixedChartScale
Indicator

FixedChartScale

iATRiMA

This indicator dynamically adjusts the fixed visual price boundaries of a trading chart by calculating margins based on price extremes and relative median averages.

flag_and_pennant
Indicator

flag_and_pennant

This indicator identifies specific chart formations by calculating linear regression slopes and price deviations to project potential flag and pennant trend continuations.

floatingspread
Indicator

floatingspread

This indicator dynamically calculates and plots the real-time point-based bid-ask spreads for multiple predefined currency pairs simultaneously in a separate visual window.

forexdegrees
Indicator

forexdegrees

iWPRiMAiRSIiStochastic

This indicator quantifies the relative position of price or technical oscillators as angular degrees within a dynamic window to identify trend shifts and momentum velocity.

forexline
Indicator

forexline

iMA

This indicator identifies bullish and bearish trends by monitoring the crossover relationship between multi-layered Linear Weighted Moving Averages to plot dynamic directional boundaries.

forexline_update_01
Indicator

forexline_update_01

iMA

This indicator identifies trend shifts and price-to-mean deviations by analyzing the hierarchical crossovers of multiple Linear Weighted Moving Averages with automated real-time alert triggers.

forexline_update_03
Indicator

forexline_update_03

iMACDiMAiMAOnArray

This indicator synthesizes nested Linear Weighted Moving Averages with MACD momentum filtering and price action confirmation to identify high-probability trend reversals and continuation signals.

forexline__update_02
Indicator

forexline__update_02

iMAiMAOnArray

This indicator utilizes nested Linear Weighted Moving Averages to identify trend direction and triggers multi-stage alerts based on price crossovers and momentum shifts relative to a primary baseline.

ForexSession
Indicator

ForexSession

This indicator visualizes the opening and closing windows of major global financial markets by calculating GMT offsets to plot specific trading sessions on a sub-window.

Indicator

forex__news_market_clock

Four_legs
Indicator

Four_legs

Visualizes the spatial relationship and synchronization between a candle's High, Low, Open, and Close values across a customizable period.

Fozzy_Alert
Indicator

Fozzy_Alert

iMAOnArrayiRSI

This indicator identifies momentum shifts by generating Bollinger Band envelopes over a smoothed RSI Moving Average to detect volatility-adjusted trend reversals.

FPI-levels
Indicator

FPI-levels

The indicator calculates the mathematical discrepancy between the product of three currency pairs to identify synthetic price inefficiencies and triangular arbitrage opportunities.

fq_head_fake
Indicator

fq_head_fake

iATR

Identifies bullish or bearish trend reversals by detecting significant price spikes that fail to sustain momentum against previous structural lows or highs.

fract1
Indicator

fract1

This indicator aggregates high, low, and average price range data across multiple timeframes to visualize relative volatility shifts and market momentum.

FractalsMod
Indicator

FractalsMod

Identifies local price extremes by verifying if a bar's high or low exceeds the highest/lowest values within a customizable surrounding range of candles.

FractalSupportResistance
Indicator

FractalSupportResistance

This indicator identifies and plots horizontal price levels by scanning for multi-timeframe fractal peaks and troughs to visualize key structural boundaries.

FractalZigZagNoRepaint
Indicator

FractalZigZagNoRepaint

This indicator identifies non-repainting structural pivot points by validating fractal extremes against the historical price oscillations of a standard ZigZag algorithm.

friday_line
Indicator

friday_line

This indicator scans historical price data to identify and plot vertical visual demarcations at the exact transition point between consecutive weeks.

future_indicator
Indicator

future_indicator

iMA

This indicator synthesizes T3 moving averages with Heikin Ashi price smoothing to generate trend-following reversal signals and volatility-filtered price action.

FX Sniper's MA Cross
Indicator

FX Sniper's MA Cross

iMA

This indicator visualizes bullish and bearish momentum by contrasting the relative positions of two configurable moving averages through a dual-color histogram.

FXBay_-_MACD
Indicator

FXBay_-_MACD

iMAiMAOnArray

This indicator calculates the differential between two exponential moving averages and visualizes the momentum variance through a three-component histogram and signal line system.

FXTT_MTF_BollingerBands
Indicator

FXTT_MTF_BollingerBands

iBands

This tool synchronizes and visualizes Bollinger Band envelopes across nine distinct temporalities simultaneously to identify multi-layered volatility boundaries.

FXTT_StrategyChecklist
Indicator

FXTT_StrategyChecklist

An interactive graphical interface that allows traders to define, track, and persist custom multi-step execution protocols across different trading symbols.

f_rsi
Indicator

f_rsi

iMA

This indicator calculates a modified Relative Strength Index using smoothed price momentum and generates dynamic upper and lower boundary levels based on the standard deviation of historical RSI values.

gainlossinfo
Indicator

gainlossinfo

This indicator dynamically overlays visual markers on price bars to represent specific percentage and pip fluctuations relative to either the opening price or the previous candle's close.

Gap_Finder_01
Indicator

Gap_Finder_01

This tool identifies significant price discontinuities by detecting bullish and bearish price jumps while monitoring whether those gaps have been structurally filled or remain open.

garch
Indicator

garch

The indicator quantifies market turbulence by recursively modeling the conditional variance of price residuals using alpha and beta coefficients to track evolving volatility clusters.

Gioteen-Norm
Indicator

Gioteen-Norm

iMA

This indicator quantifies price momentum by calculating the normalized difference between the current price and its moving average relative to the standard deviation.

GMACD
Indicator

GMACD

iMACD

This indicator synchronizes MACD signals across multiple timeframes to visualize trend strength, identify sideways consolidation, and detect directional alignment between micro and macro scales.

Indicator

GruchaChannel

Grucha_percentage_Index_V2
Indicator

Grucha_percentage_Index_V2

iMAOnArray

This indicator quantifies the relative distribution of bullish versus bearish candle magnitudes over a defined period to generate a percentage-based momentum index.

guppy_long
Indicator

guppy_long

iMA

This indicator plots six progressive Exponential Moving Averages to visualize trend momentum and structural flow through multi-layered curvature.

guppy_multiple_moving_averages
Indicator

guppy_multiple_moving_averages

iMA

This indicator visualizes market sentiment by plotting multiple fast and slow exponential moving averages alongside a long-term baseline to identify trend direction and volatility.

guppy_short
Indicator

guppy_short

iMA

This indicator visualizes a stack of six concurrent exponential moving averages with distinct temporal offsets to identify structural momentum and price equilibrium.

GZigZag
Indicator

GZigZag

This algorithm identifies significant price structural reversals by filtering out minor fluctuations and mapping high-low pivots based on depth, deviation, and backstep parameters.

Hamyar Calculate
Indicator

Hamyar Calculate

iATR

This indicator computes dynamic pivot points based on high and low extremes while simultaneously capturing Average True Range (ATR) values across five distinct timeframes to analyze multi-dimensional price action.

Hamyar Zones
Indicator

Hamyar Zones

This indicator identifies multi-day pivot levels and projects volatility-adjusted support and resistance zones based on historical ATR deviations.

Indicator

Hamyar-V2

iACiATRiMAiStdDev
HamyarPivots
Indicator

HamyarPivots

This indicator calculates dynamic support and resistance levels using four distinct methodologies including Standard, Mid, Fibonacci, and Camarilla pivot logic based on historical price volatility.

HamyarTrend
Indicator

HamyarTrend

iMA

This indicator generates directional signals by comparing current closing prices against Simple Moving Average bounds of high and low prices over a specific lookback period.

HamyarTrend_Candles
Indicator

HamyarTrend_Candles

This indicator dynamically re-renders price candle graphics on the chart by filtering data through external trend signals to highlight specific volatility movements.

Indicator

Happy New Year

harami_ma_rsi_macd
Indicator

harami_ma_rsi_macd

iATRiMACDiMAiRSI

This indicator identifies potential trend reversals by detecting Harami candlestick patterns validated through concurrent Moving Average, RSI momentum, and MACD trend filters.

harmonikmanual
Indicator

harmonikmanual

This indicator parses CSV-based harmonic pattern parameters to validate the mathematical integrity of XABCD price segments and project potential reversal levels.

harmonman
Indicator

harmonman

This indicator identifies harmonic XABCDE price structures by validating geometric ratios against an external database and projecting potential support/resistance zones.

hashi_sub
Indicator

hashi_sub

This indicator renders smoothed Heiken Ashi price action candles into a separate subwindow while simultaneously projecting real-time Bid and Ask horizontal lines.

heatmap-gradient-scale
Indicator

heatmap-gradient-scale

This indicator dynamically monitors multiple symbols from the Market Watch list to display real-time percentage variations through a color-coded visual dashboard.