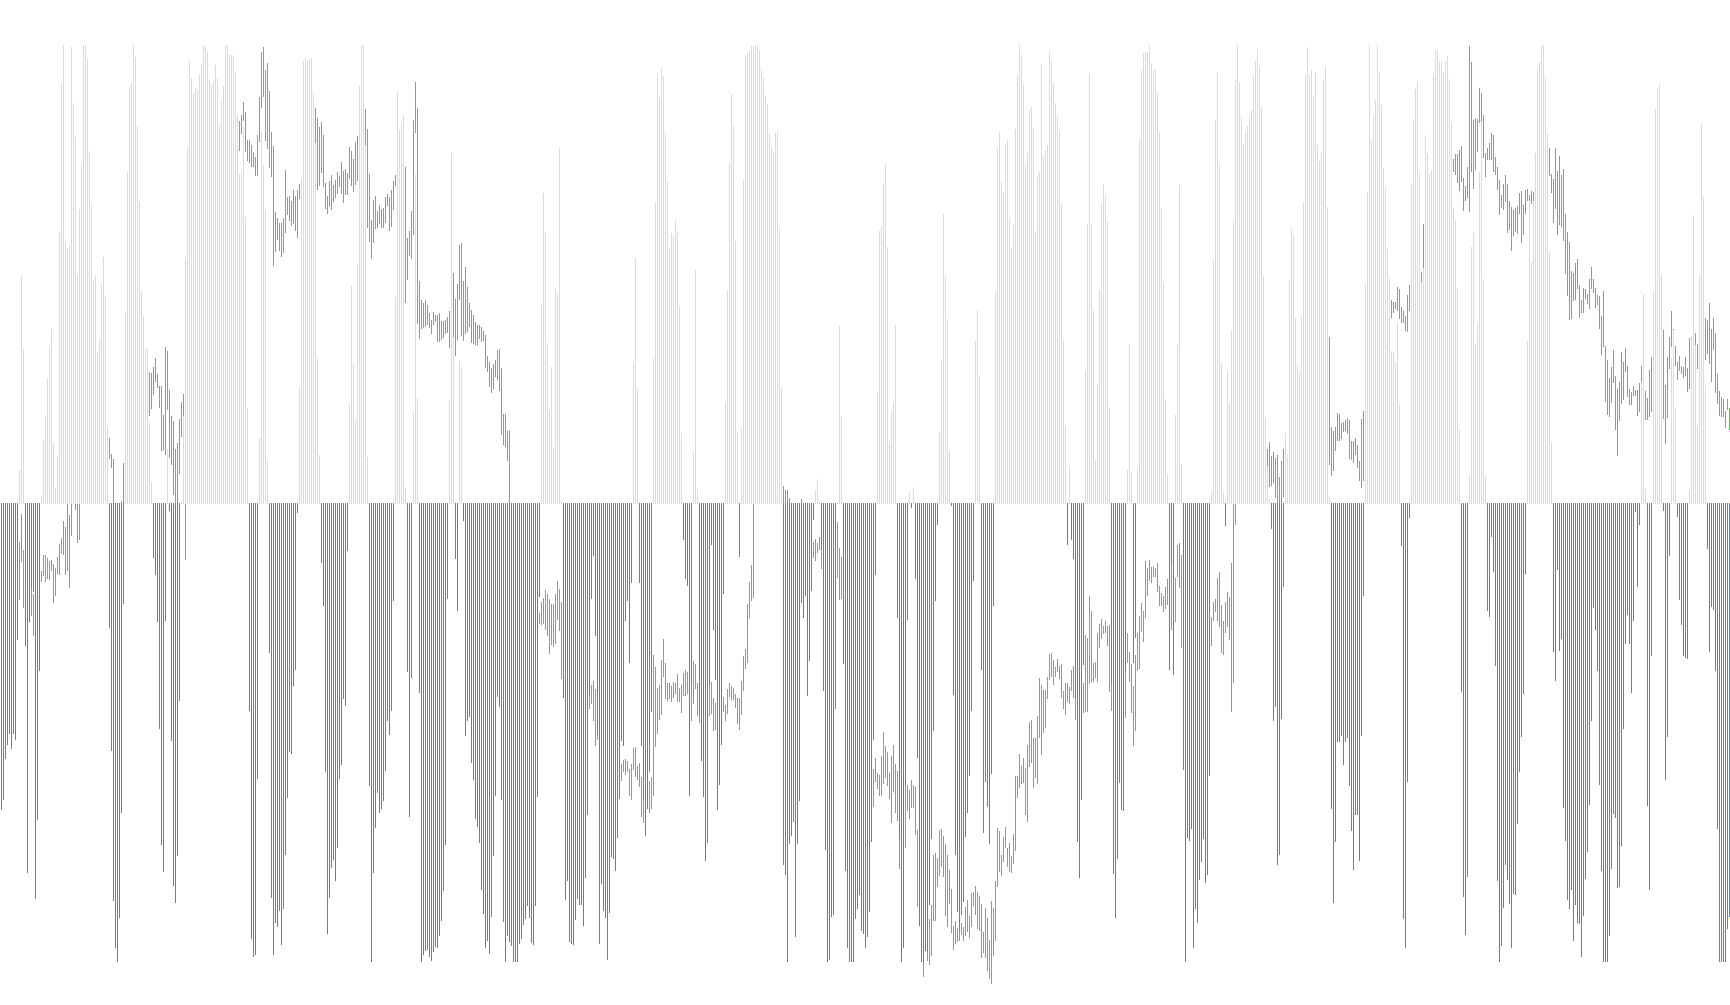
This script is a specialized technical analysis tool designed for the MetaTrader 4 platform. It enhances the standard Stochastic Oscillator—a common momentum indicator used by traders to identify overbought and oversold conditions—by transforming it into a visual histogram that highlights specific price extremes.
Core Logic Overview
The primary purpose of this script is to filter out "noise" from the standard Stochastic lines and visually emphasize only those moments when the market enters high-intensity zones. Instead of showing a continuous line, it focuses on the behavior of the price relative to two specific thresholds: the Overbought level (set at 50) and the Oversold level (set at 50).
How the Analysis Works
-
Data Processing: The script continuously calculates the standard Stochastic values (%K and %D) based on user-defined periods (such as the K-period, D-period, and Slowing factor). These variables determine how fast or slow the indicator reacts to price changes.
-
Threshold Monitoring: The logic scans every price candle to check if the momentum has crossed the predefined boundaries:
- Upper Boundary: If the indicator value exceeds 50, it identifies a significant upward momentum.
- Lower Boundary: If the indicator value drops below 50, it identifies significant downward momentum.
-
Dynamic Histogram Generation: Unlike a standard indicator that simply plots a line, this script uses a mathematical calculation to "stretch" or "scale" the values once they cross these thresholds. When a threshold is breached:
- It creates a visual Histogram.
- The height of the histogram is calculated by measuring how far the value has moved beyond the 50-point mark, then doubling that distance.
- This results in an exaggerated visual representation that makes it much easier for a trader to see the intensity of the overbought or oversold move at a glance.
Visual Output
The script produces two distinct histogram types:
- Stochastic Up: Represents bullish momentum (appearing when values are high).
- Stochastic Down: Represents bearish momentum (appearing when values are low).
By using this logic, the tool effectively cleans up the trading chart, hiding the minor fluctuations of the market and only displaying prominent bars when the price action reaches significant levels.
//+------------------------------------------------------------------+
//| KawaseOsyo_StochasticHistgram.mq4 |
//| Copyright © 2011, KawaseOsyo, Syotaro Yoshida |
//| http://www.kawaseosyo.com/ |
//+------------------------------------------------------------------+
#property copyright "Copyright By KawaseOsyo,TransEdge co.,Ltd."
#property link "http://www.kawaseosyo.com/"
#property indicator_separate_window
#property indicator_buffers 4
#property indicator_color1 Orange
#property indicator_color2 White
#property indicator_color3 RoyalBlue
#property indicator_color4 Red
#property indicator_style1 STYLE_SOLID
#property indicator_style2 STYLE_SOLID
#property indicator_style3 STYLE_SOLID
#property indicator_style4 STYLE_SOLID
#property indicator_width1 1
#property indicator_width2 1
#property indicator_width3 3
#property indicator_width4 3
// ¡¡¡ xC
#property indicator_levelcolor DarkGray
#property indicator_maximum 100
#property indicator_minimum -100
#define OVER_BOUGHT 50
#define OVER_SOLD 50
// ¡¡¡ p[^
extern string URL = "www.kawaseosyo.com";
extern int KPeriod = 14; // %K
extern int DPeriod = 3; // %D
extern int Slowing = 3; // Slow Stochastic
// ¡¡¡ obt@
double m_factorK[];
double m_factorD[];
double m_up[];
double m_down[];
// ¡¡¡¡¡¡¡¡¡ úÝè ¡¡¡¡¡¡¡¡¡
int init()
{
// ¡¡¡ obt@Ýè
SetIndexBuffer( 0, m_factorK ); // %K
SetIndexBuffer( 1, m_factorD ); // %D
SetIndexBuffer( 2, m_up ); // Up
SetIndexBuffer( 3, m_down ); // Down
// ¡¡¡ `æ
SetIndexStyle ( 0, DRAW_NONE );// %K
SetIndexStyle ( 1, DRAW_NONE );// %D
SetIndexStyle ( 2, DRAW_HISTOGRAM );// Stochastic Up (%K)
SetIndexStyle ( 3, DRAW_HISTOGRAM );// Stochastic Down(%K)
SetIndexLabel ( 0, "%K" );
SetIndexLabel ( 1, "%D" );
SetIndexLabel ( 2, "Stochastic Up");
SetIndexLabel ( 3, "Stochastic Down");
// ¡¡¡ CWP[^¼Ýè
string shortName = "KawaseOsyo Stochastic Histogram(" + KPeriod +","+ DPeriod +","+ Slowing +")";
return(0);
}
// ¡¡¡¡¡¡¡¡¡ C ¡¡¡¡¡¡¡¡¡
int start()
{
int limit = Bars - IndicatorCounted();
if(IndicatorCounted()<0) return(-1);
// ¡¡¡ XgLXvZ
for( int j=limit ; j>=0 ; j--){
m_factorK[j] = iStochastic( NULL, 0, KPeriod, DPeriod, Slowing, MODE_SMA, 1, MODE_MAIN, j);
m_factorD[j] = iStochastic( NULL, 0, KPeriod, DPeriod, Slowing, MODE_SMA, 1, MODE_SIGNAL,j);
}
// ¡¡¡ XgLXÌFï
for( int i=limit ; i>=0; i--){
m_up[i]=EMPTY_VALUE;
m_down[i]=EMPTY_VALUE;
// ¡¡¡ Abvgh
if( m_factorK[i] > OVER_BOUGHT ){
m_up[i] = GetValue(m_factorK[i]);
}
// ¡¡¡ _Egh
if( m_factorK[i] < OVER_SOLD ){
m_down[i] = GetValue(m_factorK[i]);
}
}
return(0);
}
// ¡¡¡¡¡¡¡¡¡ XgLXÌlÏ· ¡¡¡¡¡¡¡¡¡
double GetValue( double value )
{
return( (value-OVER_BOUGHT)*2.0);
}
Comments