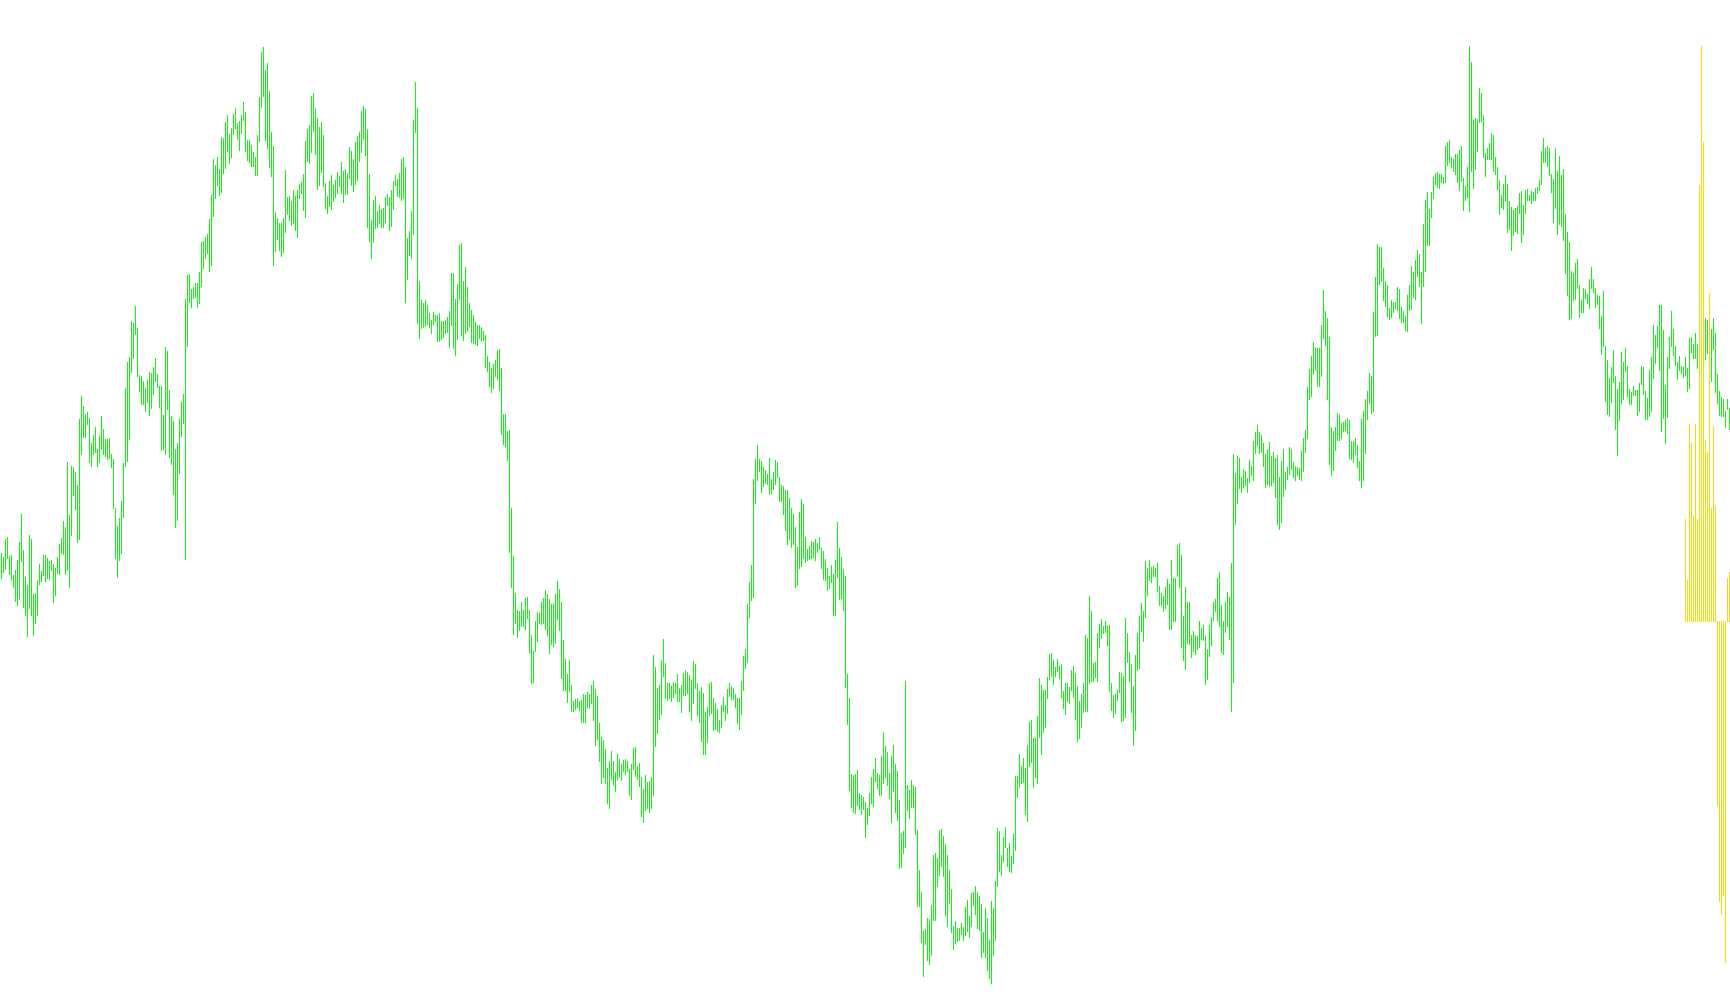
This tool is designed to help traders visualize the relative strength of "bullish" momentum—essentially measuring how much upward pressure is being exerted in the market. It operates by analyzing historical price action over a specific timeframe to determine whether buyers are in control.
Core Logic and Functionality
Timeframe Sensitivity The script includes a built-in safety check to ensure it is used on appropriate charts. It is specifically designed for intraday analysis; if you attempt to run it on a daily chart or higher, the system will notify you that the timeframe is too large, as the logic relies on movements occurring within a single day.
Data Processing and Calculation Instead of looking at just the most recent price movement, the tool performs a deep dive into the historical data:
- Dynamic Time Window: The script looks back at a specific duration (defined by the user) to calculate the "Bulls Power."
- Bar Counting: It automatically counts the number of trading sessions or price bars that occur within a 24-hour period. This allows the indicator to remain accurate regardless of whether you are viewing a 5-minute, 15-minute, or hourly chart.
- Momentum Calculation: By analyzing these bars, it calculates a specific power value. This value represents the accumulated strength of the "bulls" (buyers) during that period.
Visual Representation The output is displayed as a histogram in a separate window below your main price chart.
- The Zero Line: There is a designated baseline (a silver dotted line).
- Histogram Movement: The bars move above and below this line. When the bars are significant, they indicate the strength of the buying pressure. It provides a visual "pulse" of the market's upward energy, making it easier to see when momentum is building or fading.
Summary for the User
In simple terms, this script acts as a momentum meter. It looks at the last 24 hours of trading, counts how many price movements occurred, and translates that activity into a visual histogram. It helps you identify whether the market is being driven by strong buying pressure (Bulls Power) or if that momentum is weakening.
//+------------------------------------------------------------------+
//|                                                     DayBulls.mq4 |
//|                                 Copyright 2010-2015, Excstrategy |
//|                                        http://www.ExcStrategy.ru |
//+------------------------------------------------------------------+
#property copyright "ExcStrategy"
#property link      "http://www.ExcStrategy.ru"
#property version   "1.1"
#property description "Bulls Power"
#property strict
//+------------------------------------------------------------------+
#property indicator_separate_window
#property indicator_buffers 1
#property indicator_color1 Gray
#property indicator_width1 1
#property indicator_level1 0.0
#property indicator_levelcolor clrSilver
#property indicator_levelstyle STYLE_DOT
//----
extern int Applied_price=0;
//----
extern int DaysForCalculation=2;
//---- buffers
double Buffer1[];
//+------------------------------------------------------------------+
//|                                                                  |
//+------------------------------------------------------------------+
int init()
  {
   IndicatorBuffers(1);
//---- indicator lines
   SetIndexStyle(0,DRAW_HISTOGRAM);
   SetIndexBuffer(0,Buffer1);
//----
   SetIndexLabel(0,"Bulls");
//---
   DaysForCalculation=DaysForCalculation+1;
//----
   return(0);
  }
//+------------------------------------------------------------------+
//|                                                                  |
//+------------------------------------------------------------------+
int start()
  {
   if(Period()>1400)
     {
      Alert("Error! Period can not be greater than D1");
      return(0);
     }
//----
   int counted_bars=IndicatorCounted();
   int barsday;
   bool rangeday;
   datetime Time1=Time[0],Time2;
//-----
   if(counted_bars>0) counted_bars--;
   int limit=Bars-counted_bars;
//----
   for(int i=0; i<limit; i++)
     {
      //----
      rangeday= false;
      barsday = 0;
      //----
      Time2=Time[i]+(1440*60*DaysForCalculation);
      if(Time1<Time2)
         if(i<Bars-MathRound(1500/Period()))
            for(int a=i; a<i+1441; a++)
              {
               //----
               barsday++;
               //----
               if(TimeDayOfYear(Time[a])!=TimeDayOfYear(Time[a+1])) a=i+1442;
              }
      //----
      Buffer1[i]=iBullsPower(NULL,0,barsday,Applied_price,i);
     }
//----
   return(0);
  }
//+------------------------------------------------------------------+
Comments