kijun_candles_two_colors
Download script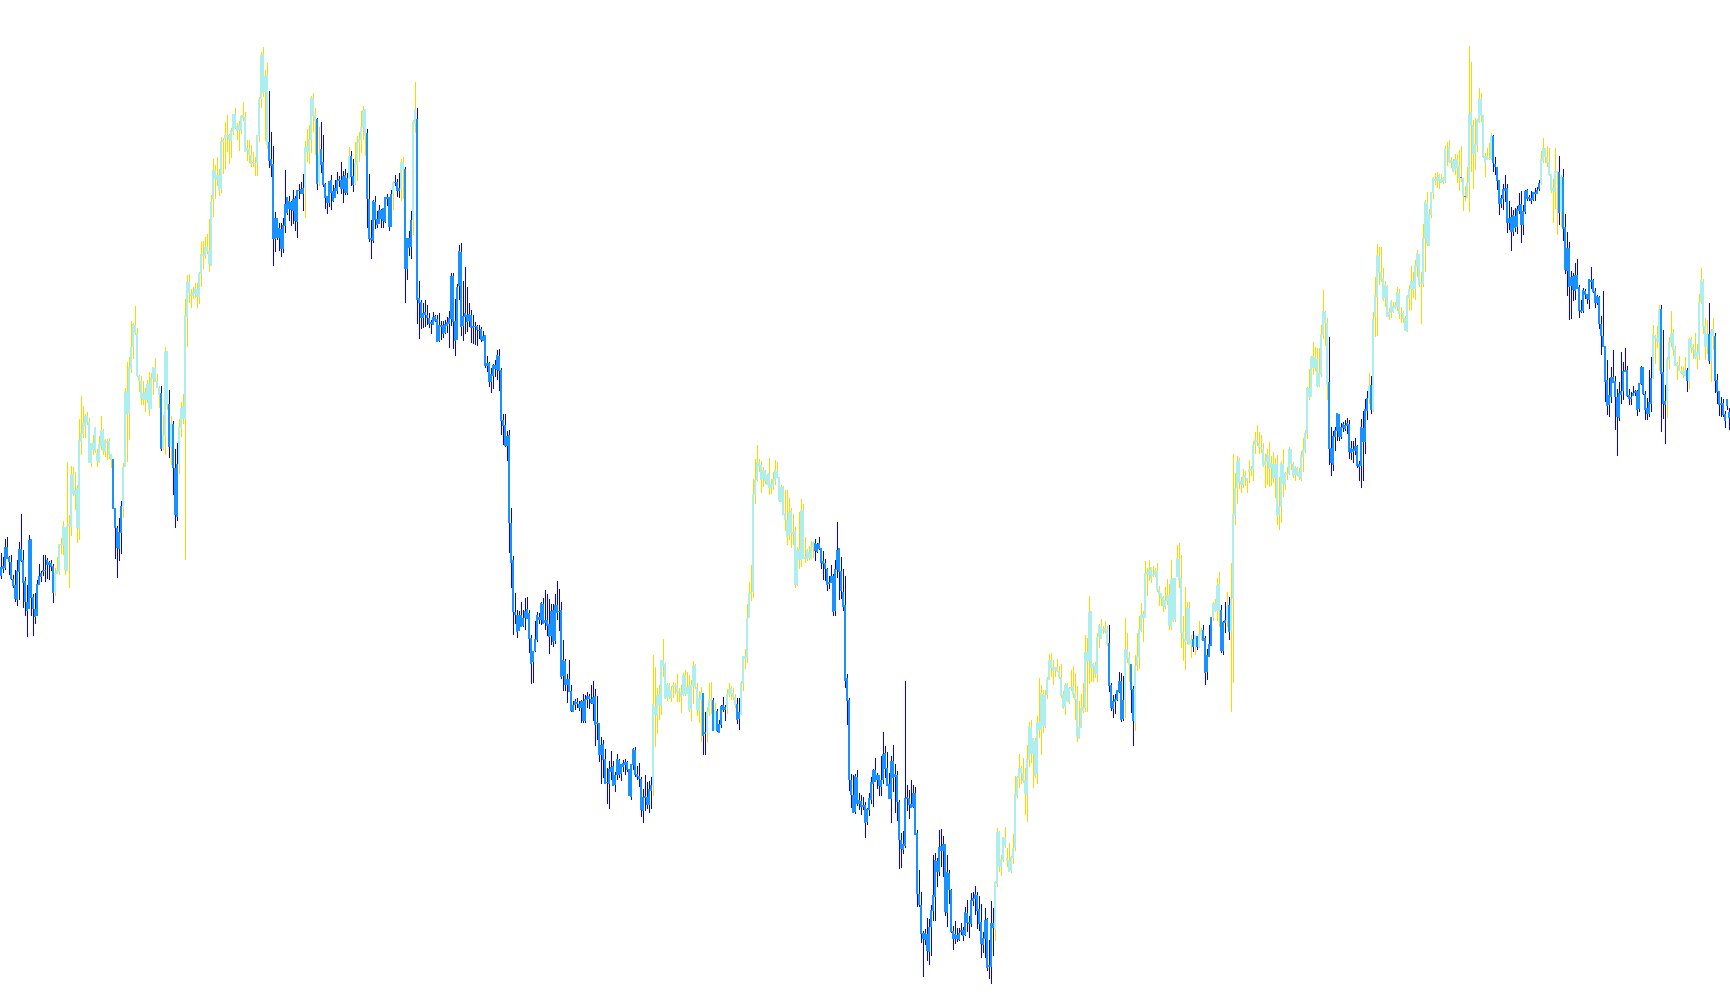
This script is designed to provide a clear visual representation of market momentum by dynamically changing the colors of the price candles on your trading chart. Instead of relying on standard price action alone, it uses a technical relationship between two specific moving averages to determine whether the current market sentiment is bullish or bearish.
How the Logic Works
The tool functions by comparing two different types of mathematical averages:
- A Fast Movement Reference: A very short-term average that reacts almost instantly to price changes.
- The Kijun-Sen (Baseline): A longer-term technical indicator (specifically from the Ichimoku system) that represents the "equilibrium" or the median price over a specific period of time.
Visual Behavior
The script analyzes every candle on your chart and performs a real-time comparison:
- Bullish Sentiment: When the fast movement reference is higher than the Kijun-Sen baseline, the script identifies the market as being in an upward trend. It then highlights the candles in a specific color (Royal Blue) to signal strength.
- Bearish Sentiment: When the fast movement reference drops below the Kijun-Sen baseline, the script identifies a downward trend. It switches the candle colors to Red, alerting you to potential selling pressure.
Key Components of the Visuals
To ensure the data is easy to read, the script differentiates between the two parts of a price candle:
- The Wicks (Shadows): These are rendered with a thinner profile to show the total range of price movement during that period.
- The Bodies: These are rendered as thicker blocks, making it easier for you to see the "meat" of the price action and the actual closing results at a glance.
By automating this color-coding, the tool removes the need to manually calculate where the price sits in relation to the Kijun-Sen baseline, allowing you to see the prevailing trend immediately through a simple visual cue.
//+------------------------------------------------------------------+
//| Kijun_Sen Candles Two Colors: Copylight © 2013, File45 (Phylo)
//| http://codebase.mql4.com/en/author/file45
//|
//| Thanks to Mladen for code enhancements: http://www.forex-tsd.com/metatrader-4/20171-please-fix-indicator-ea-82.html
//+------------------------------------------------------------------+
#property copyright "Copyright 2013, MetaQuotes Software Corp."
#property link      "http://www.mql5.com"
#property version   "2.00"

#property indicator_chart_window

#property indicator_buffers 4
#property indicator_color1 RoyalBlue//wicks
#property indicator_color2 Red//wicks
#property indicator_color3 RoyalBlue // Candle Bodies
#property indicator_color4 Red // Candle Bodies

extern int Candle_Kijun_Sen = 34;
extern int Candle_Shadow_Width = 1, Candle_Body_Width = 3;

int MA1 = 1;
int MA1_SHIFT = 0;
int MA1_MODE = 0;
int MA1_PRICE = 0;

// ======================== indicator buffers
double Bar1[], Bar2[], Candle1[], Candle2[];

//+------------------------------------------------------------------+
//| Custom indicator initialization function |
//+------------------------------------------------------------------+
int init()
{
   ChartSetInteger(0,CHART_MODE,CHART_LINE);
   ChartSetInteger(0,CHART_COLOR_CHART_LINE,clrNONE);

   IndicatorShortName("MA Candles");
   IndicatorBuffers(4);

   SetIndexBuffer(0,Bar1);
   SetIndexBuffer(1,Bar2);
   SetIndexBuffer(2,Candle1);
   SetIndexBuffer(3,Candle2);

   SetIndexStyle(0,DRAW_HISTOGRAM,0,Candle_Shadow_Width);
   SetIndexStyle(1,DRAW_HISTOGRAM,0,Candle_Shadow_Width);
   SetIndexStyle(2,DRAW_HISTOGRAM,0,Candle_Body_Width);
   SetIndexStyle(3,DRAW_HISTOGRAM,0,Candle_Body_Width);

   SetIndexLabel(0, "R up L, R dn L, B up H, B dn H");
   SetIndexLabel(1, "R up H, R dn H, B up L, B dn L");
   SetIndexLabel(2, "R up O, R dn C, B up C, B dn O");
   SetIndexLabel(3, "R up C, R dn O, B up O, B dn C");

   return(0);
}
   double MA_1 (int i = 0){return(iMA(NULL,0,MA1,MA1_SHIFT,MA1_MODE, MA1_PRICE,i));}
   double MA_2 (int i = 0){return(iIchimoku(NULL,0,Candle_Kijun_Sen,Candle_Kijun_Sen,Candle_Kijun_Sen,MODE_KIJUNSEN,i));}

void SetCandleColor(int col, int i)
{
   double high,low,bodyHigh,bodyLow;

   bodyHigh = MathMax(Open[i],Close[i]);
   bodyLow = MathMin(Open[i],Close[i]);
   high	 = High[i];
   low	 = Low[i];

   Bar1[i] = EMPTY_VALUE;
   Bar2[i] = EMPTY_VALUE;
   Candle1[i] = EMPTY_VALUE;
   Candle2[i] = EMPTY_VALUE;

   switch(col)
   {
   case 1: Bar1[i] = high;	Bar2[i] = low; Candle1[i] = bodyHigh;	Candle2[i] = bodyLow; break;
   case 2: Bar2[i] = high;	Bar1[i] = low; Candle2[i] = bodyHigh;	Candle1[i] = bodyLow; break;
   }
}

int start()
{
   for(int i = MathMax(Bars-1-IndicatorCounted(),1); i>=0; i--)
   {
      double	Ma1	= MA_1(i);
      double	Ma2	= MA_2(i);

      if(Ma1 > Ma2)
      {
         SetCandleColor(1,i);
      }
      else
      {
         if(Ma1 < Ma2) SetCandleColor(2,i);
      }
   }

   return(0);
}

int deinit()
{
   return(0);
}
Comments