J-EM 7-21
Download script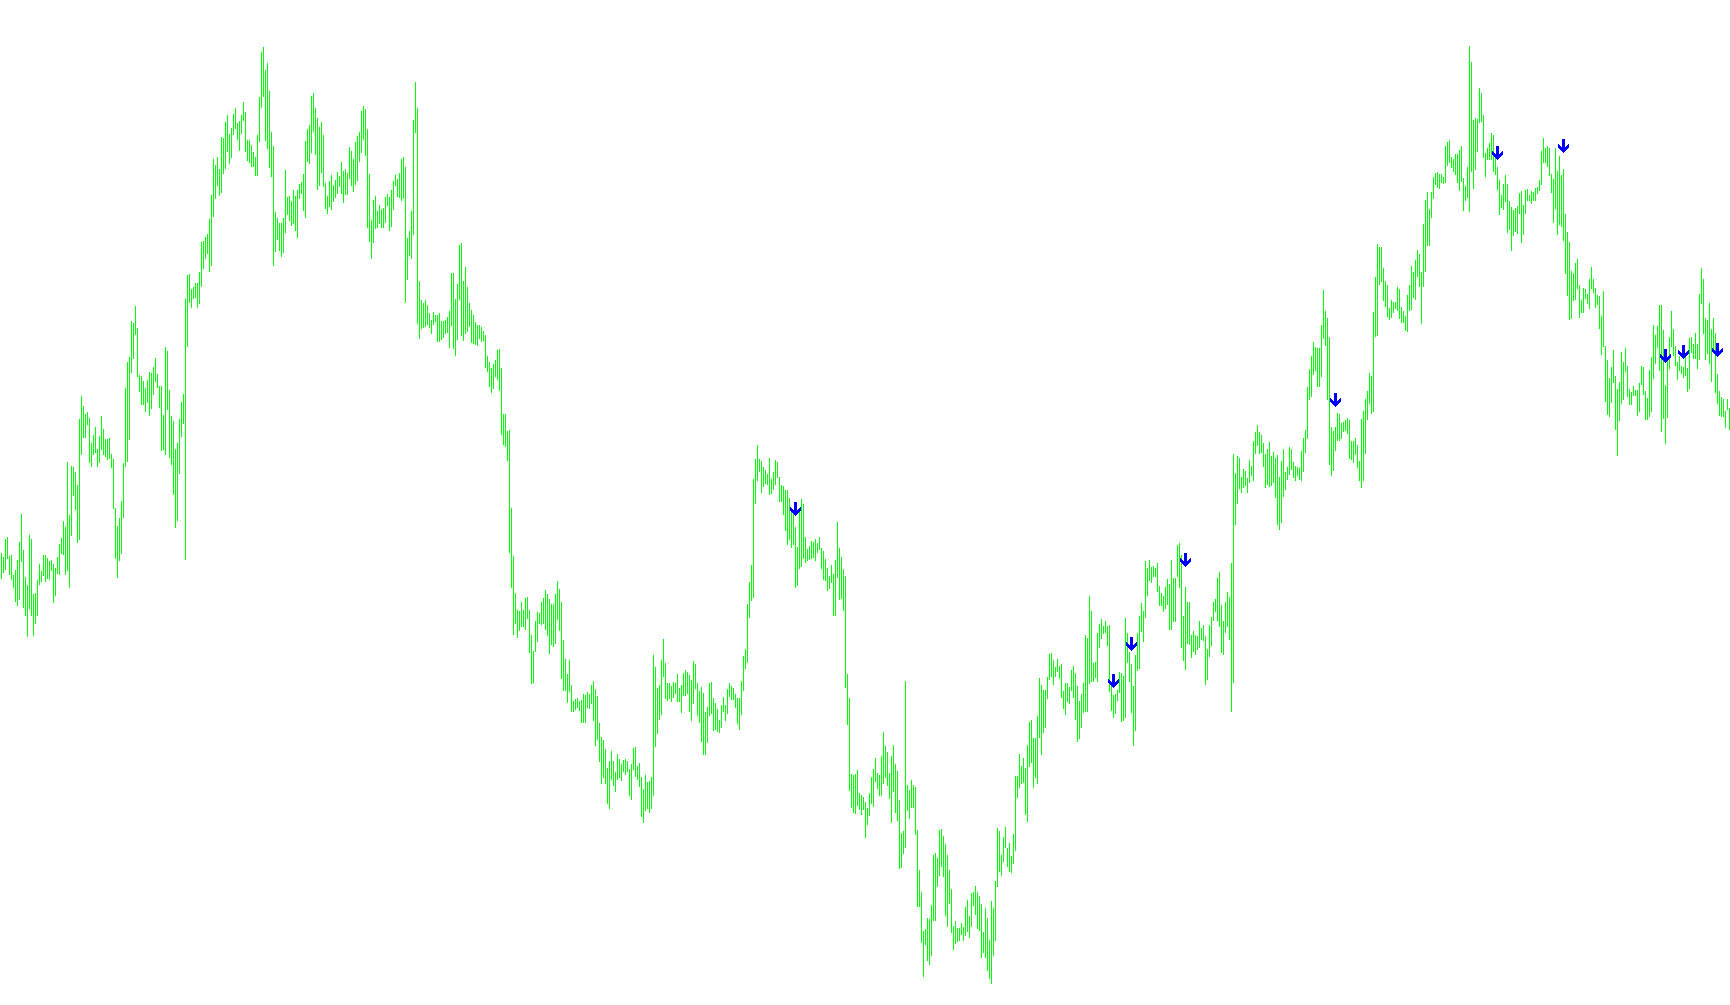
This tool is designed for traders who use Moving Averages to determine market trends and identify potential entry points. It simplifies the process of spotting "crossovers"—the moments when a fast-moving average intersects with a slower one—which often signal a shift in momentum from selling to buying, or vice versa.
How the Logic Works
The script functions by constantly monitoring two specific types of moving averages: a Faster EMA (Exponential Moving Average) and a Slower EMA.
- Trend Tracking: Because the Faster EMA reacts more quickly to recent price changes than the Slower EMA, it serves as a "leading" indicator. When these two lines move in opposite directions relative to each other, it suggests that the market's velocity is changing.
- The Crossover Detection: The script looks for three specific conditions simultaneously to confirm a signal:
- Current State: Is the Faster EMA currently above (for a buy) or below (for a sell) the Slower EMA?
- Previous State: Was the Faster EMA on the opposite side in the previous price candle?
- Future Verification: Does the trend hold true for the subsequent data point?
- Dynamic Positioning: To make these signals easy to see visually, the script doesn't just draw a line at the crossover point. It calculates the "Range" (the distance between the high and low prices) over a 10-bar period. It then places visual markers (arrows) slightly above or below the price candles based on this range. This ensures the signal is clearly visible and not overlapping with the actual price bars.
Visual Summary
- Buy Signals: When the Faster EMA crosses upward over the Slower EMA, a marker appears below the candle.
- Sell Signals: When the Faster EMA crosses downward under the Slower EMA, a marker appears above the candle.
By automating this calculation, the script removes the need for traders to manually watch every price tick, highlighting only the specific moments where the mathematical relationship between these two averages shifts.
Indicators Used
Miscellaneous
13
Views
0
Downloads
0
Favorites
J-EM 7-21
//+------------------------------------------------------------------+
//|                                         EM5-Cross.mq4            |
//|         Copyright © 2005, Harmeet Singh                          |
//|                   grabapip@yahoo.com                             |
//+------------------------------------------------------------------+


#property copyright "Harmeet Singh"
#property link      "grabapip@yahoo.com"

#property indicator_chart_window
#property indicator_buffers 3
#property indicator_color1 Blue
#property indicator_color2 Orange
#property indicator_color3 Red

extern int MA_Period=13;
extern int MA_Shift=0;
extern int MA_Method=0;
extern int AllBars=500;

double ExtMapBuffer[];
double CrossUp[];
double CrossDown[];
extern int FasterEMA = 7;
extern int SlowerEMA = 21;
//+------------------------------------------------------------------+
//| Custom indicator initialization function                         |
//+------------------------------------------------------------------+
int init()
  {
  int    draw_begin;
   string short_name;
//---- drawing settings
   SetIndexStyle(0,DRAW_LINE);
   SetIndexShift(0,MA_Shift);
   IndicatorDigits(MarketInfo(Symbol(),MODE_DIGITS));
   if(MA_Period<2) MA_Period=13;
   draw_begin=MA_Period-1;

//---- indicators
   SetIndexStyle(0, DRAW_ARROW, EMPTY);
   SetIndexArrow(0, 233);
   SetIndexBuffer(0, CrossUp);
   SetIndexStyle(1, DRAW_ARROW, EMPTY);
   SetIndexArrow(1, 234);
   SetIndexBuffer(1, CrossDown);
   //---- indicator short name
   switch(MA_Method)
     {
      case 1 : short_name="EMA(";  draw_begin=0; break;
      case 2 : short_name="SMMA("; break;
      case 3 : short_name="LWMA("; break;
      default :
         MA_Method=0;
         short_name="SMA(";
     }
   IndicatorShortName(short_name+MA_Period+")");
   SetIndexDrawBegin(0,draw_begin);
//---- indicator buffers mapping
   SetIndexBuffer(0,ExtMapBuffer);
//---- initialization done
   return(0);
  }
//+------------------------------------------------------------------+
//| Custom indicator deinitialization function                       |
//+------------------------------------------------------------------+
int deinit()
  {
//----

//----
   return(0);
  }
//+------------------------------------------------------------------+
//| Custom indicator iteration function                              |
//+------------------------------------------------------------------+
int start() {
   int i, counter;

   double fasterEMAnow, slowerEMAnow, fasterEMAprevious, slowerEMAprevious, fasterEMAafter, slowerEMAafter, cu;
   double Range, AvgRange;
   int counted_bars=IndicatorCounted();
//---- check for possible errors
   if(counted_bars<0) return(-1);
//---- last counted bar will be recounted
   if(counted_bars>0) counted_bars--;
   int limit = Bars-counted_bars-1;
   if (limit > AllBars) limit = AllBars;

   for(i=limit; i > 0; i--) {

      counter=i;
      Range=0;
      AvgRange=0;

      for (counter=i ;counter<=i+9;counter++)
      {
         AvgRange=AvgRange+MathAbs(High[counter]-Low[counter]);
      }
      Range=AvgRange/10;

      fasterEMAnow = iMA(NULL, 0, FasterEMA, 0, MODE_EMA, PRICE_CLOSE, i);
      fasterEMAprevious = iMA(NULL, 0, FasterEMA, 0, MODE_EMA, PRICE_CLOSE, i+1);
      fasterEMAafter = iMA(NULL, 0, FasterEMA, 0, MODE_EMA, PRICE_CLOSE, i-1);

      slowerEMAnow = iMA(NULL, 0, SlowerEMA, 0, MODE_EMA, PRICE_CLOSE, i);
      slowerEMAprevious = iMA(NULL, 0, SlowerEMA, 0, MODE_EMA, PRICE_CLOSE, i+1);
      slowerEMAafter = iMA(NULL, 0, SlowerEMA, 0, MODE_EMA, PRICE_CLOSE, i-1);

      if ((fasterEMAnow > slowerEMAnow) && (fasterEMAprevious < slowerEMAprevious) && (fasterEMAafter > slowerEMAafter)) {
         CrossUp[i] = Low[i] - Range*0.5;
//       if(limit<=2)
//            {
//            Alert (Symbol()," ",Period(),"-Min. BUY Crossed Up at ",  CrossUp[i]);
//            }

      }
      else if ((fasterEMAnow < slowerEMAnow) && (fasterEMAprevious > slowerEMAprevious) && (fasterEMAafter < slowerEMAafter)) {
         CrossDown[i] = High[i] + Range*0.5;

//        if(limit<=2)
//           {
//          Alert (Symbol()," ",Period(),"-Min. SELL Crossed Down at ",  CrossDown[i]);
//         }

      }
   }
   return(0);
}
Comments