ipivot
Download script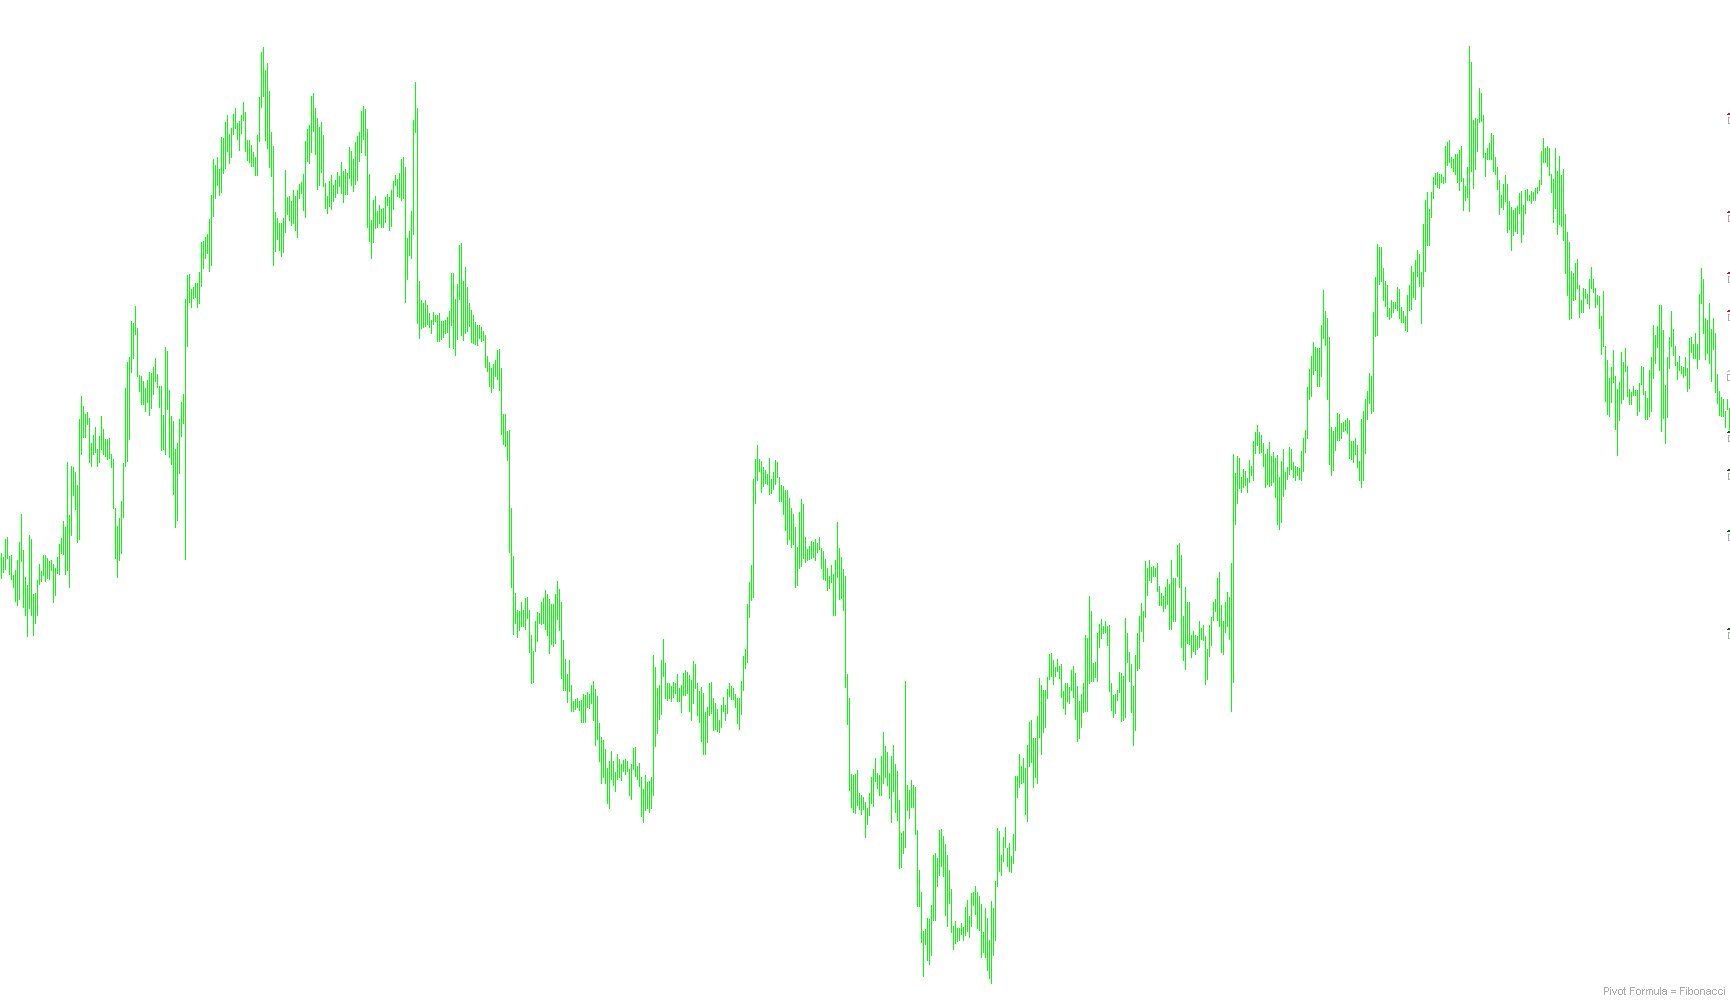
This script is designed to automatically calculate and display key "Pivot Points" on your trading chart. Pivot points are essential technical analysis tools used by traders to identify potential support and resistance levels—areas where the price of an asset might stall, reverse, or break out.
Core Functionality
The tool analyzes the previous day's price data (specifically the high, low, open, and close prices) to project a series of horizontal lines onto your current chart. These lines represent key price levels for the current trading session:
- The Pivot Point: The central equilibrium level for the day.
- Resistance Levels (R1 - R4): Projected "ceilings" where upward price movement might face selling pressure.
- Support Levels (S1 - S4): Projected "floors" where downward price movement might find buying interest.
Customizable Calculation Methods
One of the primary features of this script is its versatility. It allows you to switch between five different industry-standard mathematical formulas to determine where these levels are placed:
- Standard: The classic method used by most traditional traders.
- Fibonacci: Uses the golden ratio to determine levels, popular among technical analysts.
- Camarilla: A specialized formula often used by day traders for identifying intraday turning points.
- Woodie: A variation that places more weight on the closing price of the previous period.
- DeMark: A calculation that adjusts based on whether the market closed higher or lower than it opened.
Visuals and User Interface
The script is designed to be highly customizable to fit your personal trading style:
- Visual Styling: You can change the colors, thickness, and line styles of both the Pivot Point and the various Support/Resistance lines.
- Labels: The script automatically places text labels next to the lines (e.g., "Resistance 1") so you can easily identify each level at a glance.
- On-Screen Info: It displays a small text note on your chart identifying which specific formula is currently being used for the calculations.
Intelligent Alerts
To help you stay updated without constantly watching the screen, the script includes a notification system. If the current market price touches any of the calculated Pivot, Support, or Resistance lines, the tool can be configured to notify you in three different ways:
- Pop-up Alerts: Visual notifications on your trading platform.
- Email Notifications: Sending an alert directly to your registered email address.
- Audio Alerts: Playing a specific sound file when a price level is hit.
The script includes logic to ensure you only receive one notification per bar, preventing your workspace from being overwhelmed by repeated alerts during a single price movement.
//+------------------------------------------------------------------+
//| iPivot.mq4 |
//| Copyright © 2015, Awran5. |
//| awran5@yahoo.com |
//+------------------------------------------------------------------+
#property copyright "Copyright © 2015, Awran5."
#property link "awran5@yahoo.com"
#property version "1.00"
#property description "Draw Pivot Point with 4 Support and Resistance lines based on most popular Formulas:\n"
#property description "- Standard, \n- Fibonacci, \n- Camarilla, \n- Woodys, \n- DeMark"
#property strict
#property indicator_chart_window
#property indicator_buffers 9
//+------------------------------------------------------------------+
//| |
//+------------------------------------------------------------------+
enum Pivot
{
Standard, // Standard
Fibonacci, // Fibonacci
Camarilla, // Camarilla
Woodie, // Woodie
DeMark // DeMark
};
//|--------------------------------------------------------------------------------------------------------------------|
//| E X T E R N A L V A R I A B L E S |
//|--------------------------------------------------------------------------------------------------------------------|
input Pivot PivotMethod = Fibonacci; // Pivot Forumlas
input bool ShowPivot = true; // Show Pivot
input color pColor = clrSilver; // Pivot Color
input int pWidth = 2; // Pivot Width
input ENUM_LINE_STYLE pStyle = 0; // Pivot style
input string lb_0 = ""; // --------------------------------------------------------------
input bool Show_SR = true; // Show S/R
input color rColor = clrFireBrick; // Resistance Color
input ENUM_LINE_STYLE rStyle = 0; // Resistance style
input int rWidth = 2; // Resistance Width
input color sColor = clrDarkGreen; // Support Color
input ENUM_LINE_STYLE sStyle = 0; // Support style
input int sWidth = 2; // Support Width
input color lColor = clrDarkGray; // Text color
input bool UseAlert = true; // Enable Alert
input bool UseEmail = false; // Enable Email
input bool UseSound = false; // Enable Sound
input string SoundName = "alert2.wav"; // Sound Name
//|--------------------------------------------------------------------------------------------------------------------|
//| I N T E R N A L V A R I A B L E S |
//|--------------------------------------------------------------------------------------------------------------------|
double P,R1,R2,R3,R4,S1,S2,S3,S4,
PBuffer[],S1Buffer[],S2Buffer[],S3Buffer[],S4Buffer[],
R1Buffer[],R2Buffer[],R3Buffer[],R4Buffer[],
//---
DayHigh,DayLow,DayClose,DayOpen,Range;
//---
string names[9]={"Daily Pivot","Resistance 1","Resistance 2","Resistance 3","Resistance 4","Support 1","Support 2","Support 3","Support 4"},
labels[9]={"DPV","DR1","DR2","DR3","DR4","DS1","DS2","DS3","DS4"},
space=" ",formula;
//---
int MaxBars=500;
//+------------------------------------------------------------------+
//| Custom indicator initialization function |
//+------------------------------------------------------------------+
int OnInit()
{
//--- indicator buffers mapping
SetIndexBuffer(0,PBuffer);
SetIndexBuffer(1,R1Buffer);
SetIndexBuffer(2,R2Buffer);
SetIndexBuffer(3,R3Buffer);
SetIndexBuffer(4,R4Buffer);
SetIndexBuffer(5,S1Buffer);
SetIndexBuffer(6,S2Buffer);
SetIndexBuffer(7,S3Buffer);
SetIndexBuffer(8,S4Buffer);
// Set styles
SetIndexStyle(0,12,pStyle,pWidth,pColor);
SetIndexStyle(1,12,rStyle,rWidth,rColor);
SetIndexStyle(2,12,rStyle,rWidth,rColor);
SetIndexStyle(3,12,rStyle,rWidth,rColor);
SetIndexStyle(4,12,rStyle,rWidth,rColor);
SetIndexStyle(5,12,sStyle,sWidth,sColor);
SetIndexStyle(6,12,sStyle,sWidth,sColor);
SetIndexStyle(7,12,sStyle,sWidth,sColor);
SetIndexStyle(8,12,sStyle,sWidth,sColor);
// Set labels
SetIndexLabel(0,"Pivot");
SetIndexLabel(1,"Resistance 1");
SetIndexLabel(2,"Resistance 2");
SetIndexLabel(3,"Resistance 3");
SetIndexLabel(4,"Resistance 4");
SetIndexLabel(5,"Support 1");
SetIndexLabel(6,"Support 2");
SetIndexLabel(7,"Support 3");
SetIndexLabel(8,"Support 4");
// Set Empty valus
SetIndexEmptyValue (0, 0.0);
SetIndexEmptyValue (1, 0.0);
SetIndexEmptyValue (2, 0.0);
SetIndexEmptyValue (3, 0.0);
SetIndexEmptyValue (4, 0.0);
SetIndexEmptyValue (5, 0.0);
SetIndexEmptyValue (6, 0.0);
SetIndexEmptyValue (7, 0.0);
SetIndexEmptyValue (8, 0.0);
//---- indicator short name
IndicatorShortName("iPivot");
//---- force daily data load
iBars(NULL,PERIOD_D1);
//---
return(INIT_SUCCEEDED);
}
//+------------------------------------------------------------------+
//| deinitialization function |
//+------------------------------------------------------------------+
void OnDeinit(const int reason)
{
//---
for(int i=0; i<9; i++)
{
if(ObjectFind(0,names[i]) >=0) ObjectDelete(names[i]);
if(ObjectFind(0,space+labels[i]) >=0) ObjectDelete(space+labels[i]);
}
if(ObjectFind(0,"com")>=0) ObjectDelete("com");
Comment("");
//---
}
//+------------------------------------------------------------------+
//| Custom indicator iteration function |
//+------------------------------------------------------------------+
int OnCalculate (const int rates_total, // size of input time series
const int prev_calculated, // bars handled in previous call
const datetime& time[], // Time
const double& open[], // Open
const double& high[], // High
const double& low[], // Low
const double& close[], // Close
const long& tick_volume[], // Tick Volume
const long& volume[], // Real Volume
const int& spread[]) // Spread
{
//---
if(Period() >= PERIOD_D1) return(rates_total);
int limit,counted_bars=prev_calculated;
if(counted_bars < 0) return(rates_total);
if(counted_bars>0) counted_bars--;
limit=rates_total-counted_bars;
if(limit>MaxBars) limit=MaxBars;
for(int i=limit -1; i>=0; i--)
{
int iYesterday=i+1;
datetime yesterday=iTime(NULL,PERIOD_D1,iYesterday);
if(TimeDayOfWeek(yesterday)==0) iYesterday++; // Data from Friday not Sunday
DayHigh = iHigh (NULL, PERIOD_D1, iYesterday);
DayLow = iLow (NULL, PERIOD_D1, iYesterday);
DayOpen = iOpen (NULL, PERIOD_D1, iYesterday);
DayClose = iClose(NULL, PERIOD_D1, iYesterday);
Range=(DayHigh-DayLow);
if(PivotMethod==Standard)
{
P=(DayHigh+DayLow+DayClose)/3;
R1 = P * 2 - DayLow;
R2 = P + Range;
R3 = P * 2 + DayHigh - (DayLow * 2);
//---
S1 = P * 2 - DayHigh;
S2 = P - Range;
S3 = P * 2 - (DayHigh * 2 - DayLow);
//---
formula="Standard";
}
else if(PivotMethod==Fibonacci)
{
P=(DayHigh+DayLow+DayClose)/3;
R1 = P + Range * 0.382;
R2 = P + Range * 0.618;
R3 = P + Range * 1.000;
R4 = P + Range * 1.618;
//---
S1 = P - Range * 0.382;
S2 = P - Range * 0.618;
S3 = P - Range * 1.000;
S4 = P - Range * 1.618;
//---
formula="Fibonacci";
}
else if(PivotMethod==Camarilla)
{
//P = (DayHigh + DayLow + DayClose) / 3;
R1 = DayClose + Range * 1.1/12;
R2 = DayClose + Range * 1.1/6;
R3 = DayClose + Range * 1.1/4;
R4 = DayClose + Range * 1.1/2;
//---
S1 = DayClose - Range * 1.1/12;
S2 = DayClose - Range * 1.1/6;
S3 = DayClose - Range * 1.1/4;
S4 = DayClose - Range * 1.1/2;
P=(R1+S1)/2;
//---
formula="Camarilla";
}
else if(PivotMethod==Woodie)
{
P=(DayHigh+DayLow+2*DayClose)/4;
R1 = (2 * P) - DayLow;
R2 = P + Range;
R3 = DayHigh + 2 * (P - DayLow);
R4 = R3 + Range;
//---
S1 = (2 * P) - DayHigh;
S2 = P - Range;
S3 = DayLow - 2 * (DayHigh - P);
S4 = S3 - Range;
//---
formula="Woodie";
}
else if(PivotMethod==DeMark)
{
double x=0.0;
if(Close[i] < Open[i]) x = DayHigh + (DayLow * 2) + DayClose;
if(Close[i] > Open[i]) x = (DayHigh * 2) + DayLow + DayClose;
if(Close[i]==Open[i]) x=DayHigh+DayLow+(DayClose*2);
P=x/4;
R1 = (x/2) - DayLow;
S1 = (x/2) - DayHigh;
//---
formula="DeMark";
}
//---- Buffers
PBuffer[i] = P;
R1Buffer[i] = R1;
R2Buffer[i] = R2;
R3Buffer[i] = R3;
R4Buffer[i] = R4;
S1Buffer[i] = S1;
S2Buffer[i] = S2;
S3Buffer[i] = S3;
S4Buffer[i] = S4;
}
//--- Draw Line
if(ShowPivot) { DrawLines(names[0],space+labels[0],pStyle,pWidth,pColor,P); }
if(Show_SR)
{
DrawLines(names[1],space+labels[1],rStyle,rWidth,rColor,R1);
DrawLines(names[2],space+labels[2],rStyle,rWidth,rColor,R2);
DrawLines(names[3],space+labels[3],rStyle,rWidth,rColor,R3);
DrawLines(names[4],space+labels[4],rStyle,rWidth,rColor,R4);
//---
DrawLines(names[5],space+labels[5],sStyle,sWidth,sColor,S1);
DrawLines(names[6],space+labels[6],sStyle,sWidth,sColor,S2);
DrawLines(names[7],space+labels[7],sStyle,sWidth,sColor,S3);
DrawLines(names[8],space+labels[8],sStyle,sWidth,sColor,S4);
}
//--- Show comment
ObjectDelete("com");
ObjectCreate("com",OBJ_LABEL,0,0,0);
ObjectSetText("com","Pivot Formula = "+formula,8,"Arial",clrDarkGray);
ObjectSet("com",OBJPROP_CORNER,3);
ObjectSet("com",OBJPROP_XDISTANCE,10);
ObjectSet("com",OBJPROP_YDISTANCE,10);
//--- Alert
Notifications();
//--- return value of prev_calculated for next call
return(rates_total);
}
//|--------------------------------------------------------------------------------------------------------------------|
//| I N T E R N A L F U N C T I O N S |
//|--------------------------------------------------------------------------------------------------------------------|
//+------------------------------------------------------------------+
//| Draw lines
//+------------------------------------------------------------------+
void DrawLines(string name,string label,int style,int width,color clr,double price)
{
//---
datetime startline = iTime(NULL, 1440, 0)/* + 3600*/;
datetime stopline = iTime(NULL, 240, 0) + 43200;
ObjectDelete(name);
ObjectCreate(name,OBJ_TREND,0,startline,price,stopline,price);
ObjectSet(name,OBJPROP_COLOR,clr);
ObjectSet(name,OBJPROP_STYLE,style);
ObjectSet(name,OBJPROP_WIDTH,width);
ObjectSet(name,OBJPROP_RAY,false);
if(ObjectFind(label)!=0)
{
ObjectDelete(label);
ObjectCreate(label,OBJ_TEXT,0,startline,price,stopline,price);
ObjectSetText(label,label,7,"Verdana",lColor);
}
else
{
ObjectMove(label,0,startline,price);
}
//---
}
//+------------------------------------------------------------------+
//| Notifications function
//+------------------------------------------------------------------+
void Notifications()
{
//----
if(Low[0]<P && High[0]>P)
doAlert("Pivot Tocuh! - Price has tocuhed the Pivot line @ "+Symbol()+" @ "+PeriodToStr(Period())+" time frame");
if(Low[0]<R1 && High[0]>R1)
doAlert("R1 Tocuh! - Price has tocuhed the Resistance 1 line @ "+Symbol()+" @ "+PeriodToStr(Period())+" time frame");
if(Low[0]<R2 && High[0]>R2)
doAlert("R2 Tocuh! - Price has tocuhed the Resistance 2 line @ "+Symbol()+" @ "+PeriodToStr(Period())+" time frame");
if(Low[0]<R3 && High[0]>R3)
doAlert("R3 Tocuh! - Price has tocuhed the Resistance 3 line @ "+Symbol()+" @ "+PeriodToStr(Period())+" time frame");
if(Low[0]<R4 && High[0]>R4)
doAlert("R4 Tocuh! - Price has tocuhed the Resistance 4 line @ "+Symbol()+" @ "+PeriodToStr(Period())+" time frame");
//-------------------------------------------------------------------------------------------------------------------------------
if(Low[0]<S1 && High[0]>S1)
doAlert("S1 Tocuh! - Price has tocuhed the Support 1 line @ "+Symbol()+" @ "+PeriodToStr(Period())+" time frame");
if(Low[0]<S2 && High[0]>S2)
doAlert("S2 Tocuh! - Price has tocuhed the Support 2 line @ "+Symbol()+" @ "+PeriodToStr(Period())+" time frame");
if(Low[0]<S3 && High[0]>S3)
doAlert("S3 Tocuh! - Price has tocuhed the Support 3 line @ "+Symbol()+" @ "+PeriodToStr(Period())+" time frame");
if(Low[0]<S4 && High[0]>S4)
doAlert("S4 Tocuh! - Price has tocuhed the Support 4 line @ "+Symbol()+" @ "+PeriodToStr(Period())+" time frame");
//----
}
//+------------------------------------------------------------------+
//| Alert function
//+------------------------------------------------------------------+
void doAlert(string message)
{
//----
// See if this bar is new and conditions are met
static datetime BarStart=0;
if(Time[0]!=BarStart)
{
if(UseAlert) Alert(message);
if(UseEmail) SendMail("iPivot Notification!",message);
if(UseSound) PlaySound(SoundName);
// Store the time of the current bar, preventing further action during this bar
BarStart=Time[0];
}
//----
}
//+------------------------------------------------------------------+
//| Period To String - Credit to the author
//+------------------------------------------------------------------+
string PeriodToStr(int period)
{
//---
if(period == NULL) return(PeriodToStr(Period()));
int p[9]={1,5,15,30,60,240,1440,10080,43200};
string sp[9]={"M1","M5","M15","M30","H1","H4","D1","W1","MN1"};
for(int i= 0; i < 9; i++) if(p[i] == period) return(sp[i]);
return("--");
//---
}
//+------------------------------------------------------------------+
Comments