VininI_RSI_FO_2m
Download script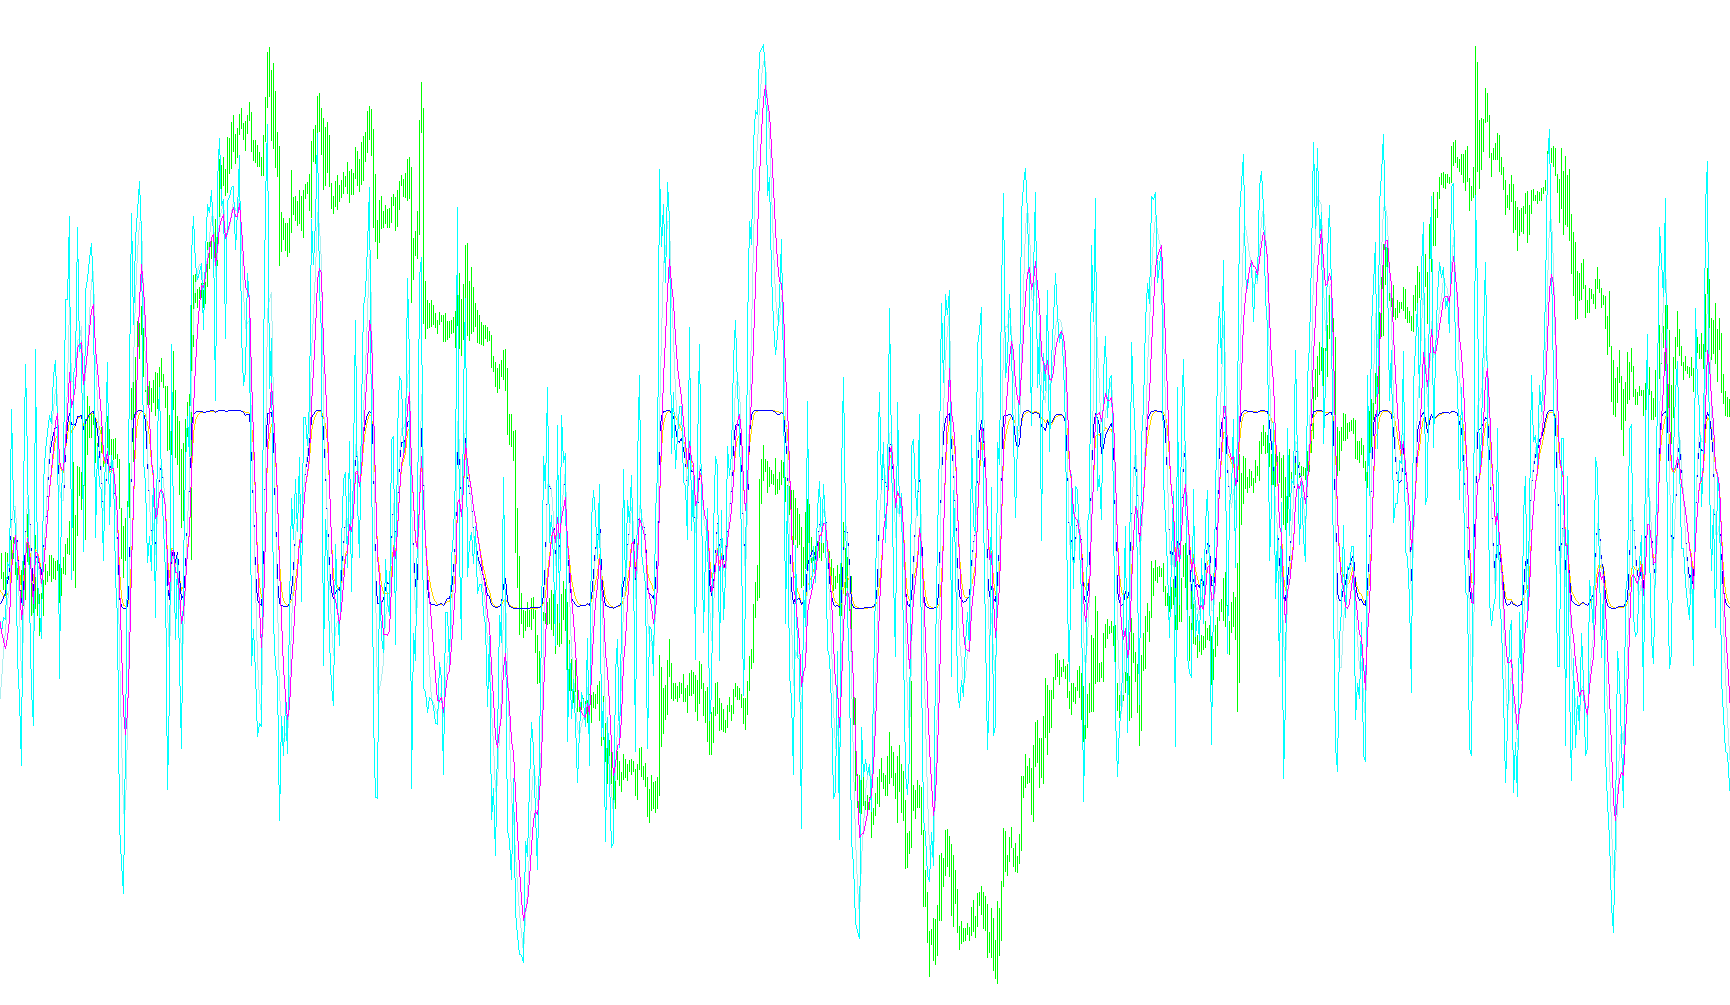
This technical indicator is designed to provide traders with a dual-perspective visual analysis of market momentum by comparing two different financial instruments simultaneously. Instead of looking at price action alone, it focuses on the "strength" of the movement relative to a central equilibrium point.
Core Functionality
The script performs three main layers of mathematical processing to transform raw market data into a readable format:
1. Relative Strength Normalization The tool starts by pulling the Relative Strength Index (RSI) for two different currency pairs or assets. It takes these standard RSI values and shifts them so that a neutral market sits at zero. This allows the user to see "overbought" and "oversold" conditions as positive and negative deviations from a central baseline.
2. Moving Average Smoothing To filter out the "noise" of minor price fluctuations, the script applies a Moving Average to those RSI values. This creates a smoother trend line, helping traders identify the underlying direction of the momentum rather than reacting to every small tick in price.
3. Sigmoid Transformation (The "Fish" Logic) The most unique part of this script is the final calculation, which uses a mathematical formula to compress the smoothed data into a specific curve. This creates a specialized visual representation where the trends are rounded and bounded. This helps in identifying clear momentum shifts and provides a distinct visual cue for when one asset is gaining strength over another.
Key Features for the Trader
- Dual-Pair Comparison: The script allows you to monitor two different pairs at once (e.g., comparing EURUSD against GBPUSD) on a single window. This is ideal for identifying correlations or divergences between different markets.
- Customizable Sensitivity: You can adjust the periods for both the RSI and the Moving Averages, allowing you to switch between a fast, aggressive view of the market or a slower, more conservative trend analysis.
- Visual Boundaries: The indicator is designed to operate within a specific range (roughly -1.05 to 1.05), making it easy to spot when the market is reaching extreme momentum levels that might signal a potential reversal.
By combining these three steps—normalization, smoothing, and curved transformation—the tool provides a refined visual of market "energy," helping you see where price momentum is heading more clearly than a standard chart might show.
//+------------------------------------------------------------------+
//|                                              VininI_RSI_FO_2.mq4 |
//+------------------------------------------------------------------+
//|                                                     VininI_Cyber |
//|                                Copyright © 2009, Victor Nicolaev |
//|                                            e-mail: vinin@mail.ru |
//+------------------------------------------------------------------+
#property copyright "Copyright © 2008, Victor Nicolaev"
#property link      "e-mail: vinin@mail.ru"

#property indicator_separate_window
#property indicator_buffers 2

#property indicator_color1 Blue
#property indicator_color2 LimeGreen
#property indicator_color3 Red
#property indicator_color4 Blue
#property indicator_color5 LimeGreen
#property indicator_color6 Red
#property indicator_level1  -0.5
#property indicator_level2   0
#property indicator_level3   0.5
#property indicator_minimum -1.05
#property indicator_maximum  1.05

//---- input parameters

extern int  RSI_Period  =5;
extern int  RSI_Period1 =5;
extern int  RSI_Price =0;
extern int  MA_Period1 =5;
extern int  MA_Period2 =9;
extern int  MA_Method =3;
extern string  pair1 ;
extern string  pair2 ;

//---- buffers

double Value[],MA[],iFish[],Value1[],MA1[],iFish1[];


//+------------------------------------------------------------------+
//| Custom indicator initialization function |
//+------------------------------------------------------------------+
int init() {
    IndicatorBuffers(8);
    SetIndexStyle(0,DRAW_LINE);
   SetIndexBuffer(0, iFish1);
   SetIndexBuffer(3, Value);
   SetIndexBuffer(2, MA);
     SetIndexStyle(1,DRAW_LINE);
   SetIndexBuffer(1, iFish);
   SetIndexBuffer(4, Value1);
   SetIndexBuffer(5, MA1);


IndicatorShortName("Vinin RSI FO "+pair1+","+pair2+" ; rsi "+RSI_Period+" , "+RSI_Period1+" ");
   return(0);
}

int deinit() { return(0); }


//+------------------------------------------------------------------+
//| Custom indicator iteration function |
//+------------------------------------------------------------------+
int start() {
   int counted_bars = IndicatorCounted(),ii, i;

   if (counted_bars < 0) return(-1);
   if (counted_bars > 0) counted_bars--;

   int limit=Bars - counted_bars;
   for(i = limit; i >= 0; i--)    Value[i]=0.1*(iRSI(pair1,0,RSI_Period,RSI_Price,i)-50.0);
   for(i = limit; i >= 0; i--)    MA[i]=iMAOnArray(Value,0,MA_Period1,0,MA_Method,i);
   for(i = limit; i >= 0; i--)    iFish[i]=(MathExp(2.0*MA[i])-1.0)/(MathExp(2.0*MA[i])+1.0);
  for(i = limit; i >= 0; i--)    Value1[i]=0.1*(iRSI(pair2,0,RSI_Period,RSI_Price,i)-50.0);
   for(i = limit; i >= 0; i--)    MA1[i]=iMAOnArray(Value1,0,MA_Period2,0,MA_Method,i);
   for(i = limit; i >= 0; i--)    iFish1[i]=(MathExp(2.0*MA1[i])-1.0)/(MathExp(2.0*MA1[i])+1.0);

   return(0);
}
//+------------------------------------------------------------------+
Comments