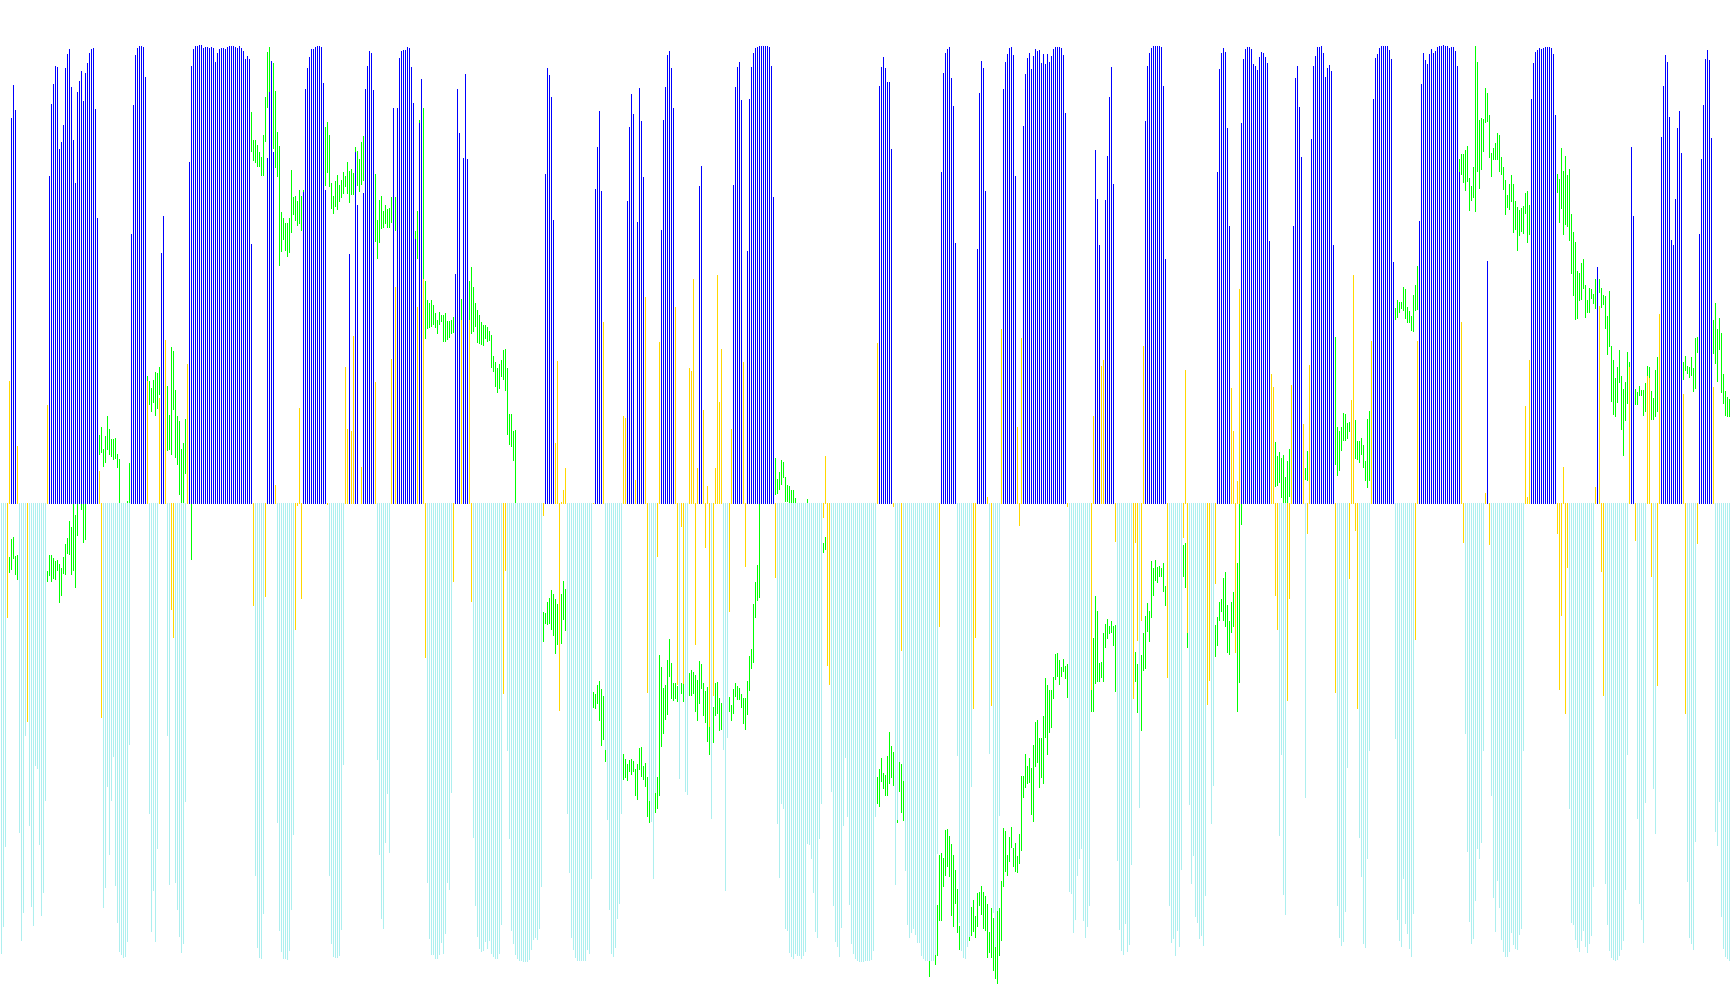
This tool is designed to serve as a visual momentum and trend indicator for trading charts. It works by analyzing price fluctuations and converting that raw data into a readable histogram that helps identify whether the current market move is strengthening or weakening.
Core Logic and Functionality
The script operates through a multi-layered calculation process to filter out market "noise" and provide clearer signals:
1. Data Foundation (The Raw Input) The indicator begins by looking at the price action over a specific timeframe (defined by the "WPR Period"). It focuses on the relative position of the current price compared to its recent high and low points. This identifies the immediate "heartbeat" of the market.
2. Smoothing (The Trend Filter) To prevent the indicator from reacting too erratically to tiny, insignificant price flickers, the script applies a Moving Average to the initial data. Think of this as a smoothing lens; it blurs out the jagged edges of volatile price movements, allowing the user to see the underlying trend more clearly.
3. Mathematical Transformation (The Signal Generator) The script then performs a specific mathematical conversion on that smoothed data. This step translates the trend into a value between -1 and 1. This transformation is intended to highlight the intensity of the movement, making it easier to distinguish between a sluggish crawl and a powerful surge in either direction.
4. Visual Output (The Histogram) Finally, the logic categorizes the results into three distinct visual types on your screen:
- Buy Signals: When the momentum exceeds a specific positive threshold, the indicator generates a visual bar to highlight upward strength.
- Sell Signals: When the momentum drops below a specific negative threshold, it generates a bar highlighting downward pressure.
- Neutral Zone: If the movement is between these two thresholds, the indicator remains quiet, suggesting a period of consolidation or indecision.
Summary for the User
Essentially, this tool takes raw price data, smooths out the "jitter," and converts it into a color-coded visual map. It tells you at a glance whether the market is leaning significantly toward a "Buy" or "Sell" sentiment based on the strength of recent momentum, while staying neutral when the trend isn't strong enough to act upon.
//+------------------------------------------------------------------+
//|                                                     VininI_Cyber |
//|                                Copyright © 2009, Victor Nicolaev |
//|                                            e-mail: vinin@mail.ru |
//+------------------------------------------------------------------+
//mod histo
#property copyright "Copyright © 2008, Victor Nicolaev"
#property link      "e-mail: vinin@mail.ru"

#property indicator_separate_window
#property indicator_buffers 3
#property indicator_color1 RoyalBlue
#property indicator_color2 LimeGreen
#property indicator_color3 Red
#property indicator_level1  -0.5
#property indicator_level2   0.5
#property indicator_levelcolor SlateGray

#property indicator_minimum -1.05
#property indicator_maximum  1.05

//---- input parameters

extern int  WPR_Period=5;
extern int  WPR_Price =0;
extern int  MA_Period =9;
extern int  MA_Method =3;
//---- buffers

double Value[];
double MA[];
double iFish[];
double Buy[];
double Sell[];


//+------------------------------------------------------------------+
//| Custom indicator initialization function |
//+------------------------------------------------------------------+
int init() {
   IndicatorBuffers(5);
   SetIndexBuffer(0, iFish);
   SetIndexStyle(0,DRAW_HISTOGRAM);
   SetIndexBuffer(1, Buy);
   SetIndexStyle(1,DRAW_HISTOGRAM);
   SetIndexBuffer(2, Sell);
   SetIndexStyle(2,DRAW_HISTOGRAM);

   SetIndexBuffer(3, Value);
   SetIndexBuffer(4, MA);


   return(0);
}

int deinit() { return(0); }


//+------------------------------------------------------------------+
//| Custom indicator iteration function |
//+------------------------------------------------------------------+
int start() {
   int counted_bars = IndicatorCounted(), i;

   if (counted_bars < 0) return(-1);
   if (counted_bars > 0) counted_bars--;

   int limit=Bars - counted_bars;
   for(i = limit; i >= 0; i--)    Value[i]=0.1*(iWPR(NULL,0,WPR_Period,i)+50.0);
   for(i = limit; i >= 0; i--)    MA[i]=iMAOnArray(Value,0,MA_Period,0,MA_Method,i);
   for(i = limit; i >= 0; i--)    {
      iFish[i]=(MathExp(2.0*MA[i])-1.0)/(MathExp(2.0*MA[i])+1.0);
                          Sell[i]=0.0;       Buy[i]=0.0;
      if (iFish[i]> 0.5) {Buy[i] =iFish[i];  Sell[i]=0.0;}
      if (iFish[i]<-0.5) {Sell[i]=iFish[i];  Buy[i] =0.0;}
                                   }
   return(0);
}
//+------------------------------------------------------------------+
Comments