VKW_Bands_-_IBS
Download script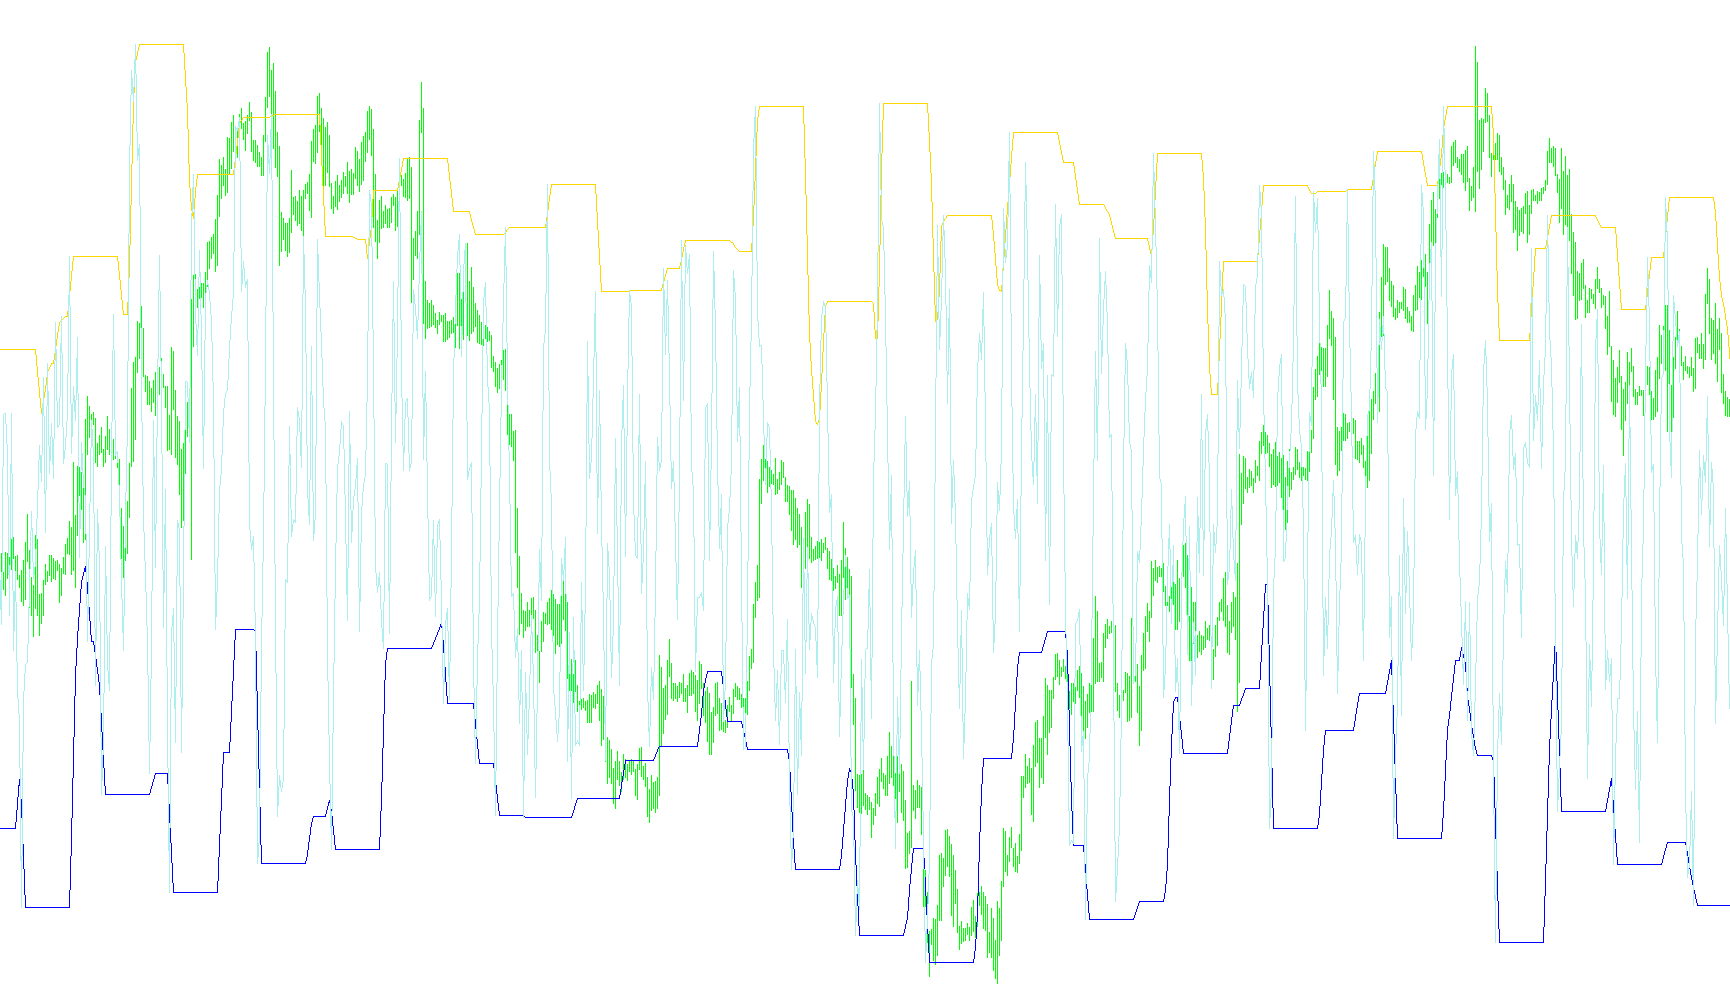
The VKW Bands indicator is a technical analysis tool designed to provide traders with a visual representation of market extremes and price momentum. Rather than looking at raw price action alone, this script processes data through several layers of calculation to identify "envelopes" or boundaries that can help define overbought or oversold conditions.
How the Logic Works
The indicator functions by performing a multi-step calculation on market data:
1. Data Source Integration The logic begins by pulling data from an underlying source (an external indicator referred to as "IBS"). This provides the raw foundation upon which all subsequent calculations are built, essentially acting as the "signal" that the bands will react to.
2. Identifying Extremes (Highs and Lows) Once the base data is captured, the script scans a specific look-back window (the "Range Period"). Within this window, it identifies two critical values:
- The highest value reached during that period.
- The lowest value reached during that period.
By constantly looking for these maximums and minimums, the indicator establishes the current upper and lower boundaries of the market's behavior.
3. Smoothing the Boundaries Raw highs and lows can often be "noisy" or erratic, jumping significantly from one candle to the next. To make the data more readable and usable for trend analysis, the script applies a smoothing process (a Moving Average). This rounds out the sharp edges of the extremes, creating fluid lines that represent the general "ceiling" and "floor" of price movement.
Summary of Visual Output
The final result is a set of bands displayed in a separate window from the main price chart.
- Upper Band: Represents a smoothed average of the highest points over the specified range, showing where price might be reaching an upper limit.
- Lower Band: Represents a smoothed average of the lowest points over the specified range, showing where price might be hitting a lower floor.
For a trader, these bands serve as a visual guide to help identify when the market is stretching toward its limits, potentially signaling areas where a reversal or a consolidation might occur.
//+------------------------------------------------------------------+
//| VKW Bands.mq4.mq4
//| Rosh
//| http://www.investo.ru/forum/viewtopic.php?p=188196&sid=3564b6effe75d85c5526211453ddb860#188196
//+------------------------------------------------------------------+
#property copyright "Rosh"
#property link      "http://www.investo.ru/forum/viewtopic.php?p=188196&sid=3564b6effe75d85c5526211453ddb860#188196"
//----
#property indicator_separate_window
#property indicator_buffers 3
#property indicator_color1 Blue
#property indicator_color2 Blue
#property indicator_color3 Red
//---- input parameters
extern int       RangePeriod=25;
extern int       SmoothPeriod=3;
extern int       SmoothMode=MODE_SMA;
extern int       Per=5;
//---- buffers
double ExtMapBuffer0[];
double ExtMapBuffer1[];
double ExtMapBuffer2[];
double ExtMapBuffer3[];
double ExtMapBuffer4[];
//double ExtMapBuffer5[];
//+------------------------------------------------------------------+
//| Custom indicator initialization function                         |
//+------------------------------------------------------------------+
int init()
  {
//---- indicators
   IndicatorBuffers(5);
   SetIndexStyle(0,DRAW_LINE);
   SetIndexBuffer(0,ExtMapBuffer1);
   SetIndexDrawBegin(0,SmoothPeriod);
   SetIndexStyle(1,DRAW_LINE);
   SetIndexBuffer(1,ExtMapBuffer2);
   SetIndexDrawBegin(1,SmoothPeriod);
   SetIndexBuffer(2,ExtMapBuffer0);
   SetIndexBuffer(3,ExtMapBuffer3);
   SetIndexBuffer(4,ExtMapBuffer4);
//----
   return(0);
  }
//+------------------------------------------------------------------+
//| Custom indicator deinitialization function                       |
//+------------------------------------------------------------------+
int deinit()
  {
//----
//----
   return(0);
  }
//+------------------------------------------------------------------+
//| Custom indicator iteration function                              |
//+------------------------------------------------------------------+
int start()
  {
   int    counted_bars=IndicatorCounted();
//----
   int limit,limit1,cnt,n_max,n_min;
   if (counted_bars==0)
     {
      limit=Bars-RangePeriod;
      limit1=limit-SmoothPeriod;
     }
   if (counted_bars>0)
     {
      limit=Bars-counted_bars;
      limit1=limit;
     }
   limit--;
   limit1--;
   for(cnt=limit; cnt>=0;cnt--)
     {
      ExtMapBuffer0[cnt]=iCustom(NULL,0,"IBS",Per,0,cnt);
     }
   for(cnt=limit; cnt>=0;cnt--)
     {
      n_max=ArrayMaximum(ExtMapBuffer0,RangePeriod,cnt);
      n_min=ArrayMinimum(ExtMapBuffer0,RangePeriod,cnt);
      ExtMapBuffer3[cnt]=ExtMapBuffer0[n_max];
      ExtMapBuffer4[cnt]=ExtMapBuffer0[n_min];
     }
   for(cnt=limit1; cnt>=0;cnt--)
     {
      ExtMapBuffer1[cnt]=iMAOnArray(ExtMapBuffer3,0,SmoothPeriod,0,SmoothMode,cnt);
      ExtMapBuffer2[cnt]=iMAOnArray(ExtMapBuffer4,0,SmoothPeriod,0,SmoothMode,cnt);
     }
//----
   return(0);
  }
//+------------------------------------------------------------------+
Comments