VininI_Cyber Cycle(V2)m
Download script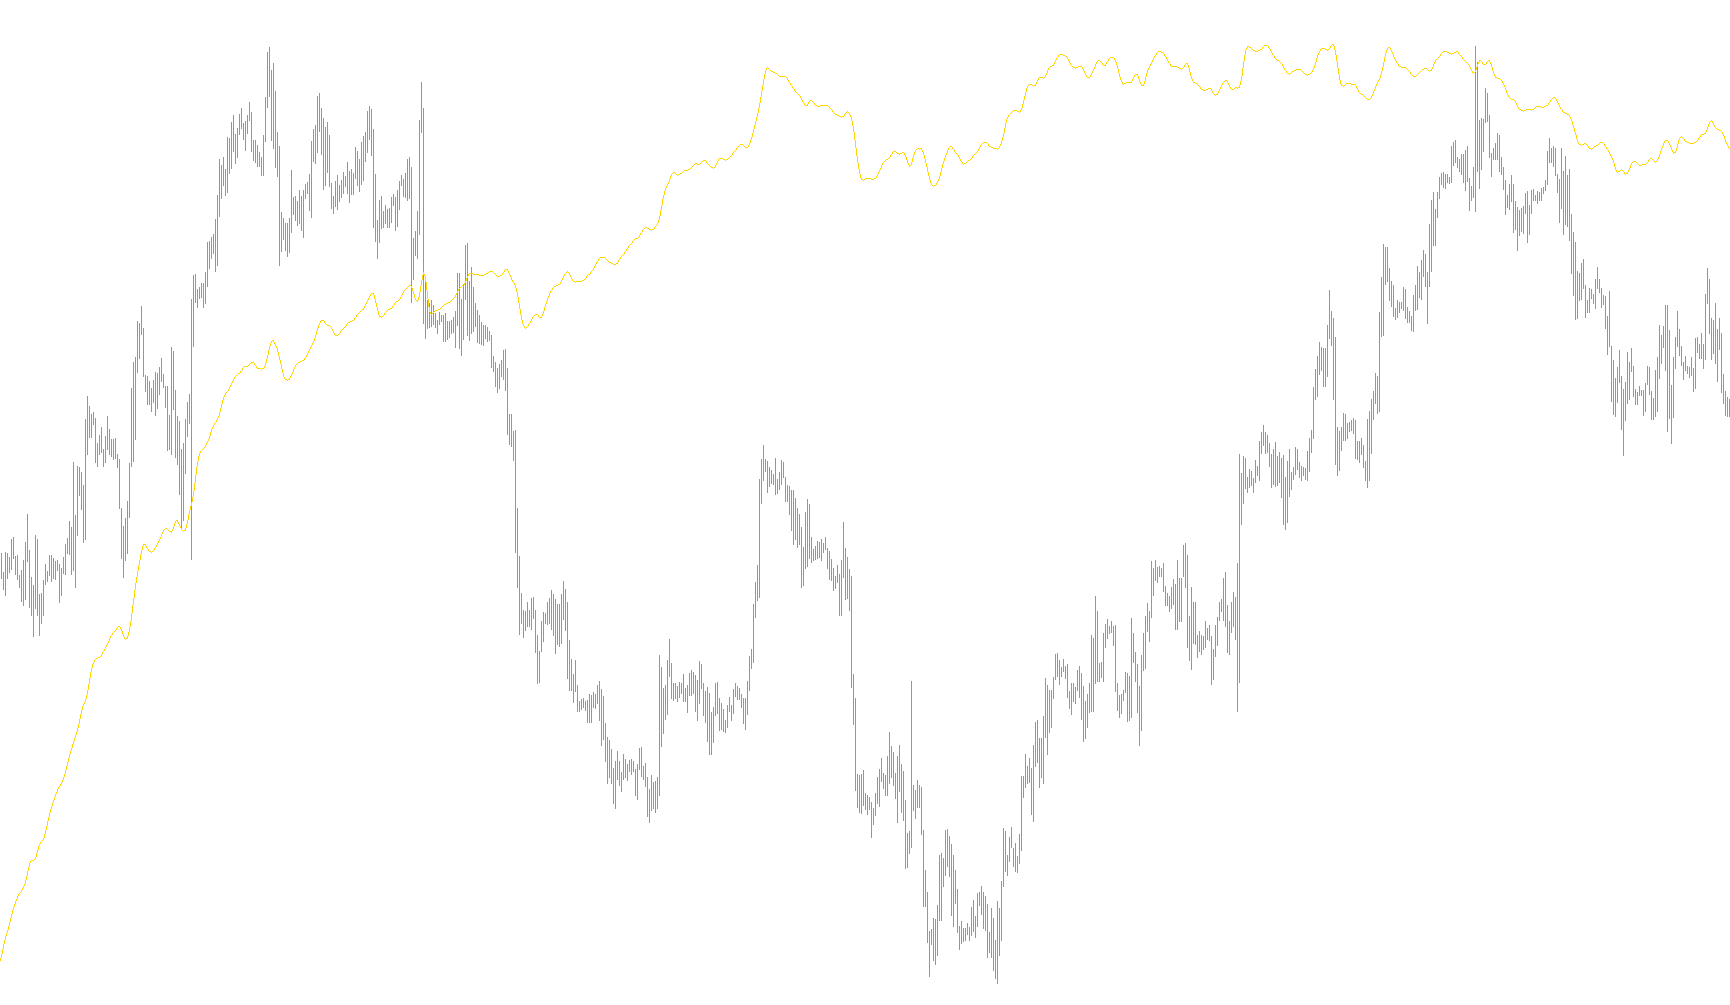
The VininI_Cyber tool is a specialized technical analysis indicator designed to help traders identify market cycles and potential reversal points by smoothing out market noise. Instead of looking at raw, jagged price movements, this script processes data through several layers of calculation to reveal the underlying momentum of the asset.
Core Logic and Functionality
The indicator operates through a three-step mathematical process to translate price action into actionable visual signals:
1. Price Smoothing (The Foundation) First, the script identifies the "base" price of the asset. You can choose between various types of price data (such as Close, Open, High, Low, or weighted averages). It then takes a weighted average of the current and previous four bars. This ensures that the indicator isn't distracted by sudden, temporary spikes and instead focuses on the broader trend.
2. Cycle Calculation (The Momentum Engine) Once the smoothed price is established, the script applies a complex calculation to determine the "Cycle." This step looks at the relationship between current price trends and previous cycles. It essentially measures how much momentum is building or fading. By comparing current data against historical values, it helps determine if the market is accelerating in one direction or preparing for a change.
3. Signal Generation (The Visual Output) The final stage converts these cycle calculations into a readable format that provides clear visual cues:
- Trend Identification: The script calculates a value that fluctuates between specific bounds.
- Buy Signals: When the momentum reaches a specific upper threshold (defined by the "level" parameter), the indicator highlights a potential buying opportunity in green.
- Sell Signals: Conversely, when the momentum drops below a specific lower threshold, it highlights a potential selling opportunity in red.
How to Interpret the Results
The tool provides a visual representation of market cycles in a separate window on your chart. Rather than just telling you "buy" or "sell" based on a single candle, it helps you see where the market is currently positioned within its natural cycle. When the indicator hits the designated levels, it suggests that the current momentum has reached an extreme point, potentially signaling a shift in the market direction.
//+------------------------------------------------------------------+
//|                                                     VininI_Cyber |
//|                                Copyright © 2009, Victor Nicolaev |
//|                                            e-mail: vinin@mail.ru |
//+------------------------------------------------------------------+
#property copyright "Copyright © 2008, Victor Nicolaev"
#property link      "e-mail: vinin@mail.ru"

#property indicator_separate_window
#property indicator_buffers 3
#property indicator_color1 Yellow
#property indicator_color2 Green
#property indicator_color3 Red
//#property indicator_level1  -0.5
//#property indicator_level2   0.5
//#property indicator_minimum -1.05
//#property indicator_maximum  1.05
#property indicator_levelcolor  SlateGray

//---- input parameters

extern double alpha=0.01;
extern double betta=1.0;
extern int price_mode=4;
extern double level =0.5;

//---- buffers

double Cycle[];
double Smonth[];
double iCycle[];
double Buy[];
double Sell[];

//+------------------------------------------------------------------+
//| Custom indicator initialization function |
//+------------------------------------------------------------------+
int init() {
   IndicatorBuffers(5);
   SetIndexBuffer(0, iCycle);
   SetIndexStyle(0,DRAW_LINE);
   SetIndexBuffer(1, Buy);
   SetIndexStyle(1,DRAW_LINE);
   SetIndexBuffer(2, Sell);
   SetIndexStyle(2,DRAW_LINE);

   SetIndexBuffer(3, Smonth);
   SetIndexBuffer(4, Cycle);

SetLevelValue (0, level);
SetLevelValue (1,-level);

   return(0);
}

int deinit() { return(0); }


//+------------------------------------------------------------------+
//| Custom indicator iteration function |
//+------------------------------------------------------------------+
int start() {
   int counted_bars = IndicatorCounted();

   if (counted_bars < 0) return(-1);
   if (counted_bars > 0) counted_bars--;

   int limit=Bars - counted_bars;
   for(int i = limit; i >= 0; i--)    {
      Smonth[i]=(Price(i)+2.0*Price(i+1)+2.0*Price(i+2)+Price(i+3))/6.0;
   }
   for(i = limit; i >= 0; i--)    {
      Cycle[i]=betta*((1.0-0.5*alpha)*(1.0-0.5*alpha)*(Smonth[i]-2.0*Smonth[i+1]+Smonth[i+2])+2.0*(1.0-alpha)*Cycle[i+1]-(1.0-alpha)*(1.0-alpha)*Cycle[i+2]);
      iCycle[i]=(MathExp(2.0*Cycle[i])-1.0)/(MathExp(2.0*Cycle[i])+1.0);
      if (iCycle[i]>= level) {Buy[i]=iCycle[i];Buy[i+1]=iCycle[i+1];}
      if (iCycle[i]<=-level) {Sell[i]=iCycle[i];Sell[i+1]=iCycle[i+1];}
   }

   return(0);
}
//+------------------------------------------------------------------+

double Price(int pos){
   switch (price_mode){
      case PRICE_CLOSE: return(Close[pos]);
      case PRICE_OPEN: return(Open[pos]);
      case PRICE_HIGH: return(High[pos]);
      case PRICE_LOW: return(Low[pos]);
      case PRICE_MEDIAN: return((High[pos]+Low[pos])/2.0);
      case PRICE_TYPICAL: return((High[pos]+Low[pos]+Close[pos])/3.0);
      case PRICE_WEIGHTED: return((High[pos]+Low[pos]+Close[pos]+Close[pos])/4.0);
   }
}
Comments