Waddah_Attar_ADXxBollinger
Indicator

Waddah_Attar_ADXxBollinger

iBandsiADX

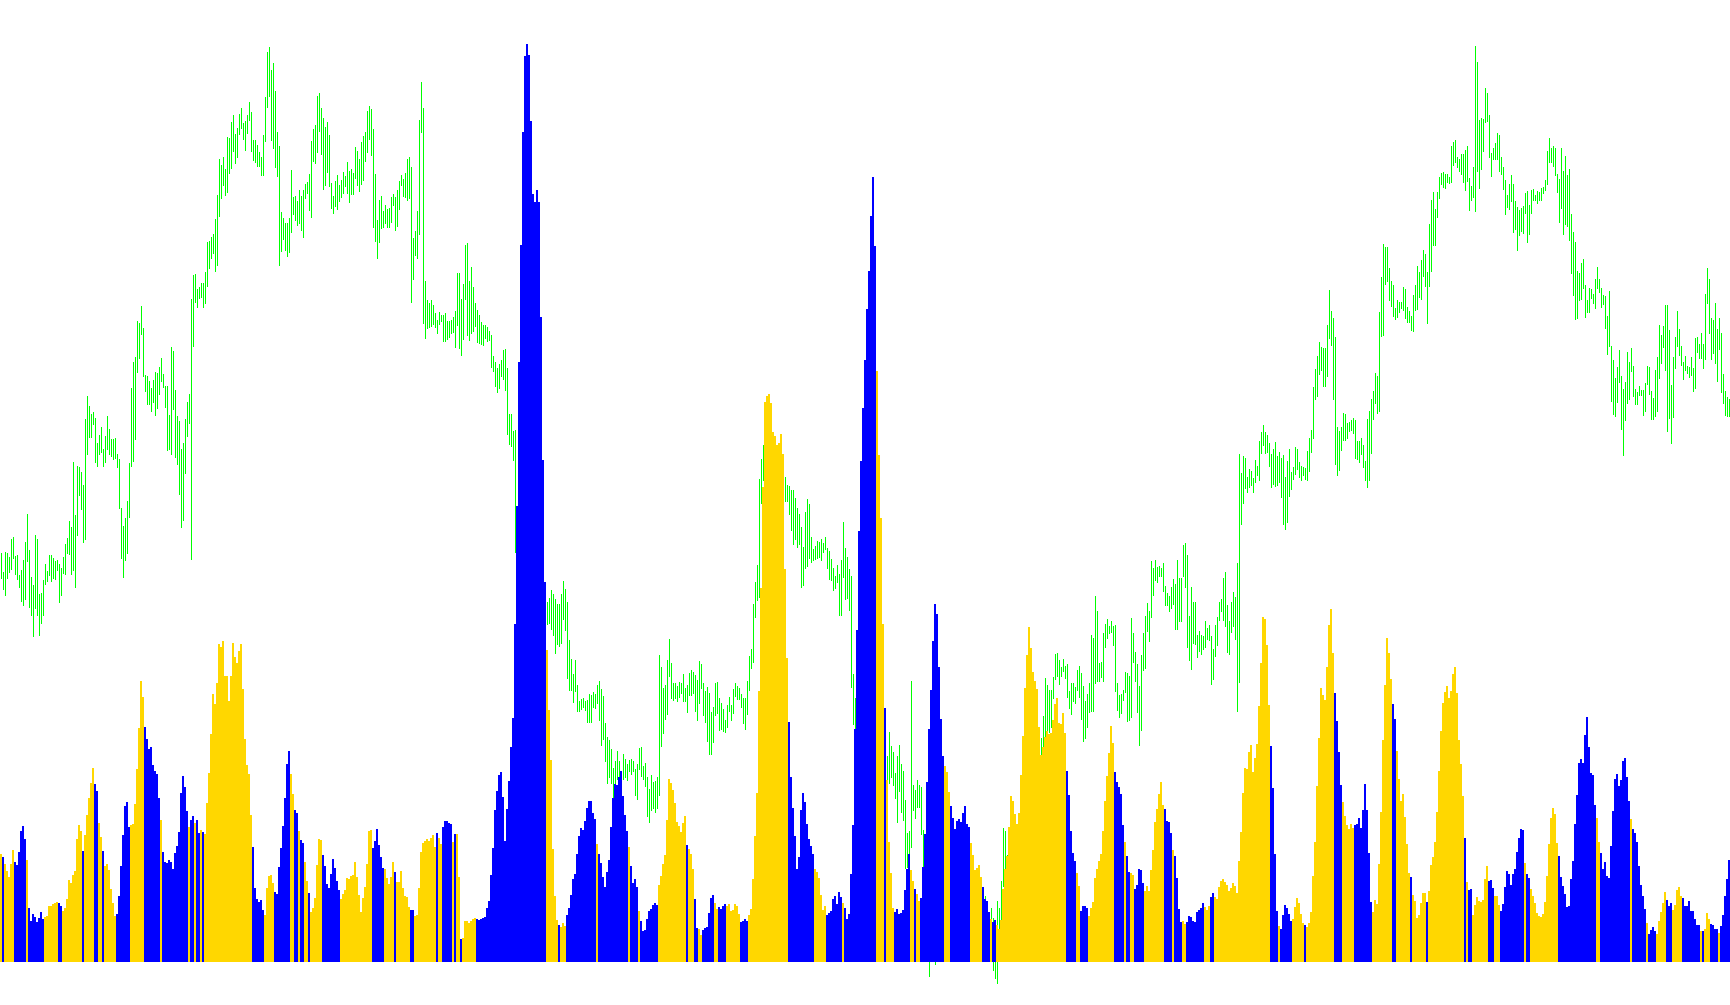
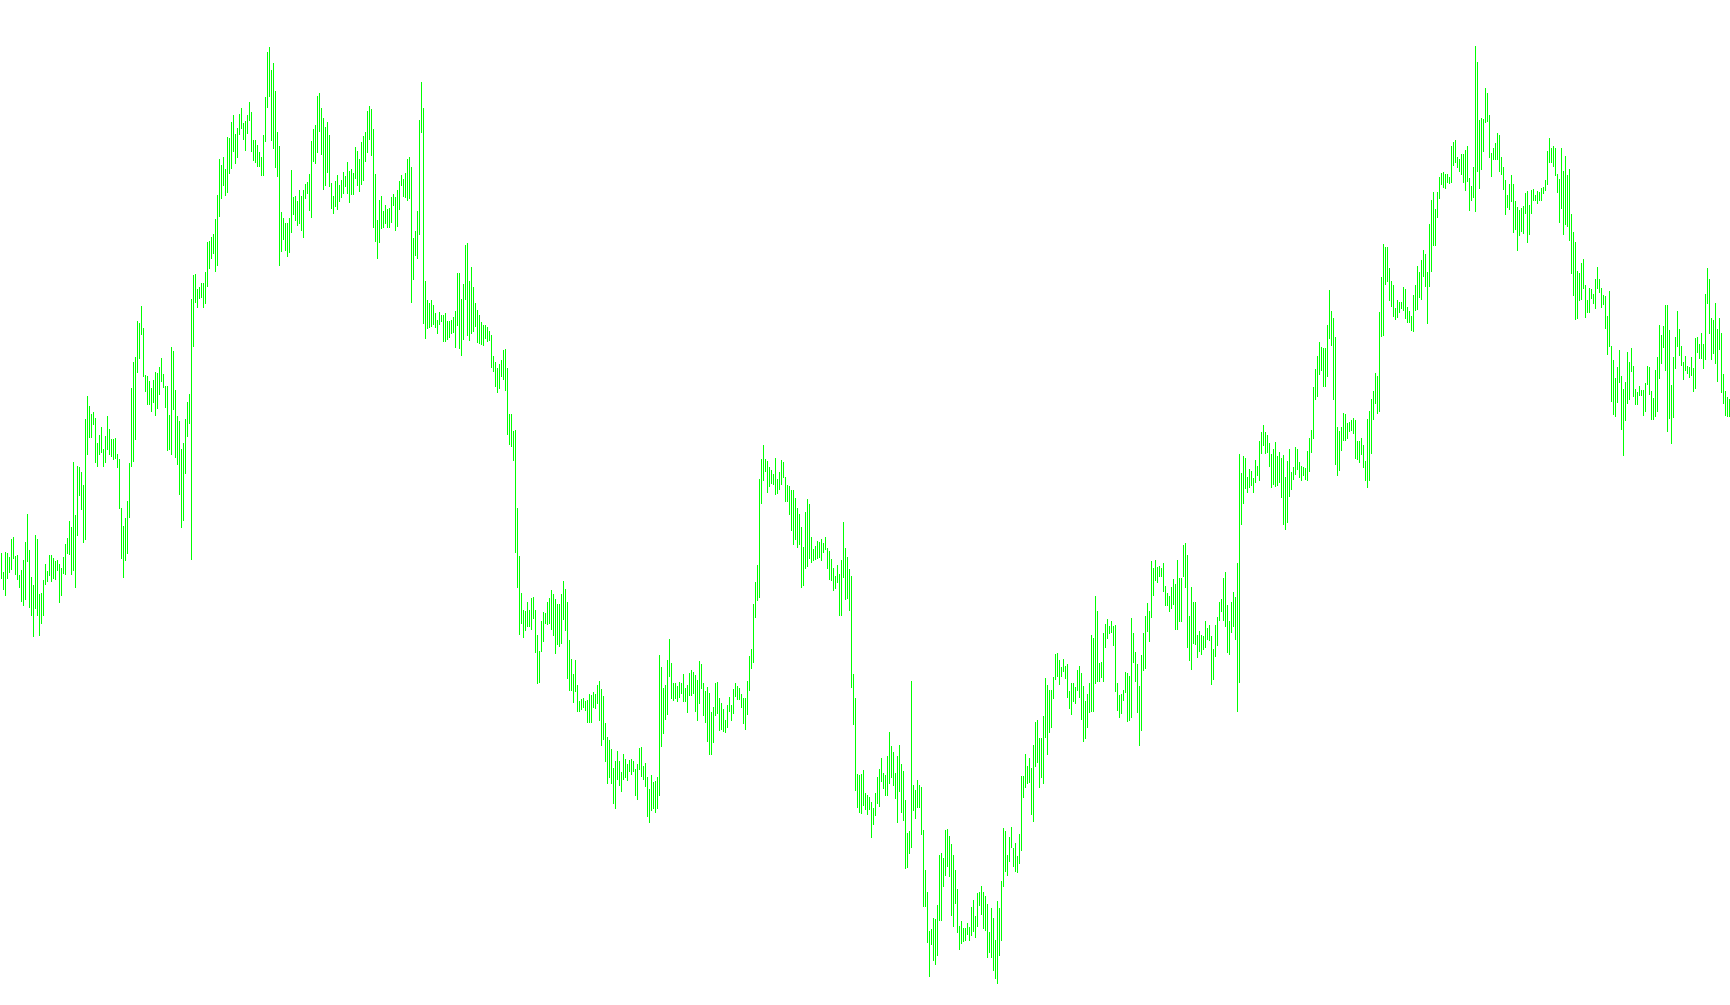
This indicator synchronizes the ADX trend strength with Bollinger Band expansion width to visualize directional momentum intensity.

Waddah_Attar_BUY_SELL_Vol
Indicator

Waddah_Attar_BUY_SELL_Vol

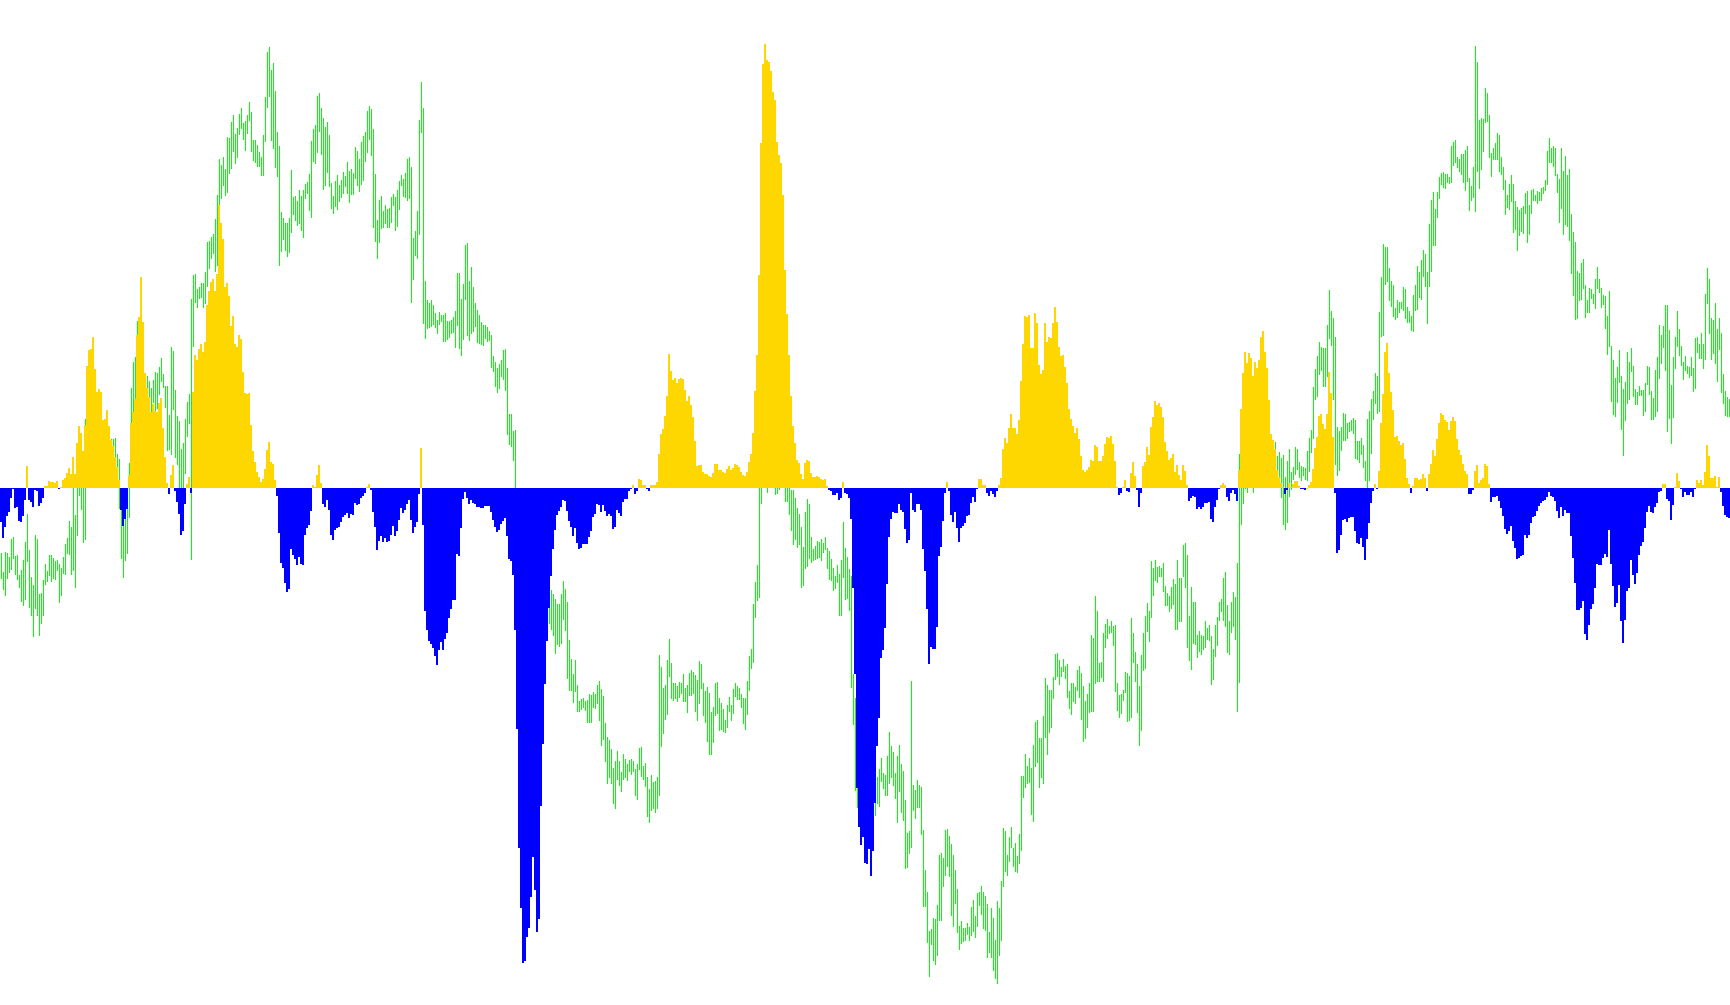
This indicator quantifies market participation by aggregating cumulative tick volume based on price directionality to distinguish between bullish accumulation and bearish distribution.

Waddah_Attar_Dayly_CAMARILLA
Indicator

Waddah_Attar_Dayly_CAMARILLA

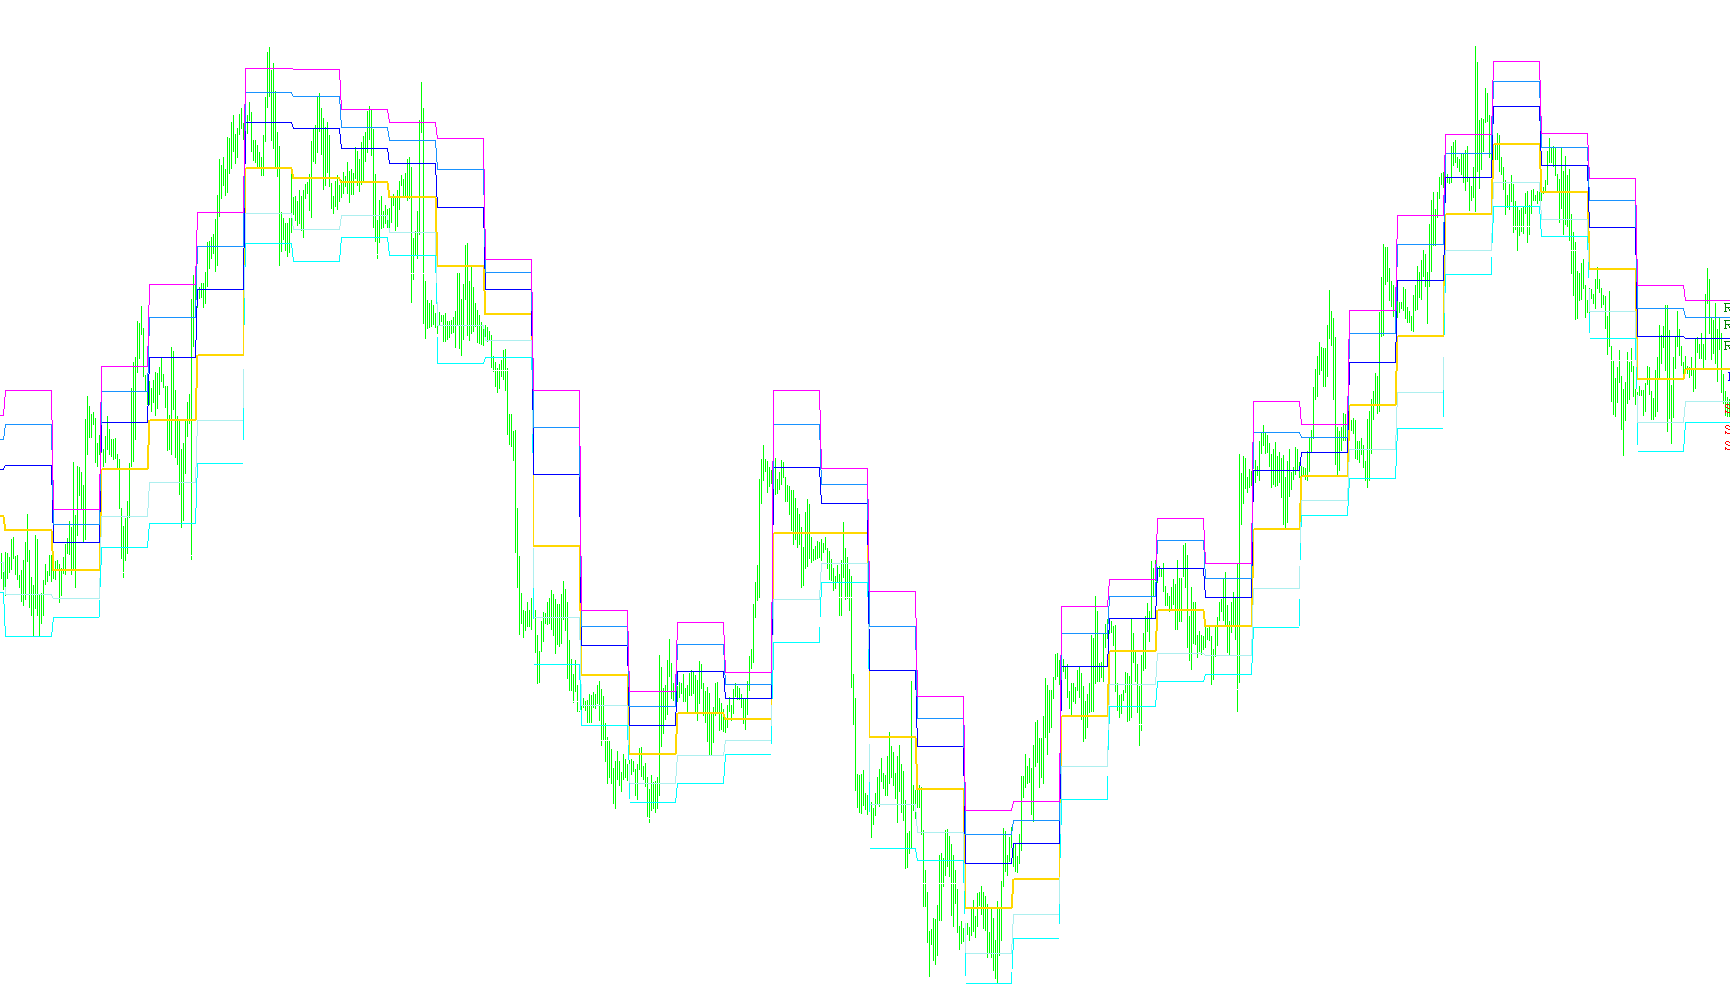
This indicator projects key support and resistance levels by calculating fixed percentage offsets of the previous day's range relative to its closing price.

Waddah_Attar_Def_RSI
Indicator

Waddah_Attar_Def_RSI

iMAOnArrayiRSI

This indicator quantifies price velocity by calculating the spread between two distinct RSI periods and applying a Simple Moving Average to smooth the resulting volatility.

Waddah_Attar_Explosion
Indicator

Waddah_Attar_Explosion

iBandsiMACD

This system identifies high-velocity market entries by calculating the relative acceleration of MACD trend shifts against expanding Bollinger Band volatility thresholds.

Waddah_Attar_Explosion1
Indicator

Waddah_Attar_Explosion1

iBandsiMACD

This indicator identifies high-velocity market entries by calculating the relative acceleration between MACD trend shifts and Bollinger Band expansion thresholds.

Waddah_Attar_Explosion_001
Indicator

Waddah_Attar_Explosion_001

iBandsiMACD

This indicator identifies high-velocity market entries by calculating the relative rate of change between MACD momentum and Bollinger Band expansion against predefined threshold filters.

Waddah_Attar_HTML
Indicator

Waddah_Attar_HTML

This script parses historical price action and volume metrics to generate a structured HTML report featuring calculated price ranges and percentage changes.

Waddah_Attar_OMN
Indicator

Waddah_Attar_OMN

iBandsiMACD

This indicator quantifies market velocity by calculating the product of MACD rate of change and Bollinger Band width to identify trend strength and volatility expansion.

Waddah_Attar_Pivot_Fibo_First
Indicator

Waddah_Attar_Pivot_Fibo_First

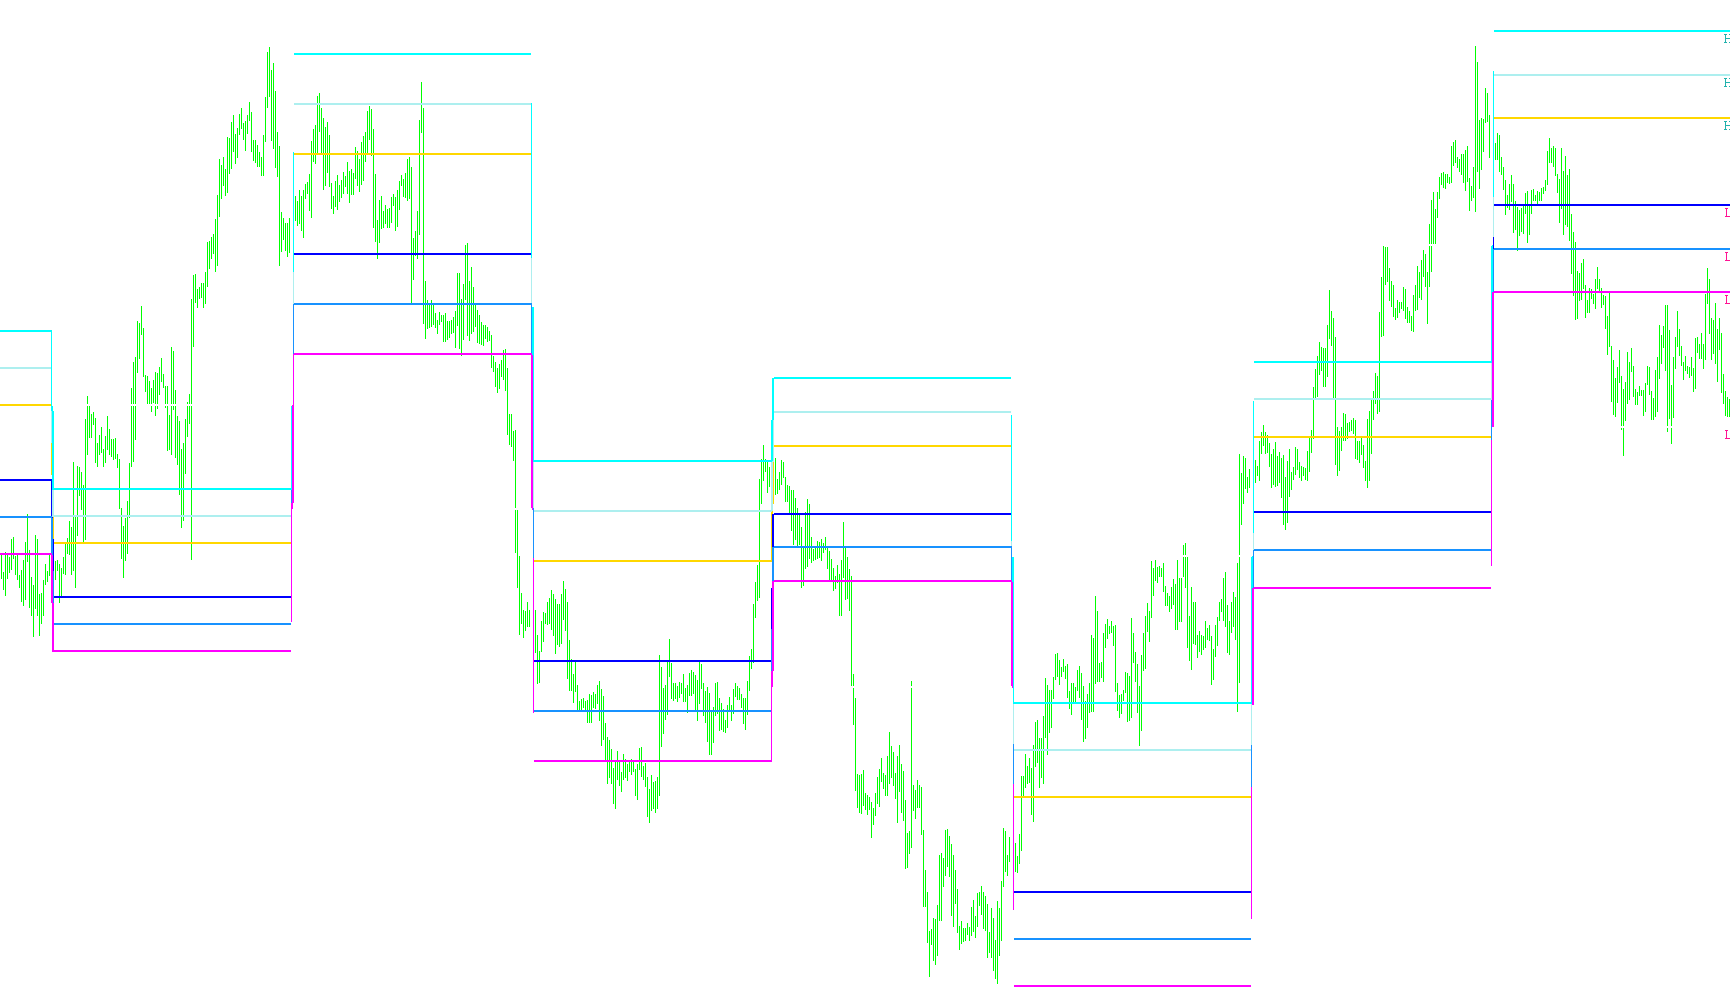
This indicator calculates and plots daily pivot points, support levels, and resistance zones using a weighted average of previous session price extremes and opening/closing data.

Waddah_Attar_Pivot_Fibo_Second
Indicator

Waddah_Attar_Pivot_Fibo_Second

This indicator calculates daily pivot points and projects multi-layered resistance and support levels (R4-R7, S4-S7) based on the previous day's price range and volatility coefficients.

Waddah_Attar_Trend
Indicator

Waddah_Attar_Trend

iBandsiMACD

Quantifies market trajectory by calculating the product of MACD directional velocity and Bollinger Band expansion breadth.

Waddah_Attar_Weekly_CAMARILLA
Indicator

Waddah_Attar_Weekly_CAMARILLA

This indicator identifies weekly price equilibrium levels by calculating dynamic support and resistance zones based on the previous week's high-low range.

Waddah_Attar_Weekly_Pivot_Fibo_First
Indicator

Waddah_Attar_Weekly_Pivot_Fibo_First

This indicator projects weekly price boundaries by calculating a central pivot point and three distinct levels of support and resistance based on the previous week's high, low, open, and close prices.

Waddah_Attar_Weekly_Pivot_Fibo_Second
Indicator

Waddah_Attar_Weekly_Pivot_Fibo_Second

This indicator projects weekly price levels by calculating multi-tier support and resistance zones based on the previous week's range and pivot point.
wae
Indicator

wae

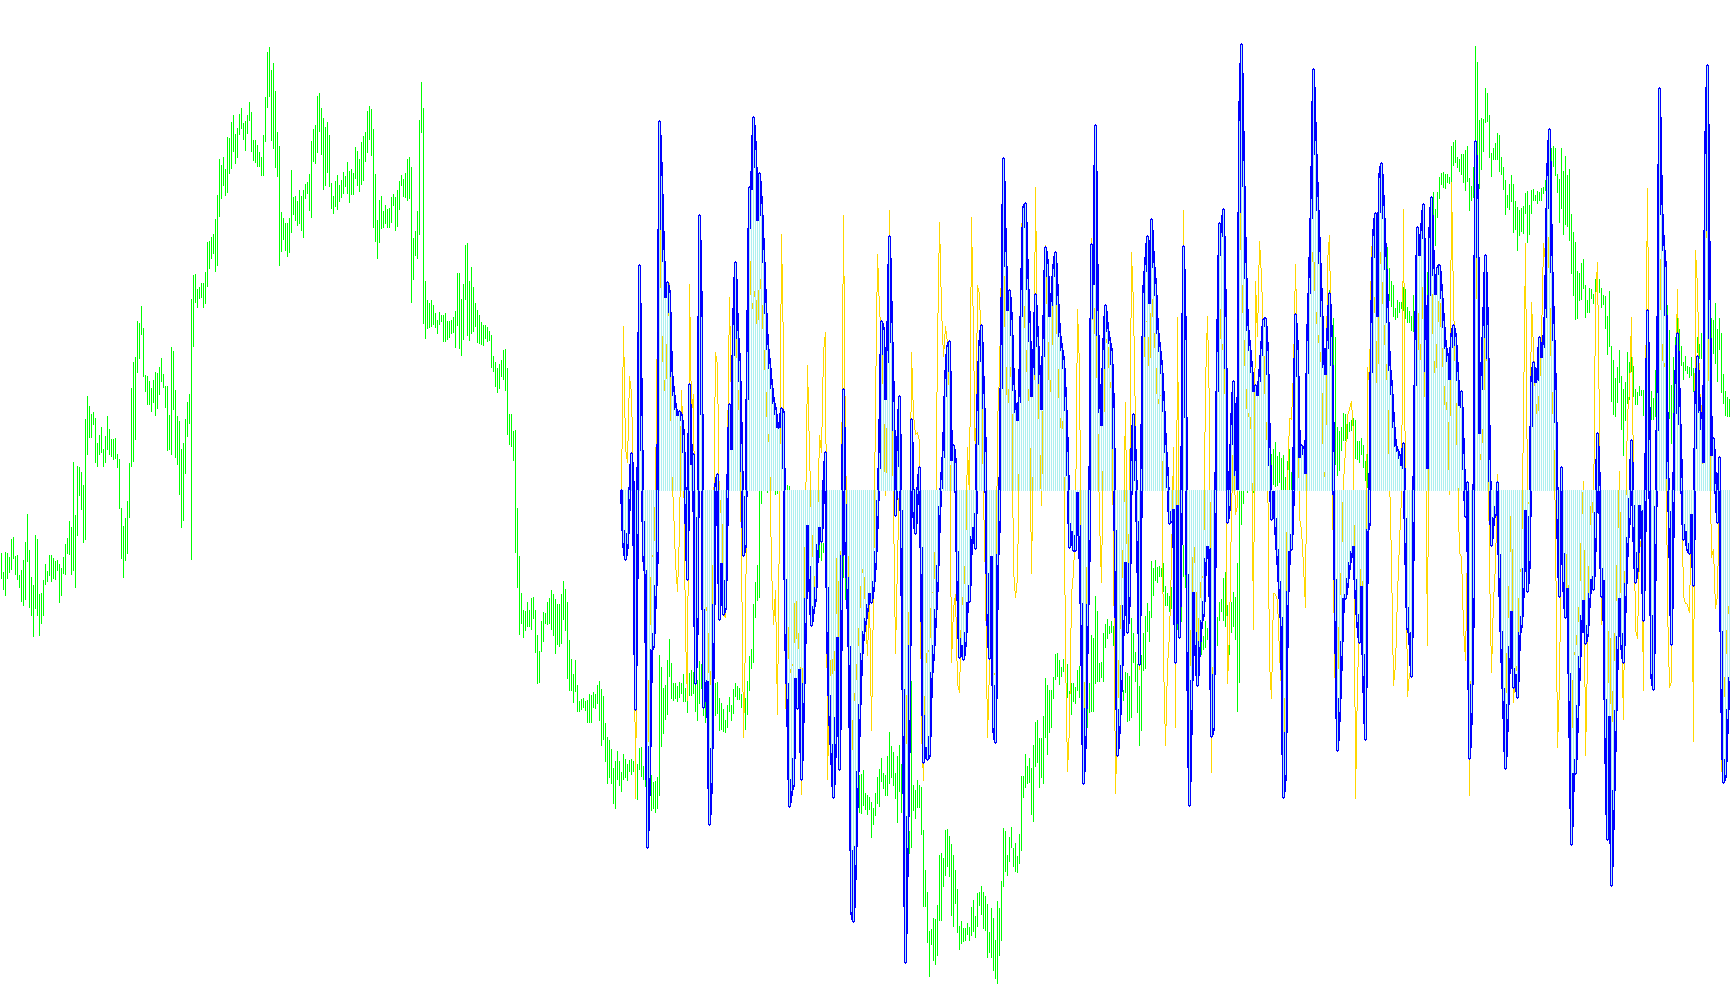
This indicator identifies significant bullish and bearish trend reversals by detecting momentum threshold breaches within the Waddah Attar Explosion algorithm.

Waist_Close_Levels
Indicator

Waist_Close_Levels

The indicator projects chronological horizontal levels based on the previous day's closing prices and the arithmetic midpoint of the opening and closing values across a specified lookback period.

WaitToTrade
Indicator

WaitToTrade

An automated execution controller that monitors real-time profit targets and enforces a mandatory cooling-off period before resuming new trades following a successful exit.

wajdyss_3MA_Indicator_V1
Indicator

wajdyss_3MA_Indicator_V1

iMA

This indicator identifies trend reversal opportunities by monitoring price momentum through the synchronized interaction of three distinct moving average layers.

wajdyss_ADX_Indicator_V1
Indicator

wajdyss_ADX_Indicator_V1

iADX

This indicator identifies bullish and bearish trend reversals by detecting Plus/Minus DI crossovers while the main ADX line exceeds a specified strength threshold.

wajdyss_Candles_Length_indicator_v1
Indicator

wajdyss_Candles_Length_indicator_v1

This indicator quantifies and visually maps the price range of individual candles by plotting numerical values corresponding to the high-low variance or body size at specific price coordinates.

wajdyss_Candle_Length_indicator_v1
Indicator

wajdyss_Candle_Length_indicator_v1

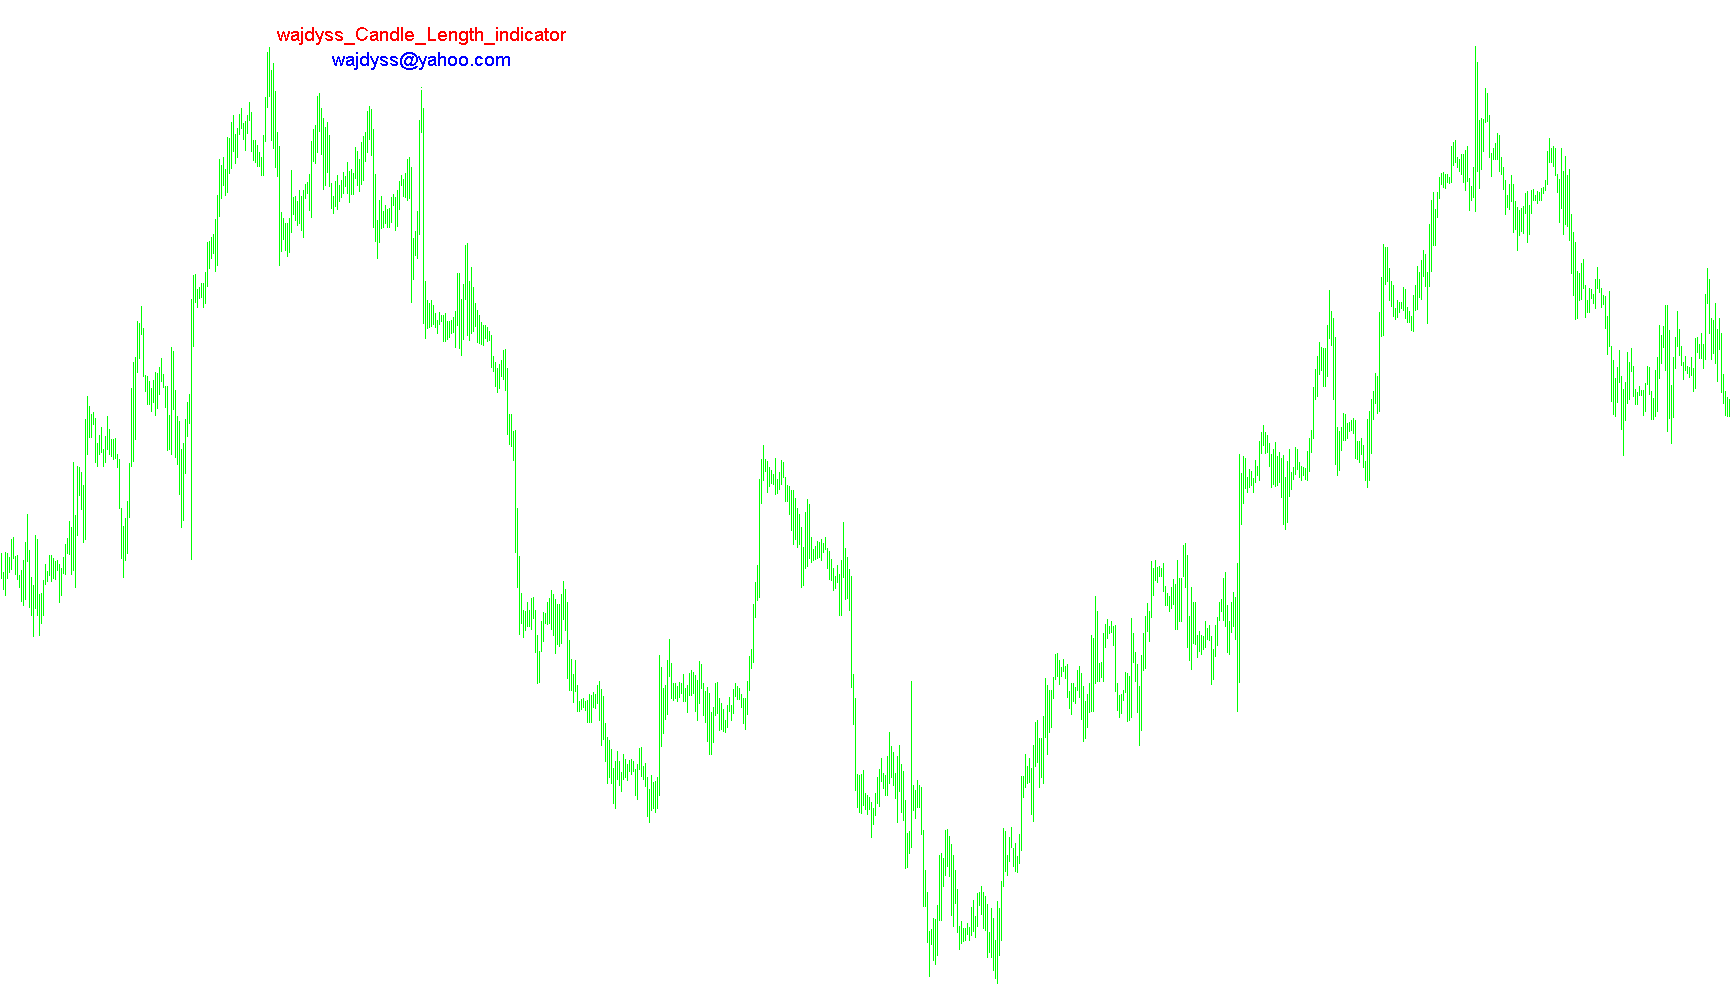
Calculates and displays the real-time point distance between the current candle's high and low extremes to measure instantaneous price range.

wajdyss_Comparison_indicator_v1
Indicator

wajdyss_Comparison_indicator_v1

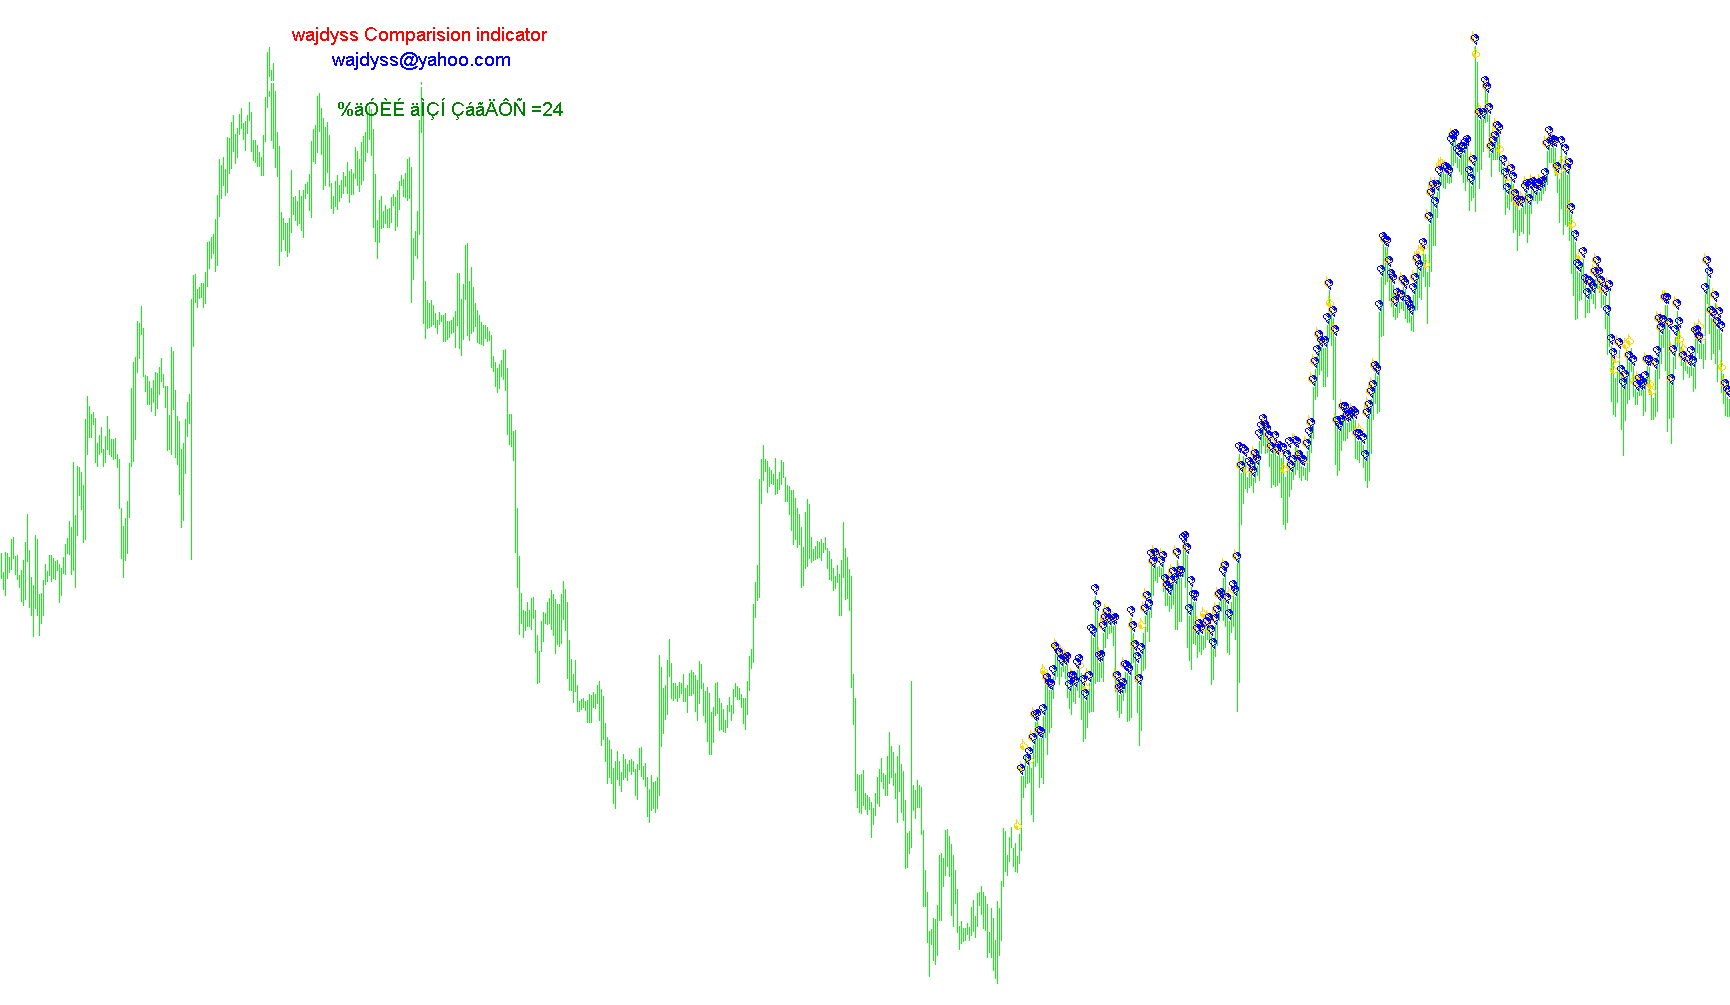
This indicator calculates the historical percentage of price direction alignment between the current symbol and a predefined external currency pair over a fixed lookback period.

wajdyss_FIBO_S_Indicator_V1
Indicator

wajdyss_FIBO_S_Indicator_V1

This indicator identifies trend reversal points by calculating dynamic Fibonacci retracements between local price extremes and triggering alerts on momentum breakouts.

wajdyss_H_L_C_indicator_v2
Indicator

wajdyss_H_L_C_indicator_v2

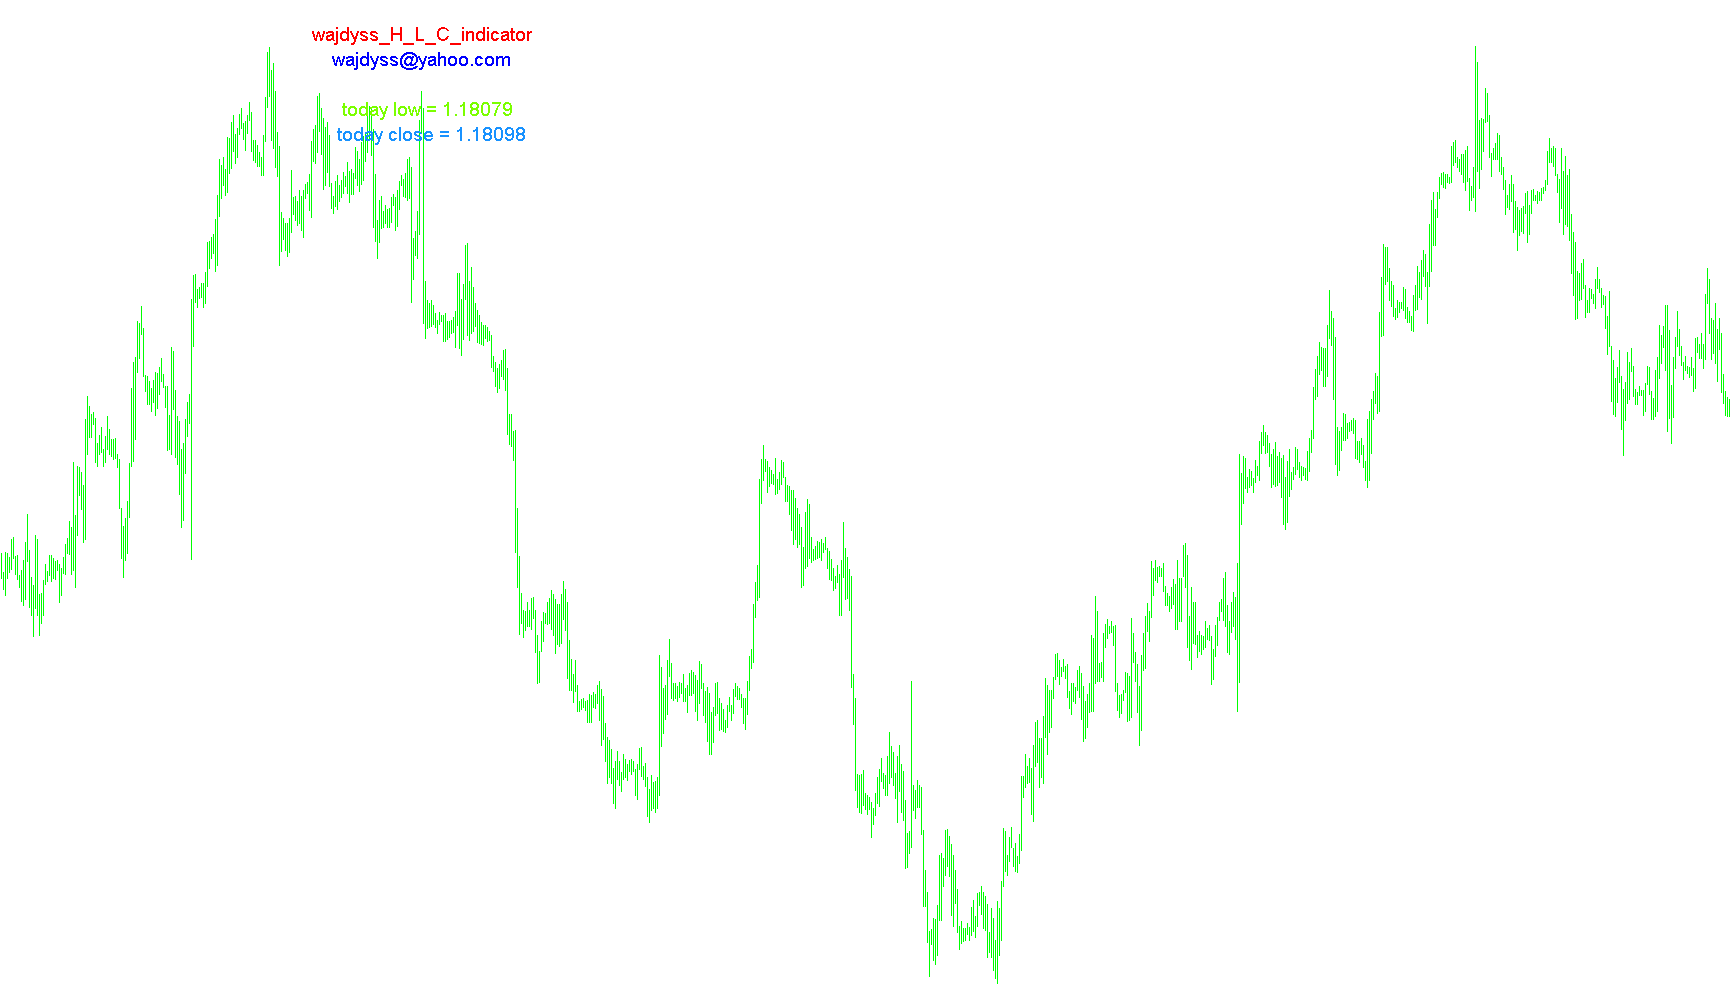
This indicator extracts and displays the current day's high, low, and closing price values as dynamic text labels on the chart for real-time session monitoring.

wajdyss_Ichimoku_Indicator_V1
Indicator

wajdyss_Ichimoku_Indicator_V1

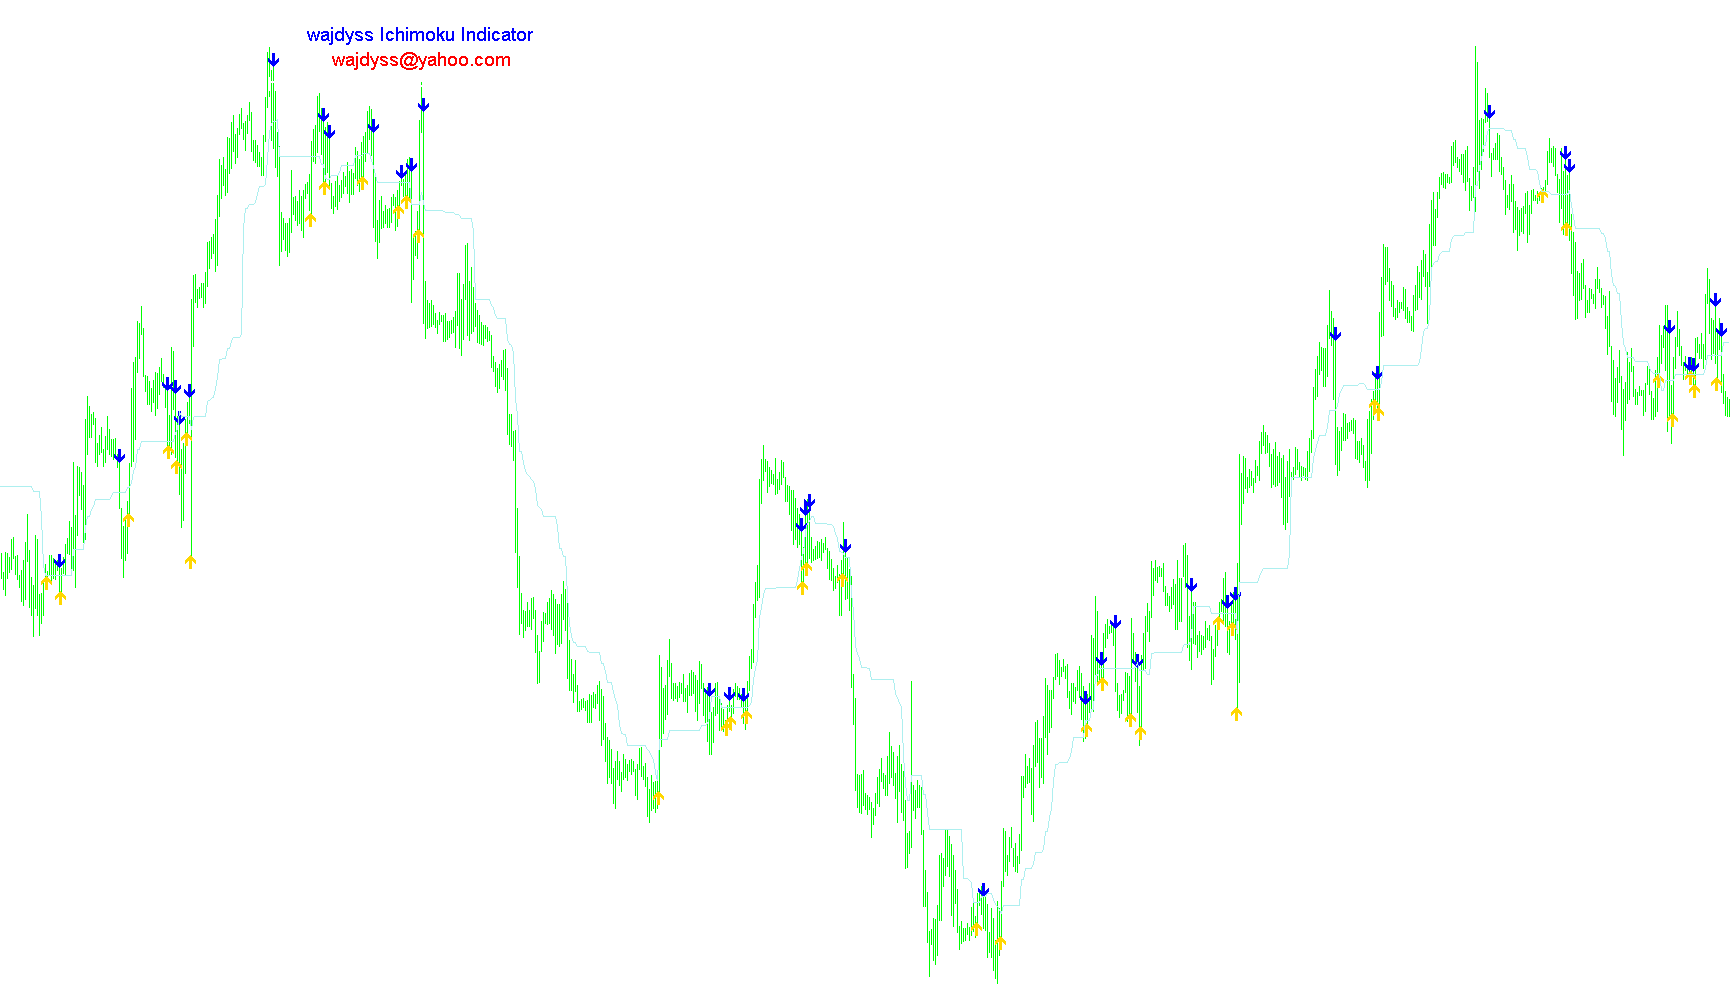
This indicator identifies trend reversals by detecting price crossovers relative to the Kijun-sen line and triggers real-time alerts on structural breaches.

wajdyss_information_indicator_v1
Indicator

wajdyss_information_indicator_v1

This indicator calculates multi-day historical price statistics by aggregating bullish and bearish candle data to derive average movement magnitudes, trend persistence, and price deviation metrics.

wajdyss_MA_indicator_v2
Indicator

wajdyss_MA_indicator_v2

iMA

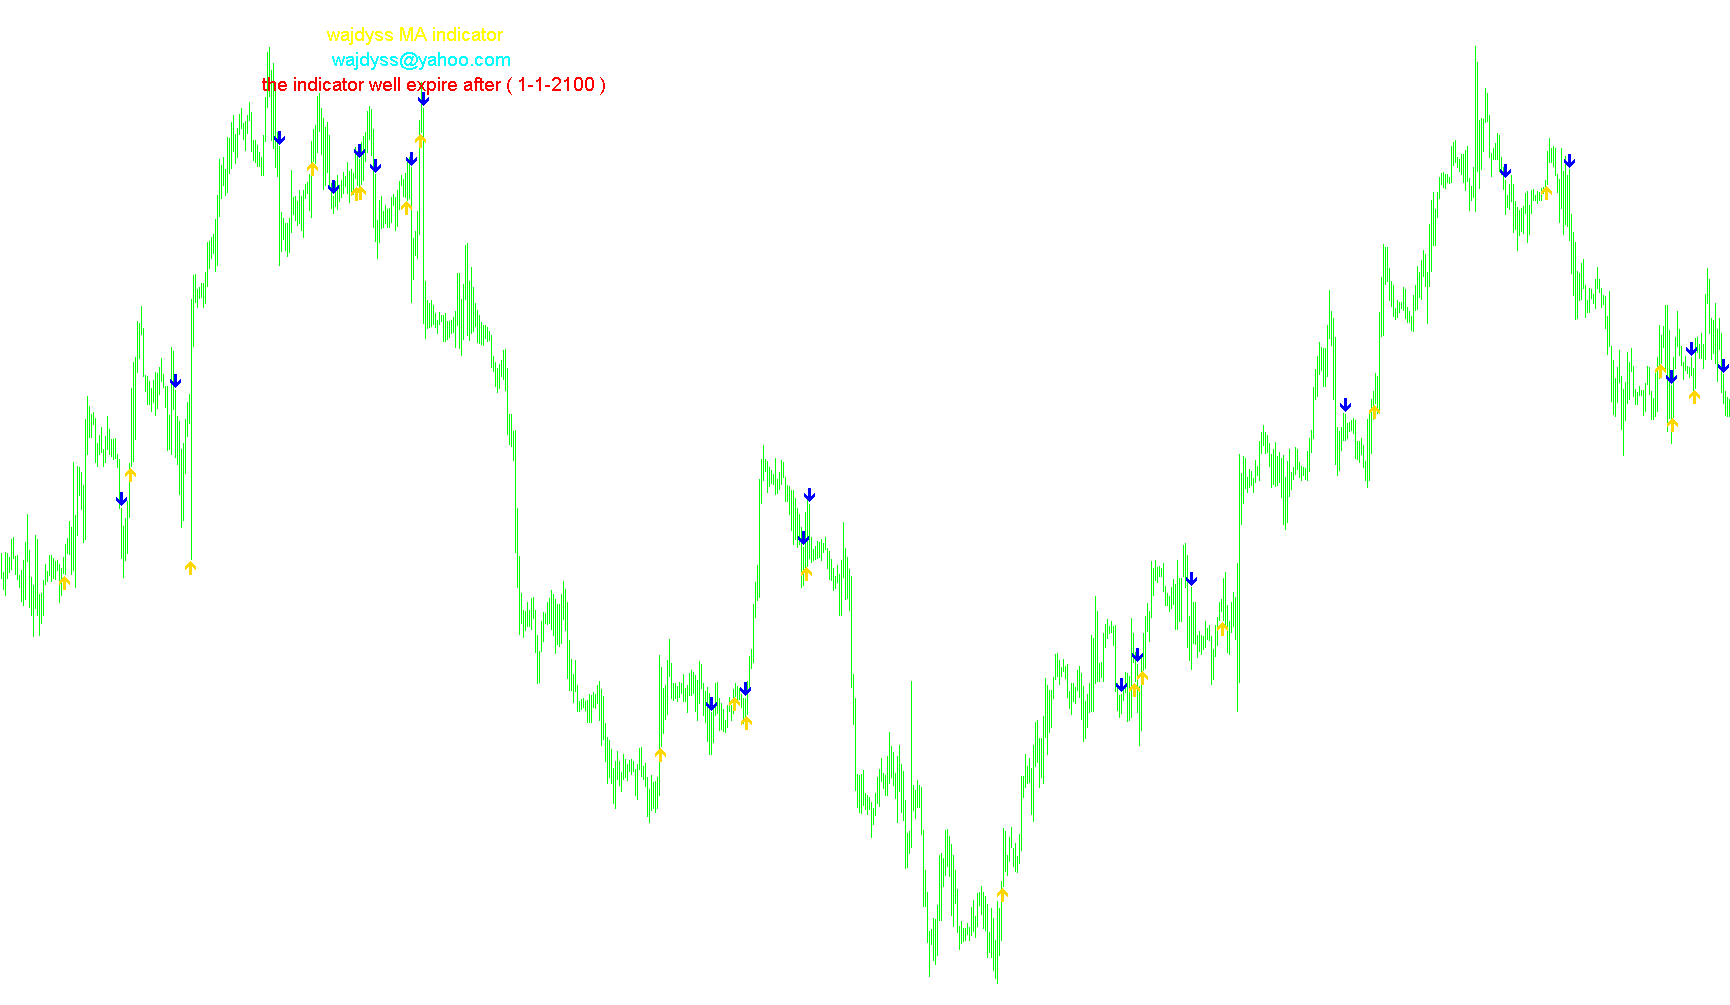
This indicator identifies trend reversal opportunities by detecting bullish and bearish crossovers between a fast and slow moving average while tracking historical signal reliability.

WAJDYSS_RSI_indicator_v1
Indicator

WAJDYSS_RSI_indicator_v1

iRSI

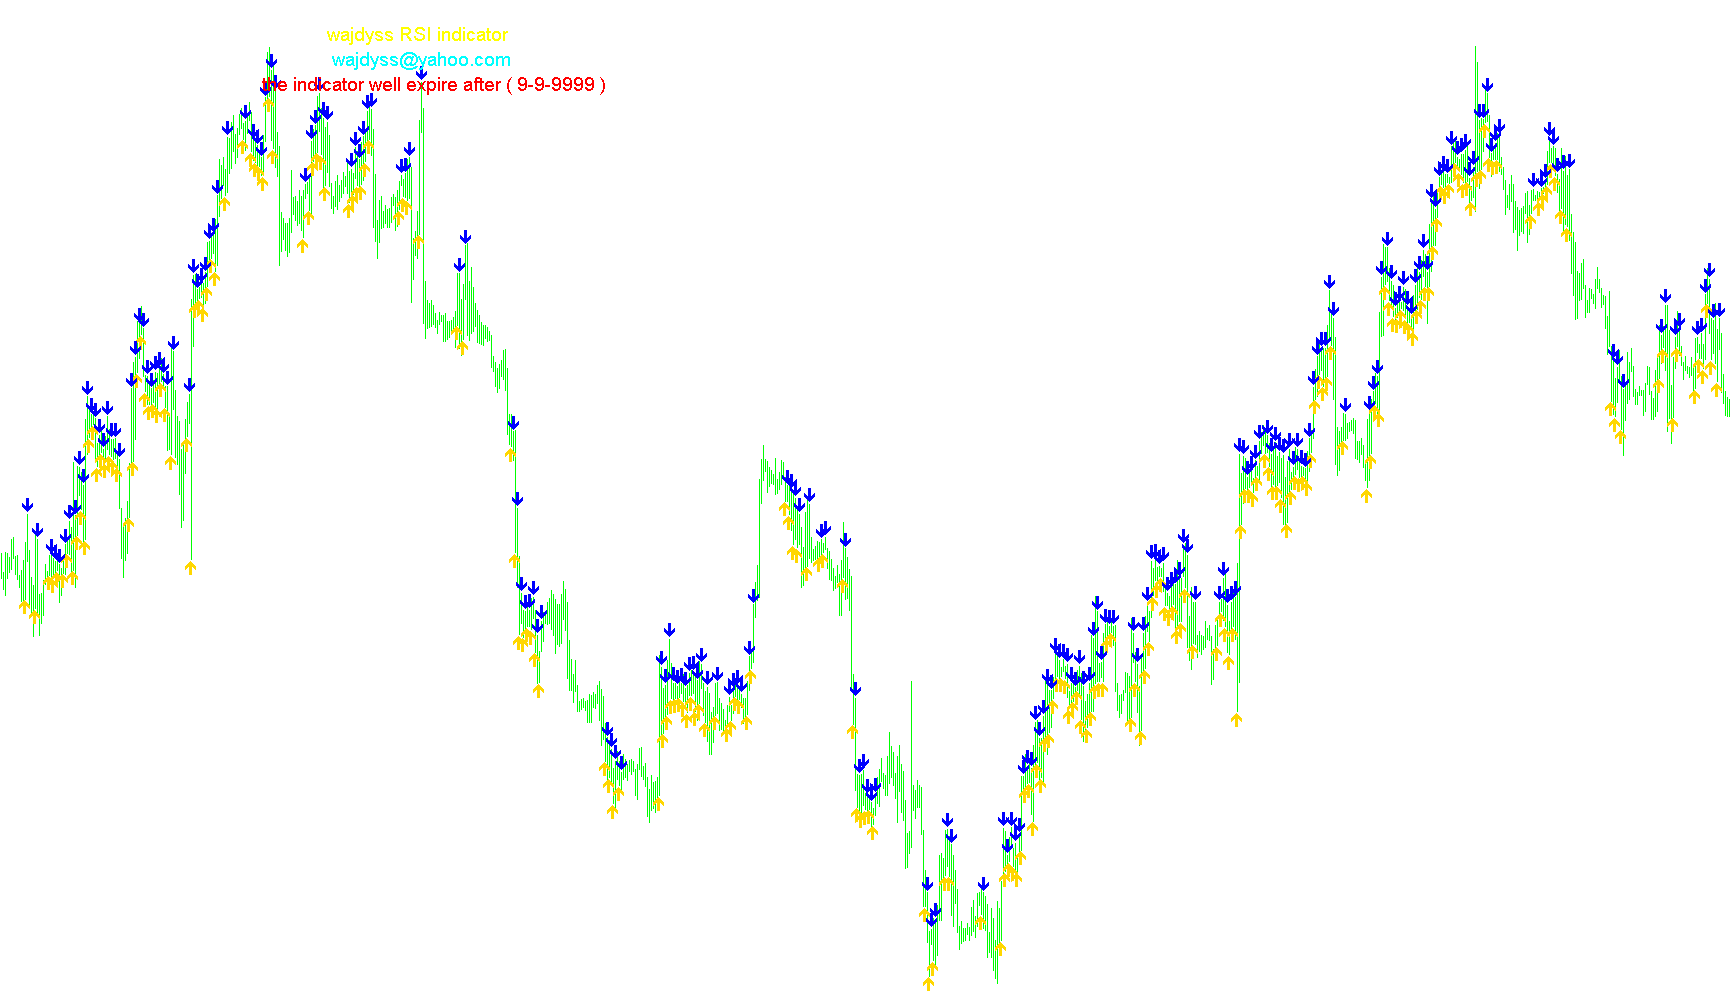
This indicator identifies directional shifts by detecting RSI movements between specific volatility zones and validates trend momentum through candle price actions.

wajdyss_RSI_O_L_H_C_Indicator_V2
Indicator

wajdyss_RSI_O_L_H_C_Indicator_V2

iRSI

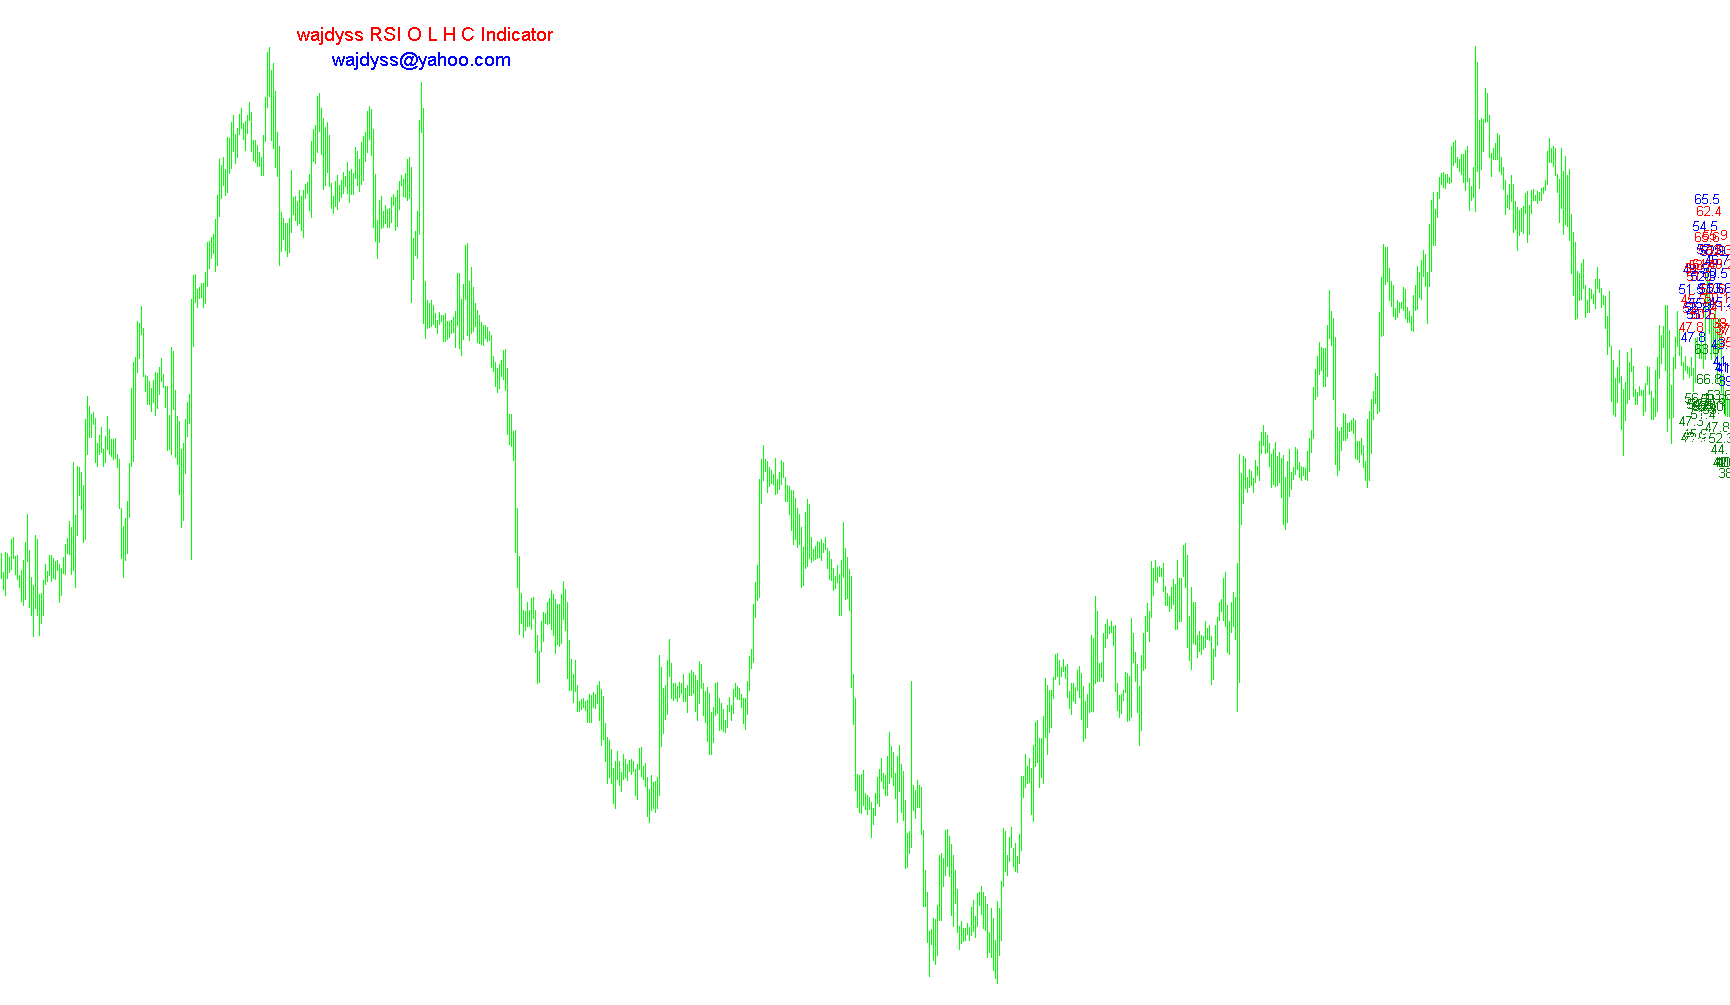
This indicator projects the Relative Strength Index values of Open, High, Low, and Close prices as distinct visual text labels on the price chart to identify momentum distribution.

WAJDYSS_SSL_channel_chart_alert_indicator_v2
Indicator

WAJDYSS_SSL_channel_chart_alert_indicator_v2

iMA

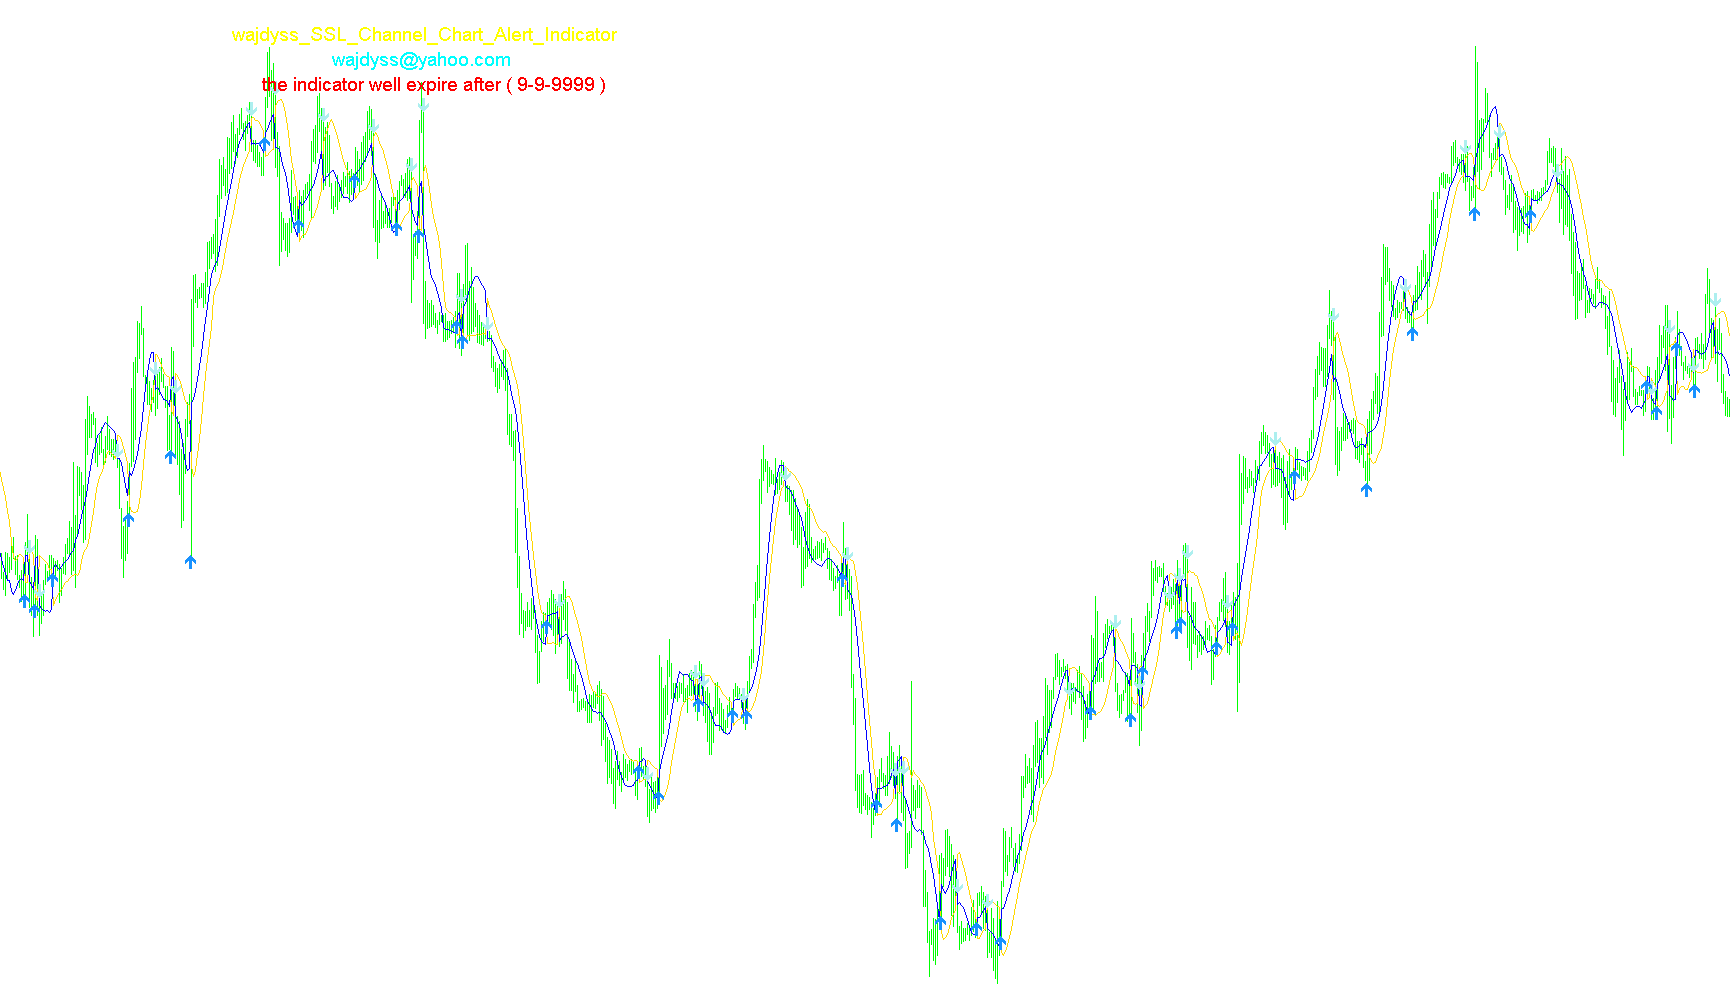
This indicator identifies trend shifts by calculating dynamic upper and lower boundaries based on moving average extremes and generating visual signals upon channel crossovers.

wajdyss_Stochastic_indicator_v1
Indicator

wajdyss_Stochastic_indicator_v1

iStochastic

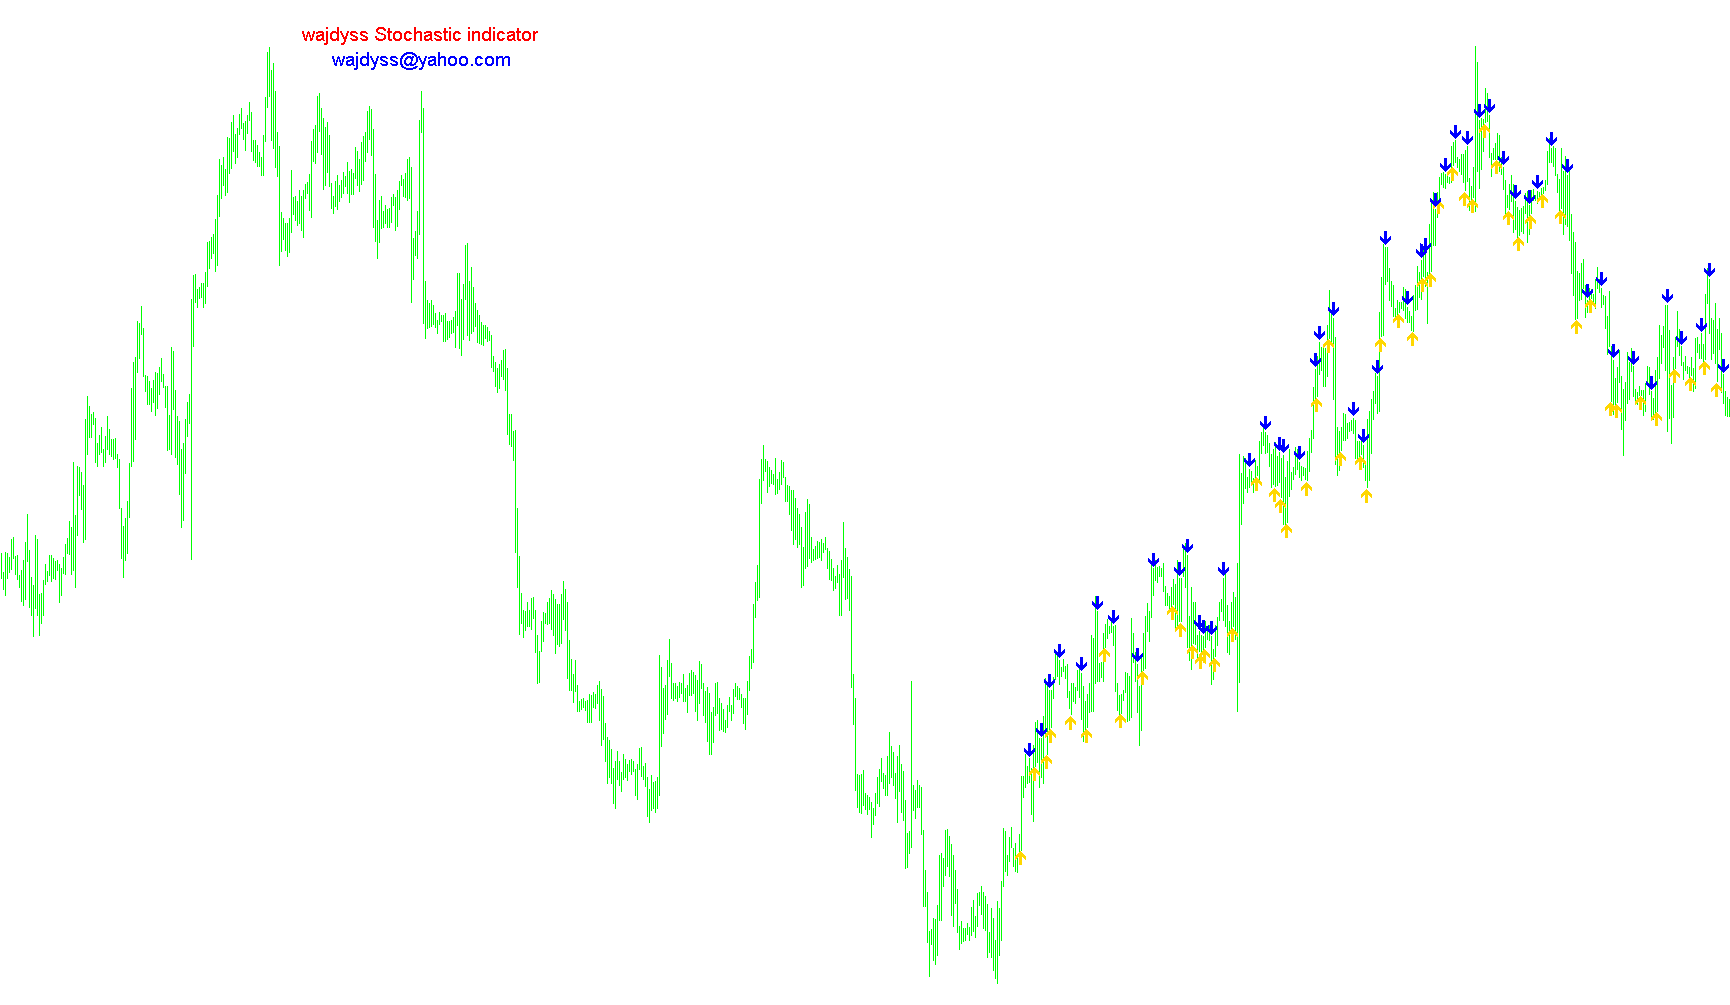
This indicator identifies trend reversal points by detecting bullish and bearish crossovers between fast and slow stochastic oscillators while calculating historical signal reliability ratios.

Indicator

wajdyss_T3_indicator_v3

wajdyss_V_Lines_indicator_v1
Indicator

wajdyss_V_Lines_indicator_v1

This indicator identifies and visualizes specific time-based price action nodes by plotting histogram markers at user-defined hourly and minute coordinates.

Waterfall [i]
Indicator

Waterfall [i]

Identifies potential structural pivot points by detecting local price peaks that align with a 50-period maximum high threshold.

Waterfall [i]_v1
Indicator

Waterfall [i]_v1

Identifies significant local price ceilings by pinpointing the highest historical extremes within a fifty-bar rolling window.

WATR
Indicator

WATR

iATR

This indicator identifies structural market shifts by dynamically projecting price boundaries using Average True Range volatility and filtering out counter-trend bar anomalies.

WCCI
Indicator

WCCI

iCCI

This indicator identifies trend momentum by calculating the divergence between a fast and a slow Commodity Channel Index (CCI) to generate a visual histogram of price velocity.

WcciChart
Indicator

WcciChart

iCCI

This indicator analyzes price momentum by calculating dual Commodity Channel Index values and using a multi-bar lookback average to identify dominant directional trends via histogram overlays.

WcciChart_v1
Indicator

WcciChart_v1

iCCI

This indicator analyzes price momentum by calculating fast and slow Commodity Channel Index values to visualize directional bias through histogram overlays.

WcciChart_v2
Indicator

WcciChart_v2

iCCI

This indicator utilizes dual Commodity Channel Index (CCI) periods to identify trend directionality and momentum shifts through multi-bar histogram validation.

WcciChart_v3
Indicator

WcciChart_v3

iCCI

This indicator synchronizes dual Commodity Channel Index (CCI) oscillators with a multi-bar signal histogram to visualize momentum shifts and trend strength transitions.

WcciChart_v4
Indicator

WcciChart_v4

iCCI

This indicator identifies momentum shifts and directional bias by overlaying fast and slow Commodity Channel Index (CCI) values alongside a histogram that highlights dominant trend segments.

WcciPaterns Sep
Indicator

WcciPaterns Sep

iCCI

This indicator synthesizes complex Commodity Channel Index (CCI) behaviors into eight distinct signals, providing a comprehensive toolkit for trend following, counter-trend reversals, and multi-layered exit strategies based on price-momentum divergence.

WcciPaterns Sep_v1
Indicator

WcciPaterns Sep_v1

iCCI

A multi-faceted technical indicator that identifies trend-following and counter-trend signals using a complex suite of CCI-based patterns including Zero-Line Rejects, Trend Line Breaks, Reverse Divergences, and Extreme Hook detection.

WcciPaterns Sep_v2
Indicator

WcciPaterns Sep_v2

iCCI

A comprehensive technical indicator that identifies diverse trend-following and counter-trend market dynamics using advanced Commodity Channel Index (CCI) geometric patterns.

WcciPaterns
Indicator

WcciPaterns

iCCI

This indicator utilizes multi-period Commodity Channel Index (CCI) oscillators to identify eight distinct structural patterns, including trend-following rejects and counter-trend reversals based on price-action geometry and volatility extremes.

wccipattern
Indicator

wccipattern

iCCI

This indicator identifies diverse trend-following and counter-trend opportunities by analyzing complex price-action geometries, such as Zero-line Rejections, Trend Line Breaks, and extreme reversal hooks, derived from dual-period Commodity Channel Index fluctuations.

WCCIPatternLabels
Indicator

WCCIPatternLabels

This indicator generates a customizable visual reference table in a separate sub-window to define specific trade setups and trend behaviors associated with Woodies CCI methodologies.

WcciPatterns
Indicator

WcciPatterns

iCCI

A comprehensive technical indicator that identifies diverse trend-following and counter-trend entry signals, including zero-line rejects, trend line breaks, and extreme momentum hook reversals based on smoothed Commodity Channel Index fluctuations.