Volatility Pivot
Download script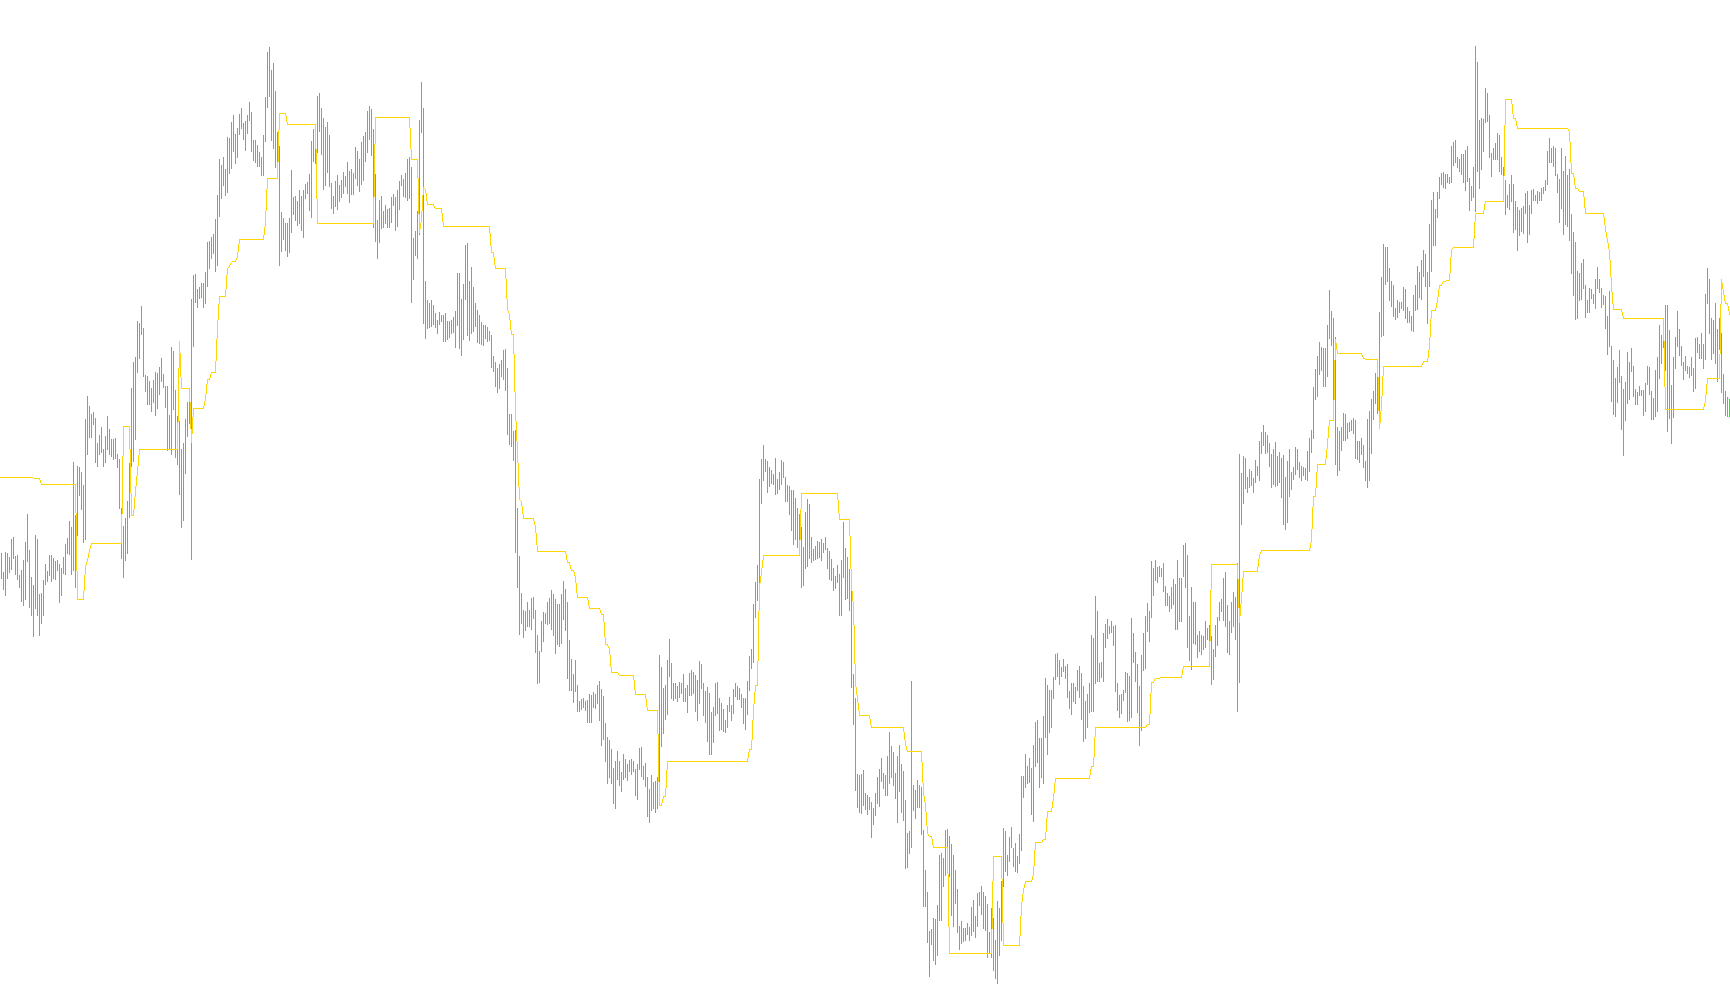
This tool is designed to dynamically track and visualize price behavior on a trading chart by identifying specific "turning points" based on market volatility. Instead of using static numbers, the script adapts to the current atmosphere of the market—expanding its range when the market is moving aggressively and tightening during quieter periods.
How the Logic Works
1. Measuring Market Volatility The core of this tool relies on a "volatility base." It constantly monitors the average range of price movements over a specific period. By calculating how much the price typically swings, the script establishes a baseline for what constitutes a "normal" move versus an unusual breakout or retracement.
2. Dynamic Threshold Calculation Depending on your settings, the script calculates a "distance" from the current price to determine where the next significant support or resistance level might lie. It does this in two ways:
- Adaptive Mode: It takes the average volatility and multiplies it by a specific factor. This means if the market becomes highly erratic, the tool automatically adjusts its boundaries wider.
- Fixed Mode: It uses a predetermined price distance regardless of market conditions.
3. Pivot Point Tracking The script tracks the relationship between the current closing price and the previous boundary level. Its primary goal is to identify when the price "breaks" out of its current trend:
- Trend Following: If the price is moving consistently in one direction and stays above or below a certain level, the script attempts to trail that level along with the price.
- Breakout Detection: When the price moves significantly beyond the previous level (exceeding the volatility threshold), the script "snaps" to a new position. It effectively resets the boundary to create a new floor or ceiling based on the most recent price action.
Summary for Traders
Essentially, this indicator acts as a smart "trailing" line. It doesn't just follow the price blindly; it waits for the market to prove it has enough momentum to break out of its current range. By doing so, it helps traders visualize where the market might find new support or resistance based on how much "room" the price has moved relative to recent volatility.
//+------------------------------------------------------------------+
//|                                             Volatility.Pivot.mq4 |
//+------------------------------------------------------------------+
#property copyright "thanks to S.B.T. (Japan)"
#property link      "http://sufx.core.t3-ism.net/" //<<< convert this from VT, thanks mate !!!

#property indicator_chart_window
#property indicator_buffers 1
#property indicator_color1 DarkSeaGreen

//---- input parameters
extern double     atr_range  = 100;
extern double     ima_range  = 10;
extern double     atr_factor = 3;
extern int        Mode       = 0;
extern double     DeltaPrice = 30;


//---- buffers
double TrStop[];
double ATR[];


int init()
  {

   IndicatorBuffers(2);
   SetIndexBuffer(0, TrStop); SetIndexStyle(0, DRAW_LINE,STYLE_SOLID,1);
   SetIndexBuffer(1, ATR);    SetIndexLabel(1,"range base");

   string short_name = "!! RisenbergVolatilityCapture";
   IndicatorShortName(short_name);

   return(0);
  }

int deinit() { return(0);}

int start()
  {
   double DeltaStop;
   int counted_bars=IndicatorCounted();
   int i,limit;

   if(counted_bars<0) return(-1);
   if(counted_bars>0) counted_bars--;
   limit=MathMin(Bars-counted_bars,Bars-1);

   for(i = limit; i >=0; i--) ATR[i] = iATR(NULL,0,atr_range,i);
   for(i = limit; i >=0; i--)
   {
   if (Mode == 0) {
   DeltaStop = iMAOnArray(ATR,0,ima_range,0,MODE_EMA,i) * atr_factor;
   } else {
   DeltaStop = DeltaPrice*Point;
   }
   if (Close[i] == TrStop[i + 1]) {
   TrStop[i] = TrStop[i + 1];
   } else {
   if (Close[i+1]<TrStop[i+1] && Close[i]<TrStop[i+1]) {
   TrStop[i] = MathMin(TrStop[i + 1], Close[i] + DeltaStop);
   } else {
   if (Close[i+1]>TrStop[i+1] && Close[i]>TrStop[i+1]) {
   TrStop[i] = MathMax(TrStop[i+1], Close[i] - DeltaStop);
   } else {
   if (Close[i] > TrStop[i+1]) TrStop[i] = Close[i] - DeltaStop; else TrStop[i] = Close[i] + DeltaStop;
   }
  }
 }
}

   return(0);
  }
//+------------------------------------------------------------------+
Comments