VininI ConstTickPriceM
Download script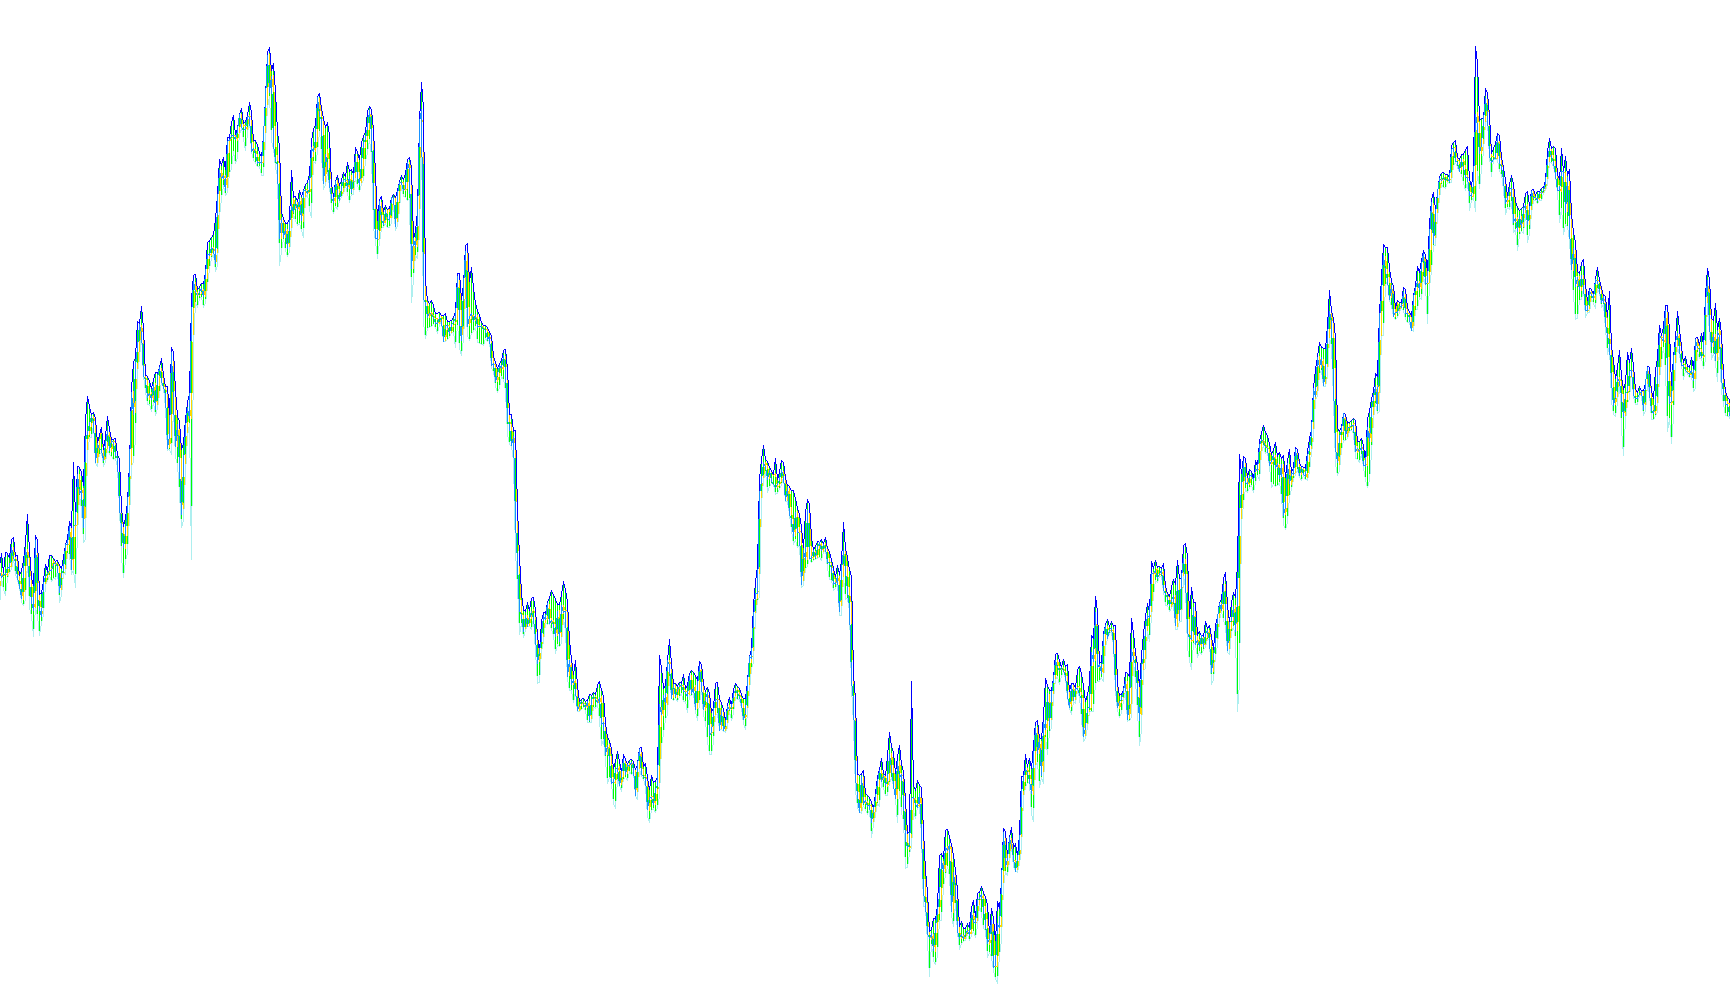
This script is designed to provide a more granular view of market activity by tracking "ticks"—the smallest units of price movement—and organizing them into meaningful segments based on specific volume thresholds and timeframes.
Instead of looking at standard candles which represent fixed periods of time, this logic focuses on the intensity of activity. Here is a breakdown of how the system processes this information:
Core Functionality
The primary goal of the script is to monitor the accumulation of trading volume. It works by counting how many individual price changes (ticks) occur between specific events. When a pre-defined limit of ticks is reached, the script identifies a "significant" point in the data. This allows traders to visualize where high-frequency activity is concentrated.
Key Logic Components
-
Volume Accumulation & Tick Counting: The script constantly tracks the rolling sum of volume and the number of price updates. It compares current activity against a user-defined threshold (
CountTick). Once that threshold is met, the script "resets" its count and captures the specific price data (the high, low, open, and close) at that exact moment of peak activity. -
Dynamic Bar Management: The logic includes a sophisticated mechanism to handle how these segments are displayed on your chart. It calculates the "remainder" of volume between points. If the activity is moving toward a threshold, it intelligently decides whether to finalize the current data point or carry the data over to the next sequence. This ensures that the visual representation remains continuous and doesn't leave gaps in the price history.
-
Time-Based Awareness: Beyond just counting volume, the script is aware of the calendar. It detects when a new week begins. When it identifies a day change at the start of a new week, it automatically resets its internal counters. This prevents data from one week from bleeding into the next, ensuring that the analysis remains clean and chronologically accurate.
How it behaves on your chart
While standard charts show you what happened over a minute or an hour, this logic filters the "noise" to show you exactly where the most significant price action took place relative to volume. It effectively paints a picture of market pressure by identifying clusters of activity, helping you see where the most transactions are occurring rather than just where the time has elapsed.
//+------------------------------------------------------------------+
//|                                                   Const Tick.mq4 |
//|                      Copyright © 2008, Victor Nicolaev aka Vinin |
//|                                            e-mail: vinin@mail.ru |
//+------------------------------------------------------------------+
#property copyright "Copyright © 2008, Victor Nicolaev aka Vinin"
#property link      "e-mail: vinin@mail.ru"


#property indicator_chart_window
#property indicator_buffers 5
#property indicator_color1 White
#property indicator_color2 Red
#property indicator_color3 Red
#property indicator_color4 White
#property indicator_color5 Yellow

extern int CountTick=100;

//---- buffers
double _Open[];
double _High[];
double _Low[];
double _Close[];
double _CountBar[];
double _Volume[];

//+------------------------------------------------------------------+
//| Custom indicator initialization function                         |
//+------------------------------------------------------------------+
int init() {
//---- drawing settings
   int i;
   IndicatorBuffers(6);
   for (i=0;i<4;i++) SetIndexStyle(i,DRAW_LINE);SetIndexStyle(4,DRAW_NONE);
   if (!SetIndexBuffer(0,_Open)) Print("Íåâîçìîæíî èíèöèàëèçèðîâàòü ìàññèâ Open");
   if (!SetIndexBuffer(1,_High)) Print("Íåâîçìîæíî èíèöèàëèçèðîâàòü ìàññèâ High");
   if (!SetIndexBuffer(2,_Low)) Print("Íåâîçìîæíî èíèöèàëèçèðîâàòü ìàññèâ Low");
   if (!SetIndexBuffer(3,_Close)) Print("Íåâîçìîæíî èíèöèàëèçèðîâàòü ìàññèâ Close");
   if (!SetIndexBuffer(4,_CountBar)) Print("Íåâîçìîæíî èíèöèàëèçèðîâàòü ìàññèâ CountBar");
   if (!SetIndexBuffer(5,_Volume)) Print("Íåâîçìîæíî èíèöèàëèçèðîâàòü ìàññèâ Volume");

   SetIndexLabel(0,"Open");
   SetIndexLabel(1,"High");
   SetIndexLabel(2,"Low");
   SetIndexLabel(3,"Close");


   return(0); }//int init()
//+------------------------------------------------------------------+
int start() {
   int limit;
   int counted_bars=IndicatorCounted();
   int i, pos;
   if(counted_bars<0) return(-1);
   if(counted_bars>0) counted_bars--;
   limit=Bars-counted_bars;
   for (i = limit;i>=0;i--){
      _Volume[i]=_Volume[i+1]+Volume[i];
      _Close[i]=Close[i];
      _Open[i]=_Open[i+1];
      _High[i]=MathMax(High[i],_High[i+1]);
      _Low[i]=MathMin(Low[i],_Low[i+1]);
      _CountBar[i]=_CountBar[i+1]+1;
      CheckWeek(i);
      CheckBar(i);
      CheckTick(i);
   }
   return(0);
}// int start()

bool CheckTick(int pos){
   if (Volume[pos]>=CountTick) {
      _CountBar[pos]   = 0;
      _Open[pos]   = Open[pos];
      _High[pos]   = High[pos];
      _Low[pos]    = Low[pos];
      return(true);
   }
   return(false);
}

bool CheckBar(int pos){
   int tmp0=Ostatok(_Volume[pos+0],CountTick);
   int tmp1=Ostatok(_Volume[pos+1],CountTick);
   if (tmp0<tmp1) {
      if (tmp0>CountTick-tmp1) {
         _CountBar[pos]   = 0;
         _Open[pos]   = Open[pos];
         _High[pos]   = High[pos];
         _Low[pos]    = Low[pos];
      }
      else {
         _CountBar[pos+1]   = 0;
         _Open[pos+1]   = Open[pos+1];
         _High[pos+1]   = High[pos+1];
         _Low[pos+1]    = Low[pos+1];
         _CountBar[pos]   = _CountBar[pos+1]+1;
         _Open[pos]   = _Open[pos+1];
         _High[pos]   = MathMax(High[pos],_High[pos+1]);
         _Low[pos]    = MathMin(Low[pos],_Low[pos+1]);
      }
      return(true);
   }
   return(false);
}

bool CheckWeek(int pos){
   if (TimeDayOfWeek(Time[pos+1])>TimeDayOfWeek(Time[pos+0])) {
      _Volume[pos] = Volume[pos];
      _CountBar[pos]   = 0;
      _Open[pos]   = Open[pos];
      _High[pos]   = High[pos];
      _Low[pos]    = Low[pos];
      return(true);
   }
   return(false);
}

int Ostatok(double Value1, double Value2){
   double tmp=NormalizeDouble(Value1/Value2,0);
   if (tmp*Value2>Value1) tmp--;
   return(Value1-tmp*Value2);
}

void RedRaw(int pos) {


}
Comments