VininI_Trend_WPR
Download script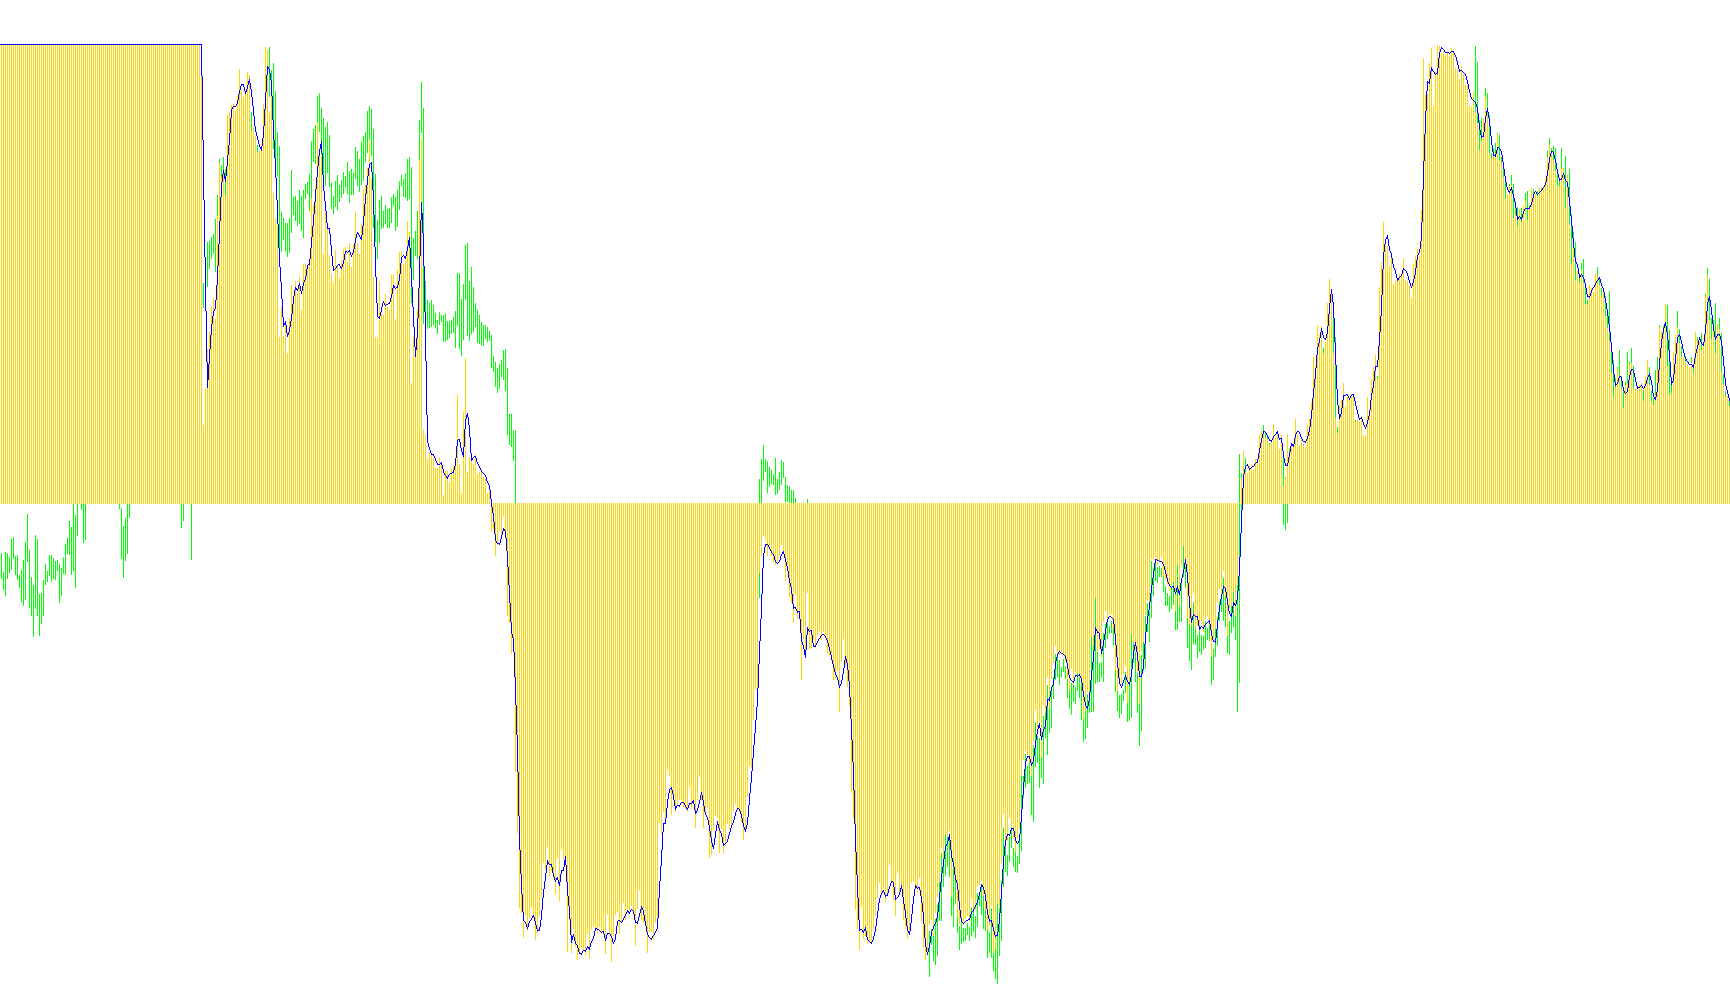
This tool is designed to help traders identify market trends by smoothing out price fluctuations and highlighting the underlying momentum. Instead of looking at volatile, minute-to-minute price changes, it uses a multi-layered mathematical approach to filter out "noise" and provide a clearer picture of where the market is heading.
How the Logic Works
The script processes data through three primary stages to create a cleaner visual signal:
1. Data Collection and Normalization The tool begins by gathering a specific series of "Williams Percent Range" (WPR) values. The WPR is a standard momentum indicator that measures where the current price is relative to its high and low range over a set period. Because raw WPR values can sometimes be difficult to read, the script automatically adjusts these numbers to fit into a more standardized scale, making it easier to interpret the strength of the movement.
2. Averaging and Variance Smoothing Rather than simply plotting the raw data, the tool performs two types of calculations to stabilize the indicator:
- Mean Calculation: It takes a large group of historical data points and calculates their average. This helps identify the "center" of the current price action.
- Standard Deviation: The script measures how much the prices are swinging away from that average (the variance). By calculating this, the tool can better understand the intensity of the market—distinguishing between a steady trend and erratic, unstable movements.
3. Signal Generation Finally, the tool applies a "Moving Average" to the processed data. This acts as a final polish, smoothing out any remaining jagged edges in the visual output. The result is a two-part visual aid:
- The Main Trend: A histogram that shows the smoothed momentum of the market.
- The Signal Line: A secondary line that follows the main trend, helping traders see if the current momentum is accelerating, slowing down, or potentially reversing.
Summary for the User
In simple terms, this script acts like a high-quality filter for your charts. It looks at past price extremes, averages them out to find the "true" path of the market, and then smooths that path into a readable format. This allows you to see the broader trend more clearly without being distracted by minor, insignificant price jumps.
//+------------------------------------------------------------------+
//|                                             VininI_Trend_WPR.mq4 |
//|                                  Ñopyright 2008. Victor Nicolaev |
//|                                                    vinin@mail.ru |
//+------------------------------------------------------------------+
#property copyright "Ñopyright 2008. Victor Nicolaev"
#property link      "vinin@mail.ru"


#property indicator_separate_window
#property indicator_buffers 2
#property indicator_color1 Yellow
#property indicator_color2 Red
#property indicator_level2  0


extern int MA_Trend=3;
extern int WPR_Start=10;
extern int WPR_Step=10;
extern int WPR_Count=50;
extern int Limit=1440;
//---- buffers
double WPR[];
double Signal[];
double tmp[];
//+------------------------------------------------------------------+
//| Custom indicator initialization function                         |
//+------------------------------------------------------------------+
int init() {
//---- drawing settings
   SetIndexStyle(0,DRAW_HISTOGRAM);
   SetIndexStyle(1,DRAW_LINE);

   SetIndexBuffer(0,WPR);
   SetIndexBuffer(1,Signal);
//   SetIndexBuffer(2,TrendUP);
//   SetIndexBuffer(3,TrendDN);

   ArrayResize(tmp,WPR_Count);
   return(0); }//int init()

//+------------------------------------------------------------------+
int start() {
   int limit1, limit2;
   int counted_bars=IndicatorCounted();
   int i,j;
   double sum=0;
   if(counted_bars<0) return(-1);
   if(counted_bars>0) counted_bars--;
   limit1=Bars-counted_bars;

   if (Limit>0) limit1=MathMin(Limit,limit1);
   limit2=limit1;
   if (IndicatorCounted()==0) limit2=limit1-MA_Trend;


   for (i = limit1;i>=0;i--){
      sum=0;
      for (j=0;j<WPR_Count;j++) {
         tmp[j]=(iWPR(NULL,0,WPR_Start+j*WPR_Step,i)+50.0)*2.0;
         sum=tmp[j];
      }
      WPR[i]=sum/WPR_Count;
      sum=0;
      for (j=0;j<WPR_Count;j++) {
         sum+=MathPow(WPR[i]-tmp[j],2);
      }
      sum=MathSqrt(sum/WPR_Count);
   }

   for (i = limit2;i>=0;i--) Signal[i]=iMAOnArray(WPR,0,MA_Trend,0,MODE_SMA,i);


   return(0);
}
Comments