VininI_Trend_MA_WPR
Download script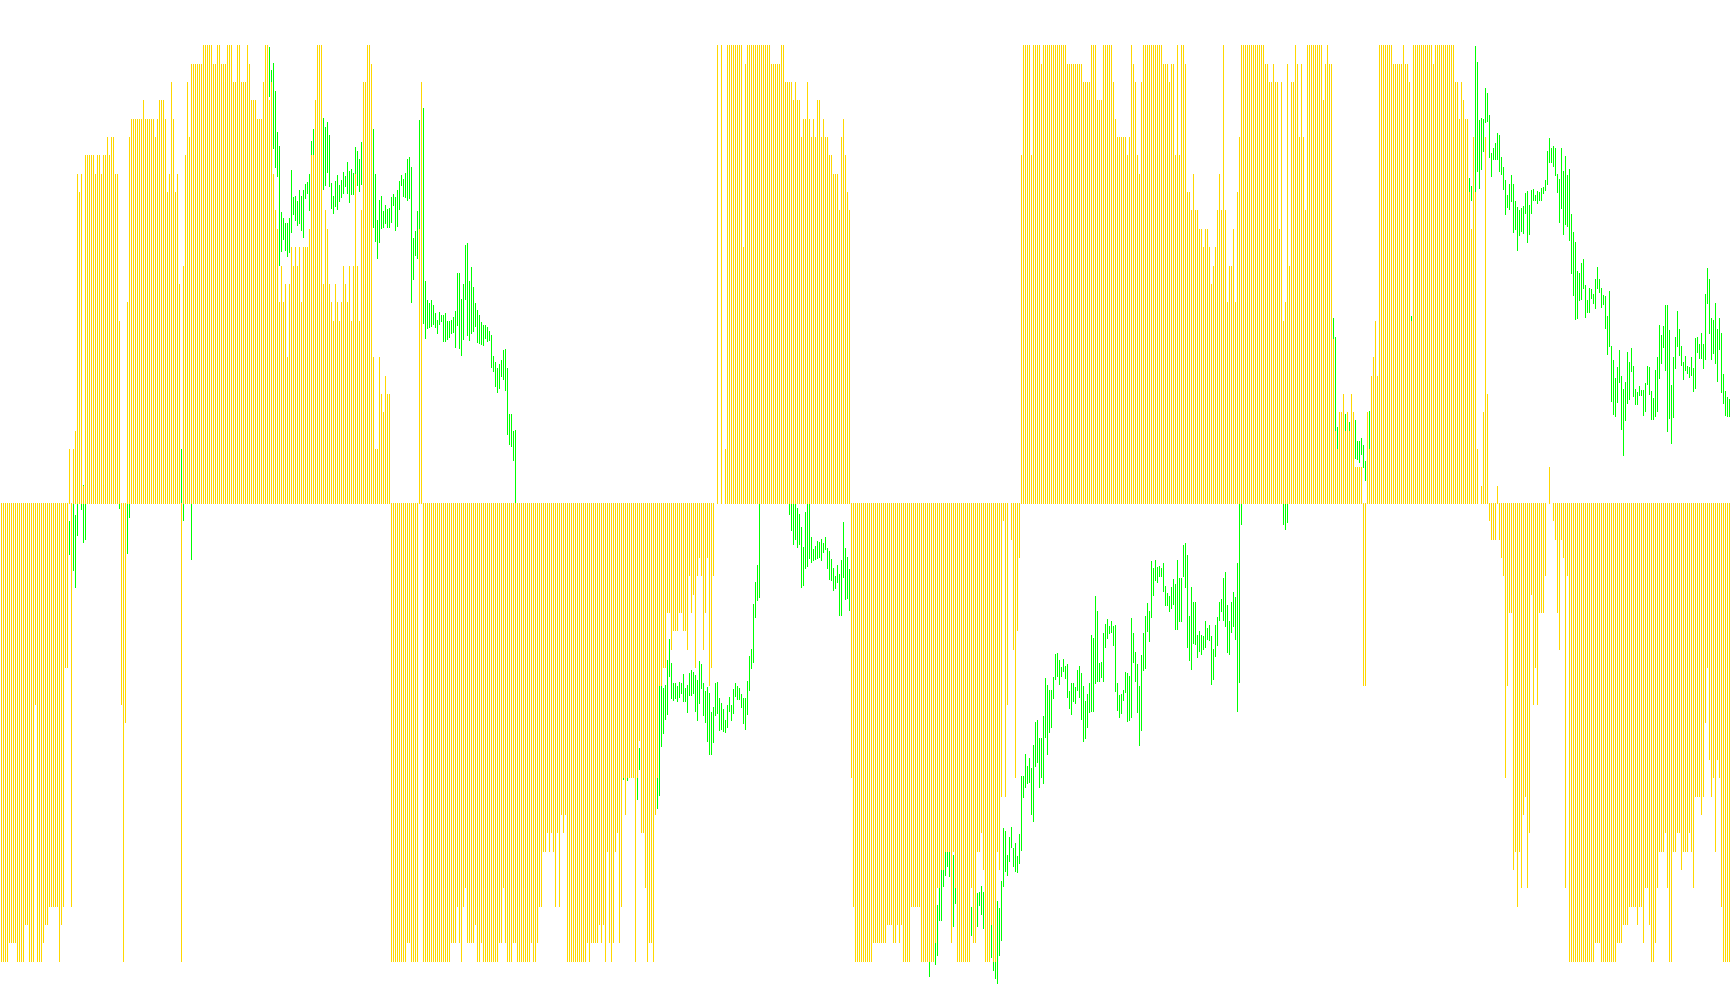
This technical tool is designed to provide traders with a clearer picture of market momentum and trend direction by filtering out common "market noise." It achieves this by processing three distinct layers of data in a sequence, moving from raw price fluctuations to a smoothed trend signal.
How the Logic Works
1. The Base Measurement (Williams Percent Range) The process begins by analyzing the Williams Percent Range (WPR). This is a standard market indicator that measures whether the current price is trading toward the top or the bottom of its recent range. Essentially, it tells the script how "stretched" the price is in either direction.
2. The Comparative Analysis (Momentum Scoring) Instead of looking at the WPR value alone, the script performs a sophisticated comparison. It looks back across a specific number of historical data points (defined by the user settings). For every point in this history, it checks if the current momentum is higher or lower than the average at that specific time.
- If the current momentum is stronger, it adds a point to a score.
- If it is weaker, it subtracts a point.
This creates a "Momentum Score"—a unique calculation that determines whether the current trend is genuinely gaining strength compared to its recent past, rather than just fluctuating randomly.
3. The Smoothing Layer (Trend Finalization) To ensure the final visual output isn't too jagged or reactive to tiny price flickers, the script applies one final smoothing pass. It takes the "Momentum Scores" generated in the previous step and calculates a Moving Average over them. This final result is what appears on your chart as a histogram.
Summary for the User
In simple terms, this tool doesn't just tell you where the price is; it tells you how much conviction is behind the current movement. By comparing current momentum against a wide window of historical data and then smoothing that result, it helps identify sustained trends while ignoring the minor "zig-zags" that can often lead to false signals in fast-moving markets.
//+------------------------------------------------------------------+
//|                                          VininI_Trend_MA_WPR.mq4 |
//|                                  Ñopyright 2008. Victor Nicolaev |
//|                                                    vinin@mail.ru |
//+------------------------------------------------------------------+
#property copyright "Ñopyright 2008. Victor Nicolaev"
#property link      "vinin@mail.ru"


#property indicator_separate_window
#property indicator_buffers 1
#property indicator_color1 Yellow
#property indicator_level1 0
#property indicator_maximum 1
#property indicator_minimum -1

extern int WPR_Period=100;
extern int Trend_MA_Period=3;

extern int MA_Start=10;
extern int MA_Step=10;
extern int MA_Count=50;
extern int MA_Mode=0;
extern int Limit=1440;
//---- buffers
double Buffer[];
double WPR[];
double Trend[];
//+------------------------------------------------------------------+
//| Custom indicator initialization function                         |
//+------------------------------------------------------------------+
int init() {
//---- drawing settings
   IndicatorBuffers(3);
   SetIndexStyle(0,DRAW_HISTOGRAM);
   SetIndexBuffer(0,Trend);
   SetIndexBuffer(1,WPR);
   SetIndexBuffer(0,Buffer);

   return(0); }//int init()

//+------------------------------------------------------------------+
int start() {
   int limit;
   int counted_bars=IndicatorCounted();
   int i,j;
   double sum=0;
   if(counted_bars<0) return(-1);
   if(counted_bars>0) counted_bars--;
   limit=Bars-counted_bars;
   if (Limit>0) limit=MathMin(Limit,limit);

   for (i = limit;i>=0;i--) WPR[i]=iWPR(NULL,0,WPR_Period,i);

   for (i = limit;i>=0;i--){
      sum=0;
      for (j=0;j<MA_Count;j++)
         if (WPR[i]>iMAOnArray(WPR,0,MA_Start+j*MA_Step,0,MA_Mode,i)) sum+=1; else sum-=1;
      Buffer[i]=sum/MA_Count;
   }

   for (i = limit;i>=0;i--)Trend[i]=iMAOnArray(Buffer,0,Trend_MA_Period,0,MA_Mode,i);


   return(0);
}
Comments