VininI_Trend
Download script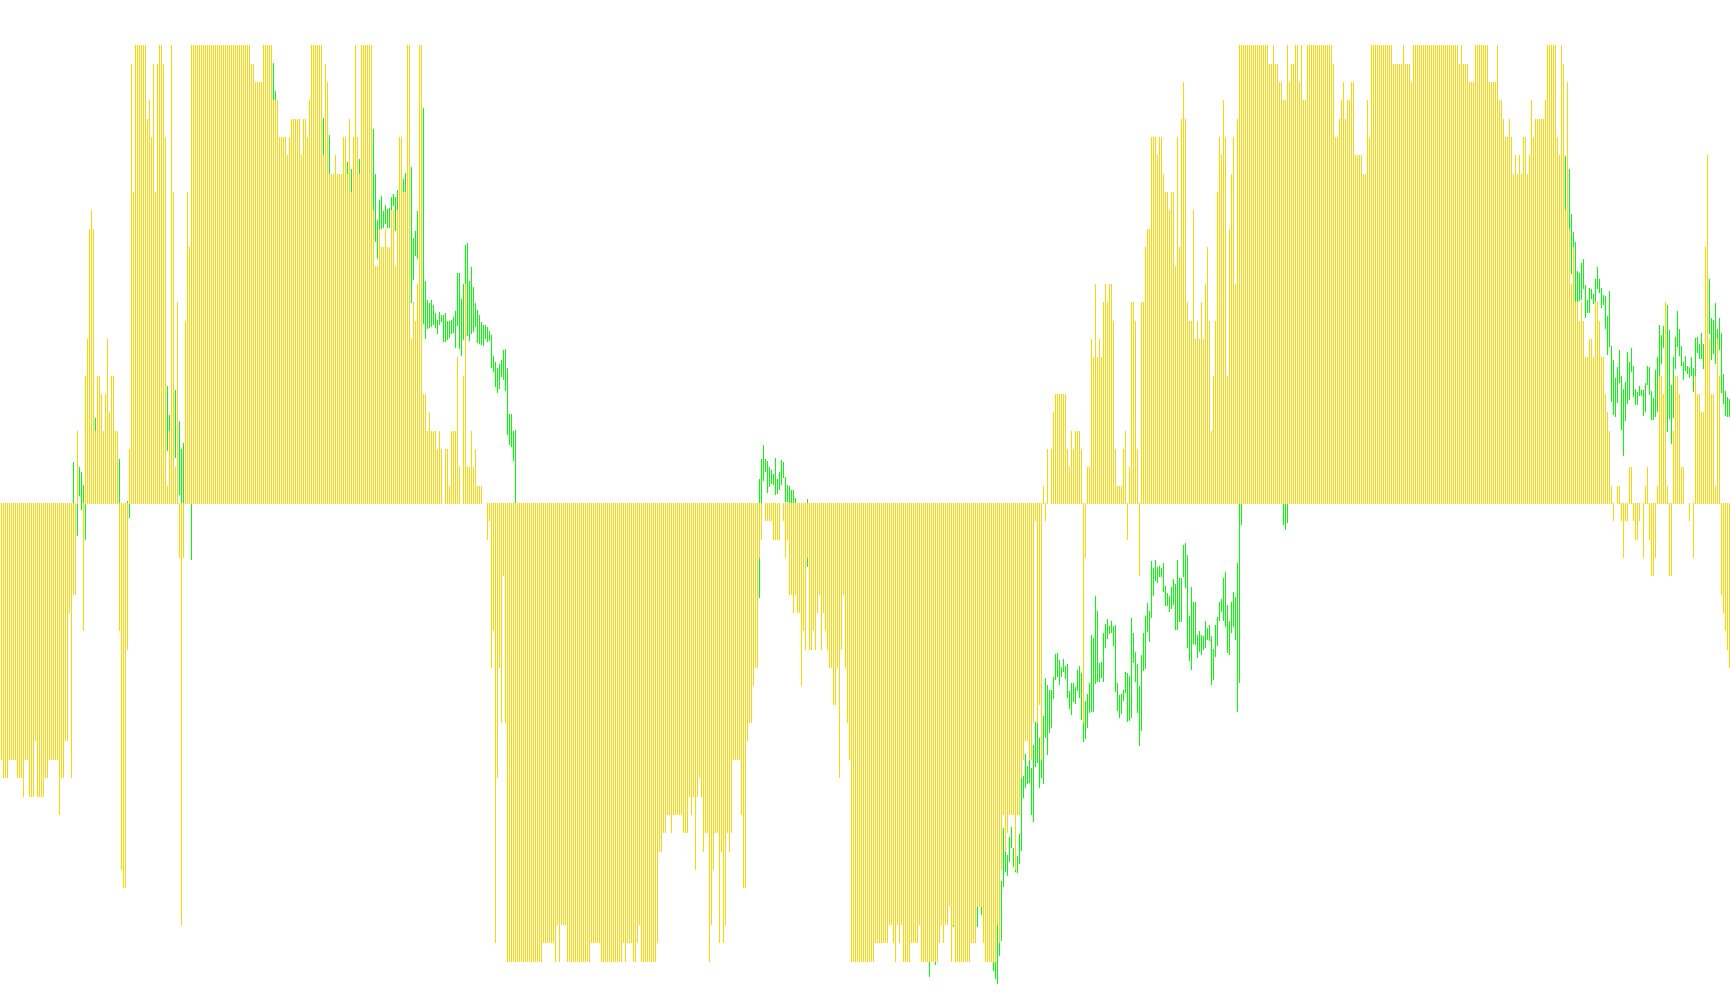
This tool is designed to provide a visual representation of market momentum and trend strength by analyzing the relationship between current prices and a series of Moving Averages. Instead of showing a simple price line, it creates a histogram in a separate window, allowing you to see whether the prevailing market sentiment is bullish or bearish based on historical data points.
How the Logic Works
The script operates by evaluating multiple Moving Averages simultaneously across different time scales. Here is the step-by-step breakdown of its internal logic:
1. Multi-Point Analysis Rather than looking at a single indicator, the tool calculates a collection of Moving Averages. It uses your defined starting point, the spacing between each average (the "Step"), and the total number of averages to be counted. This creates a wide net of data points that covers a significant range of recent price history.
2. Sentiment Scoring For every specific moment in time on the chart, the script performs a comparison:
- It checks if the current closing price is above or below each of the Moving Averages in its collection.
- If the price is above an average, it assigns a positive value (+1).
- If the price is below an average, it assigns a negative value (-1).
3. Trend Calculation The script then calculates the average sum of these values. This results in a single numerical score that represents the "strength" of the trend:
- A positive result indicates that the price is consistently trading above the majority of the Moving Averages, suggesting upward momentum.
- A negative result indicates the price is trading below most of the averages, suggesting downward momentum.
- A result near zero suggests a neutral state where the price is hovering around the average values.
4. Visual Representation This final score is plotted as a histogram on your screen. Because the results are averaged, the histogram provides a smoothed view of market direction. By observing how these bars move above or below the zero line, you can identify shifts in trend strength and potential reversals more clearly than by looking at raw price action alone.
//+------------------------------------------------------------------+
//|                                                 VininI_Trend.mq4 |
//|                                  Ñopyright 2008. Victor Nicolaev |
//|                                                    vinin@mail.ru |
//+------------------------------------------------------------------+
#property copyright "Ñopyright 2008. Victor Nicolaev"
#property link      "vinin@mail.ru"


#property indicator_separate_window
#property indicator_buffers 1
#property indicator_color1 Yellow
#property indicator_level1 0
#property indicator_maximum 1
#property indicator_minimum -1


extern int MA_Start=10;
extern int MA_Step=10;
extern int MA_Count=50;
extern int MA_Mode=0;
extern int Limit=1440;
//---- buffers
double Buffer[];

//+------------------------------------------------------------------+
//| Custom indicator initialization function                         |
//+------------------------------------------------------------------+
int init() {
//---- drawing settings
   SetIndexStyle(0,DRAW_HISTOGRAM);
   SetIndexBuffer(0,Buffer);

   return(0); }//int init()

//+------------------------------------------------------------------+
int start() {
   int limit;
   int counted_bars=IndicatorCounted();
   int i,j;
   double sum=0;
   if(counted_bars<0) return(-1);
   if(counted_bars>0) counted_bars--;
   limit=Bars-counted_bars;
   if (Limit>0) limit=MathMin(Limit,limit);
   for (i = limit;i>=0;i--){
      sum=0;
      for (j=0;j<MA_Count;j++) if (Close[i]>iMA(NULL,0,MA_Start+j*MA_Step,0,MA_Mode,PRICE_CLOSE,i)) sum+=1; else sum-=1;
      Buffer[i]=sum/MA_Count;
   }


   return(0);
}
Comments