Volatility
Download script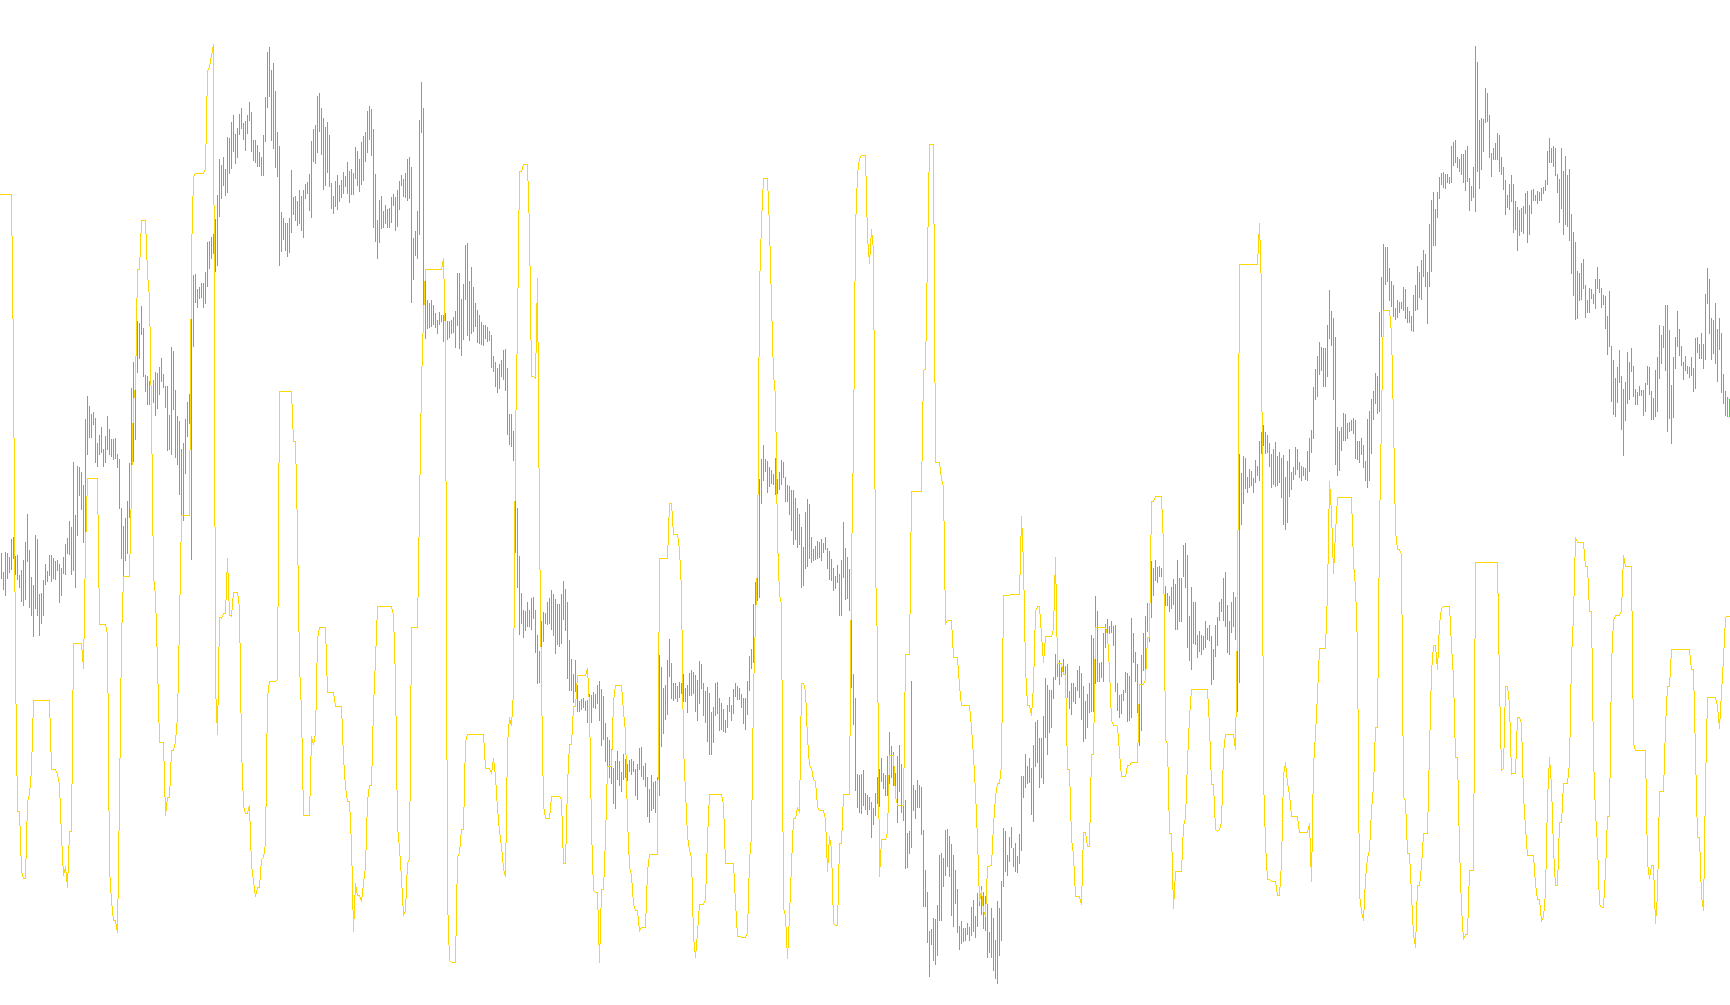
This tool is designed to provide traders with a visual representation of market volatility over a specific period. Instead of showing the price of an asset, it focuses on the intensity of movement, helping users identify how "stretched" or active the market is currently.
How it Works
The logic operates by constantly scanning a fixed number of recent price bars (which you can customize in the settings). For every period it analyzes, the tool performs three main steps:
- Identifying Extremes: It looks back over the user-defined timeframe to find the highest price point reached and the lowest price point dropped.
- Measuring the Range: It calculates the total distance between that high and low point. This represents the "swing" of the market during that window.
- Normalization: To make the data easier to read as a smooth line, it divides that price range by the smallest possible price movement (the point) and adjusts it based on the number of bars being measured.
What it Shows You
The result is displayed in a separate window at the bottom of your trading chart as a red line.
- High Peaks: When the line rises, it indicates that the market is experiencing large price swings (high volatility). This suggests aggressive buying or selling pressure.
- Low Valleys: When the line drops, it indicates that the market is consolidating or moving in a very tight range (low volatility). This often suggests a period of calm or indecision before a potential breakout.
By monitoring this indicator, you can better understand the "heartbeat" of the market—distinguishing between periods of extreme excitement and periods of steady, quiet movement.
Miscellaneous
12
Views
0
Downloads
0
Favorites
Volatility
//+------------------------------------------------------------------+
//|                                                           Vo.mq4 |
//|                                                           Krokus |
//|                                                                  |
//+------------------------------------------------------------------+
#property copyright "Krokus, Modyfed by Trofimov"
#property link      ""
//----
#property indicator_separate_window
#property indicator_buffers 1
#property indicator_color1 Red
//----
extern int       N=12; // ïåðèîä êàíàëà
//---- buffers
double ExtMapBuffer1[];
//+------------------------------------------------------------------+
//| Custom indicator initialization function                         |
//+------------------------------------------------------------------+
int init()
  {
//---- indicators
   IndicatorShortName("Volatility("+N+") ");
   SetIndexStyle(0,DRAW_LINE);
   SetIndexBuffer(0,ExtMapBuffer1);
   IndicatorDigits(0);
//----
   return(0);
  }
//+------------------------------------------------------------------+
//| Custom indicator deinitialization function                       |
//+------------------------------------------------------------------+
int deinit()
  {
//----
//----
   return(0);
  }
//+------------------------------------------------------------------+
//| Custom indicator iteration function                              |
//+------------------------------------------------------------------+
int start()
  {
   int    counted_bars=IndicatorCounted();
   int limit;
   double upPrice,downPrice;
//----
   if (counted_bars==0) limit=Bars-N;
   if (counted_bars>=0) limit=Bars-counted_bars;
   limit--;
   for(int i=limit;i>=0;i--)
     {
      upPrice=High[iHighest(Symbol(),0,MODE_HIGH,N,i)];//ìàêñèìóì çà N áàðîâ
      downPrice=Low[iLowest(Symbol(),0,MODE_LOW,N,i)]; //ìèíèìóì çà N áàðîâ
      ExtMapBuffer1[i]=(upPrice-downPrice)/Point/N;

     }
//----
   return(0);
  }
//+------------------------------------------------------------------+
Comments