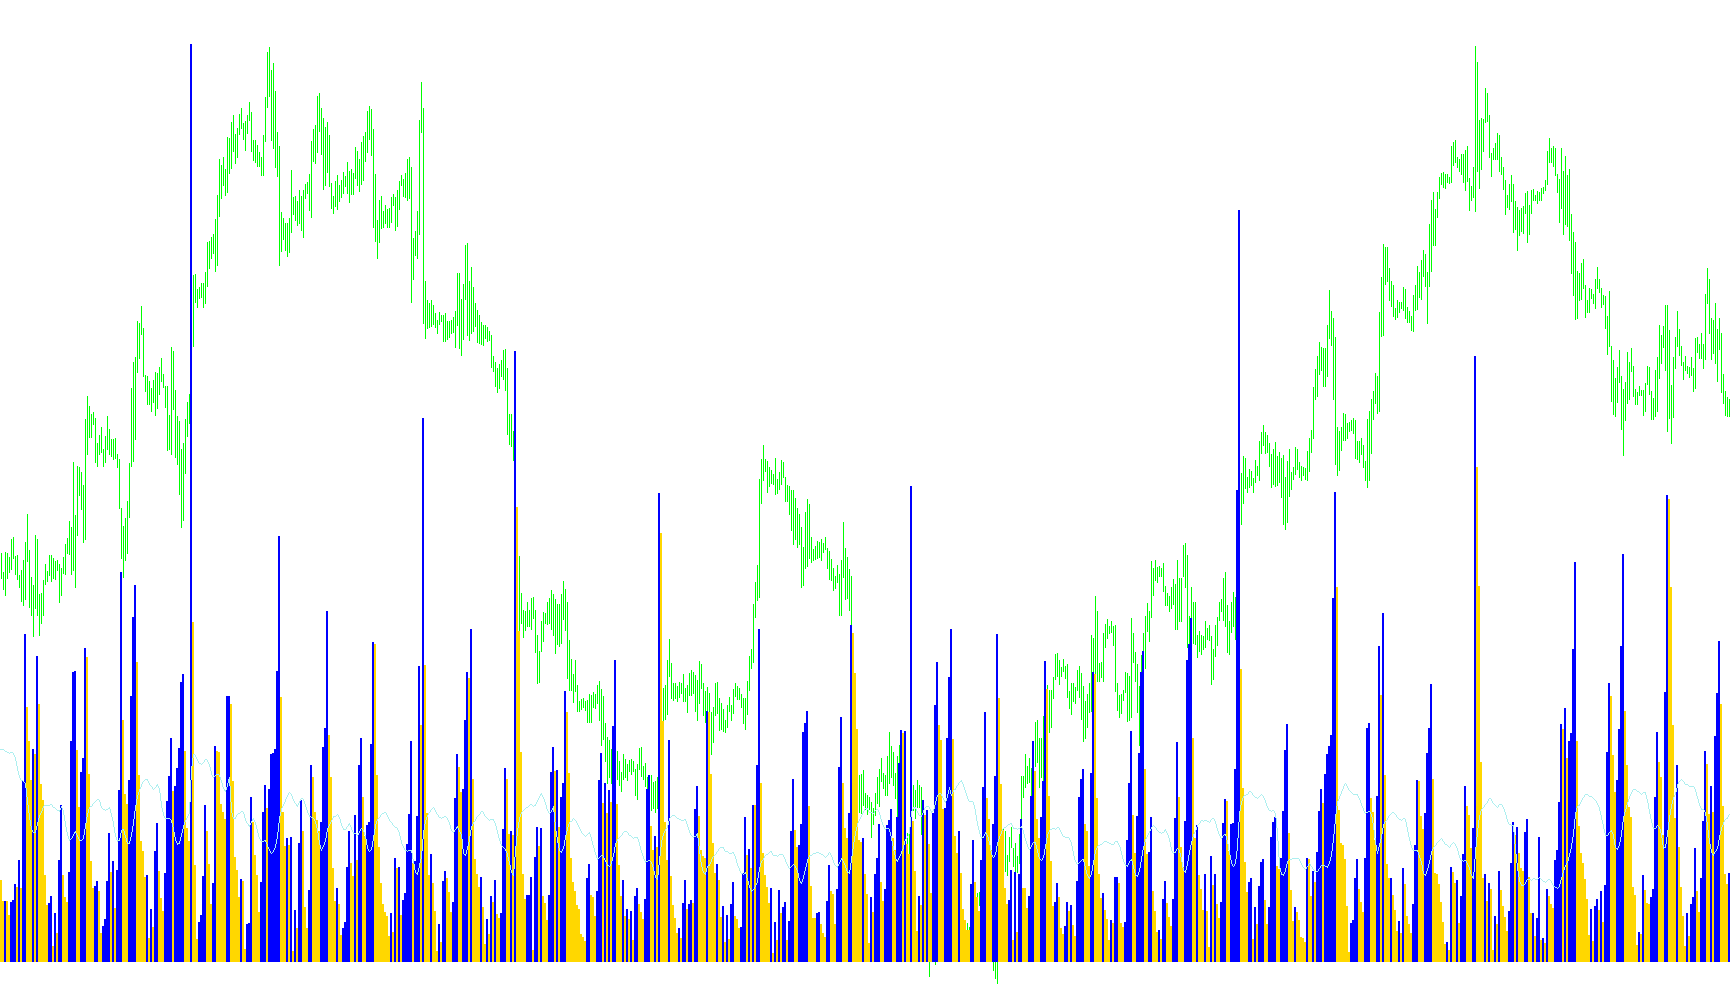
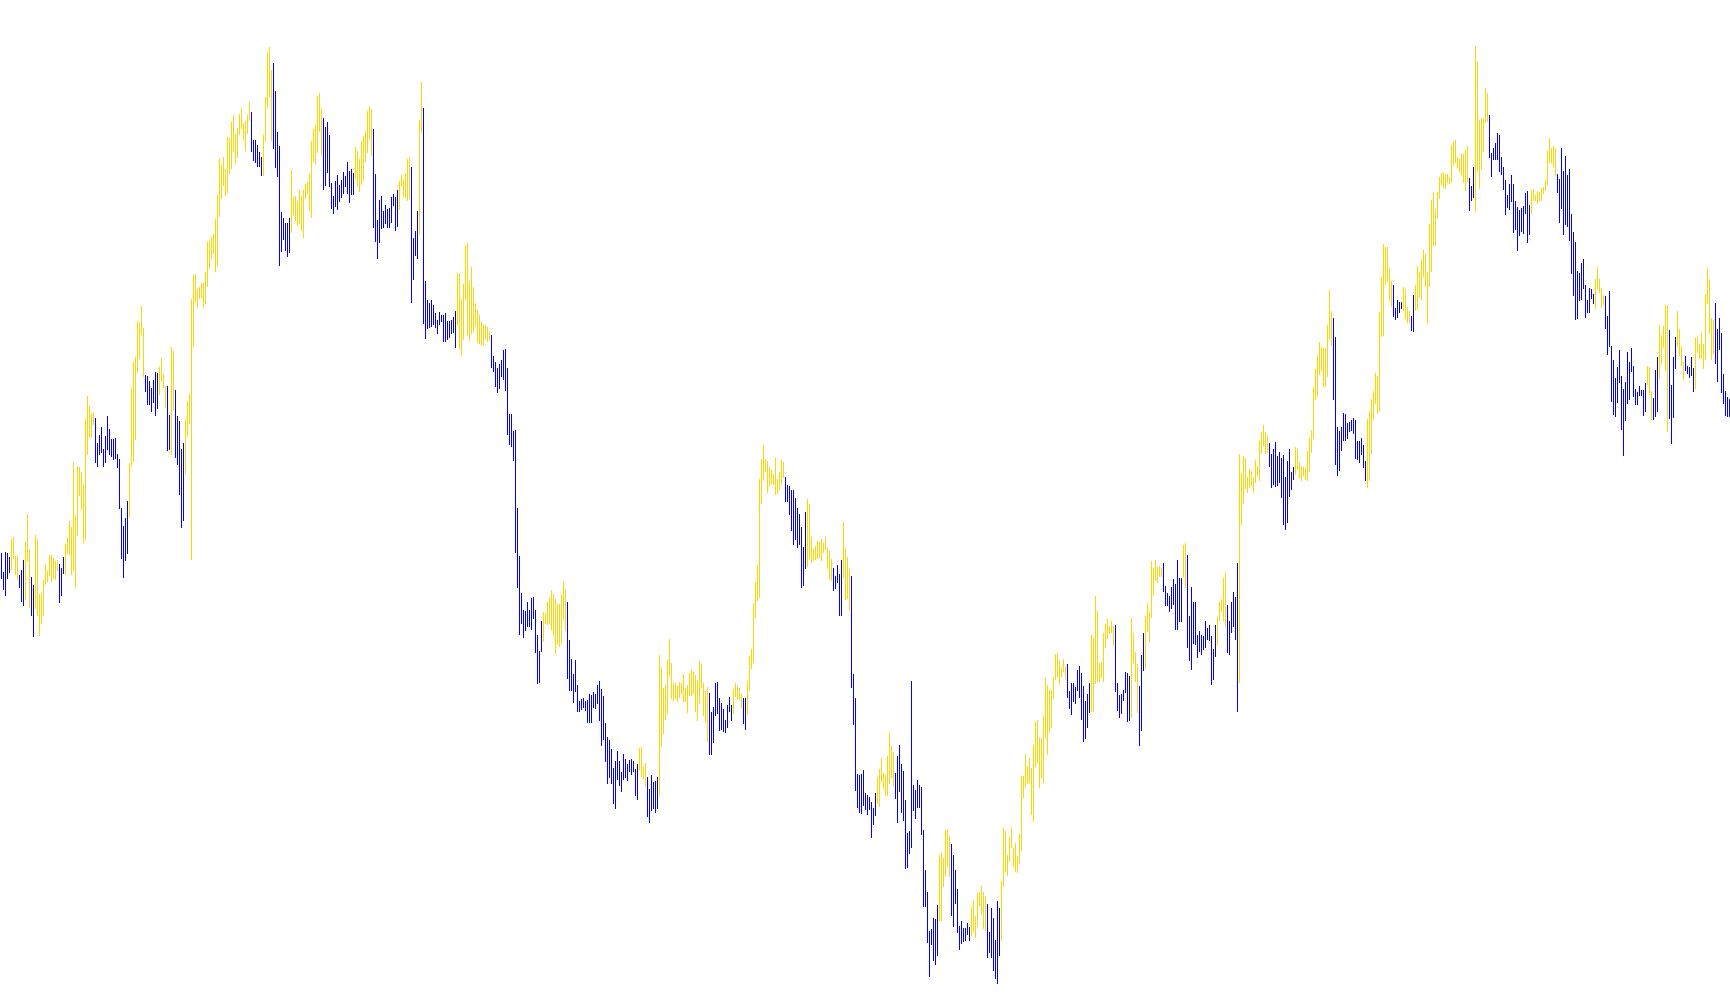
Volatility.Pivot
Indicator

Volatility.Pivot

iATRiMAOnArray

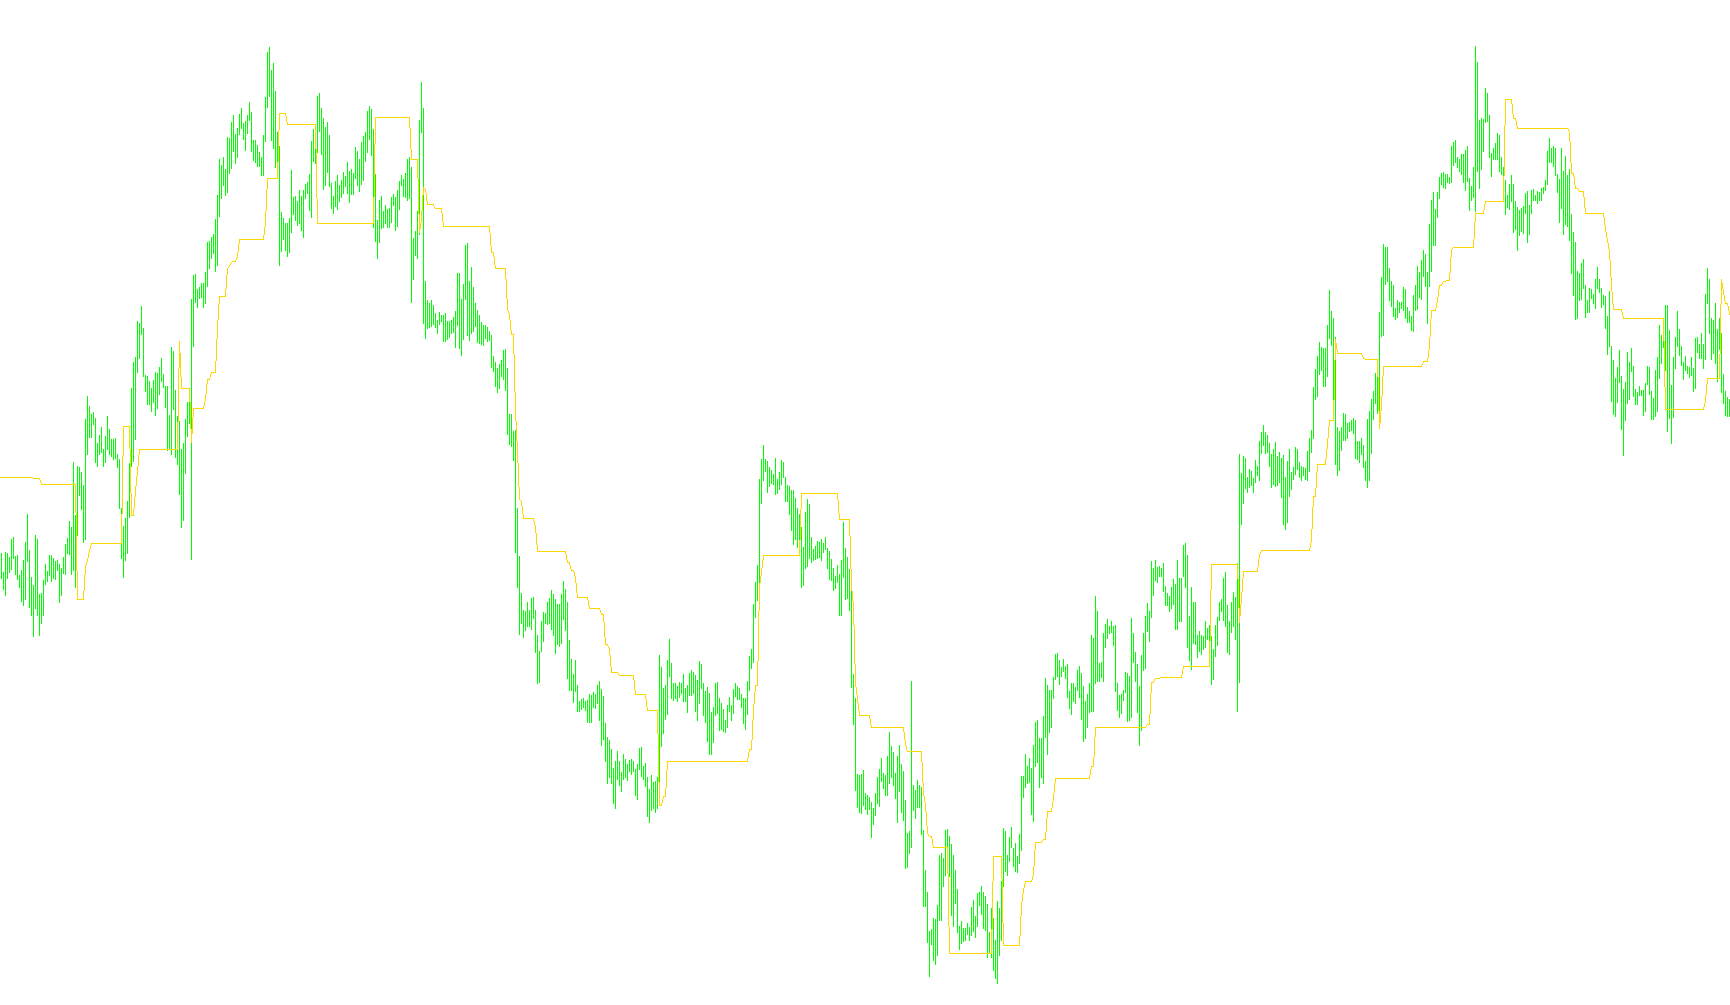
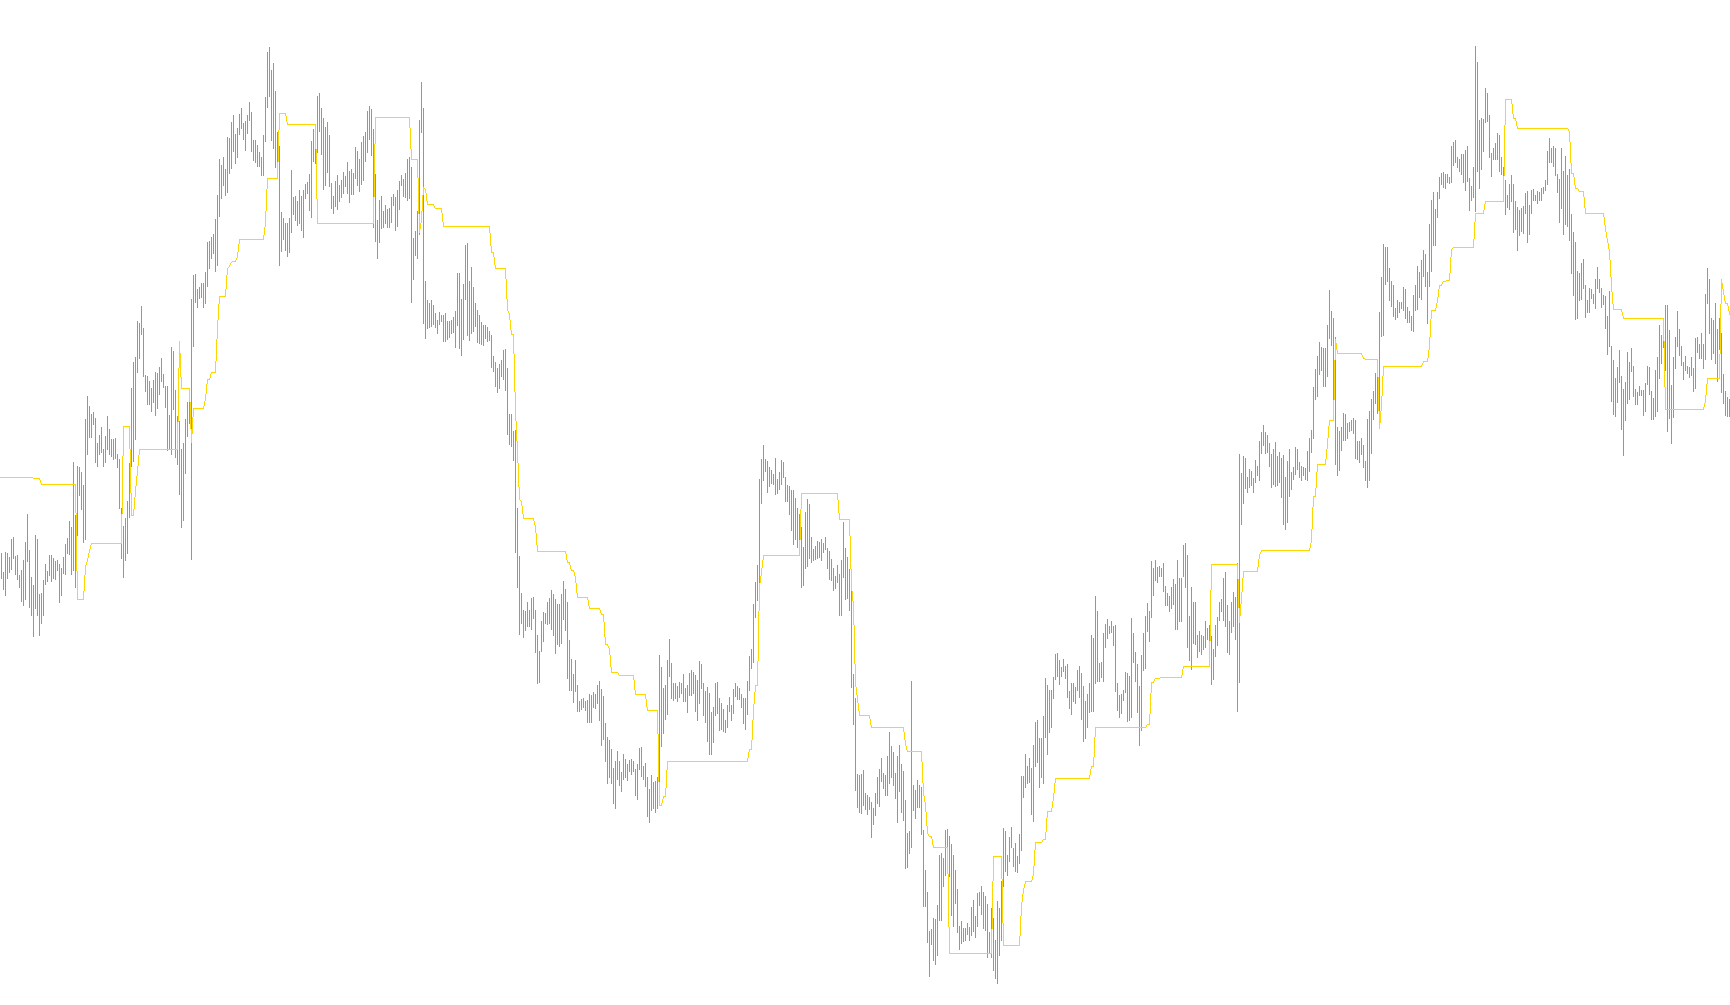
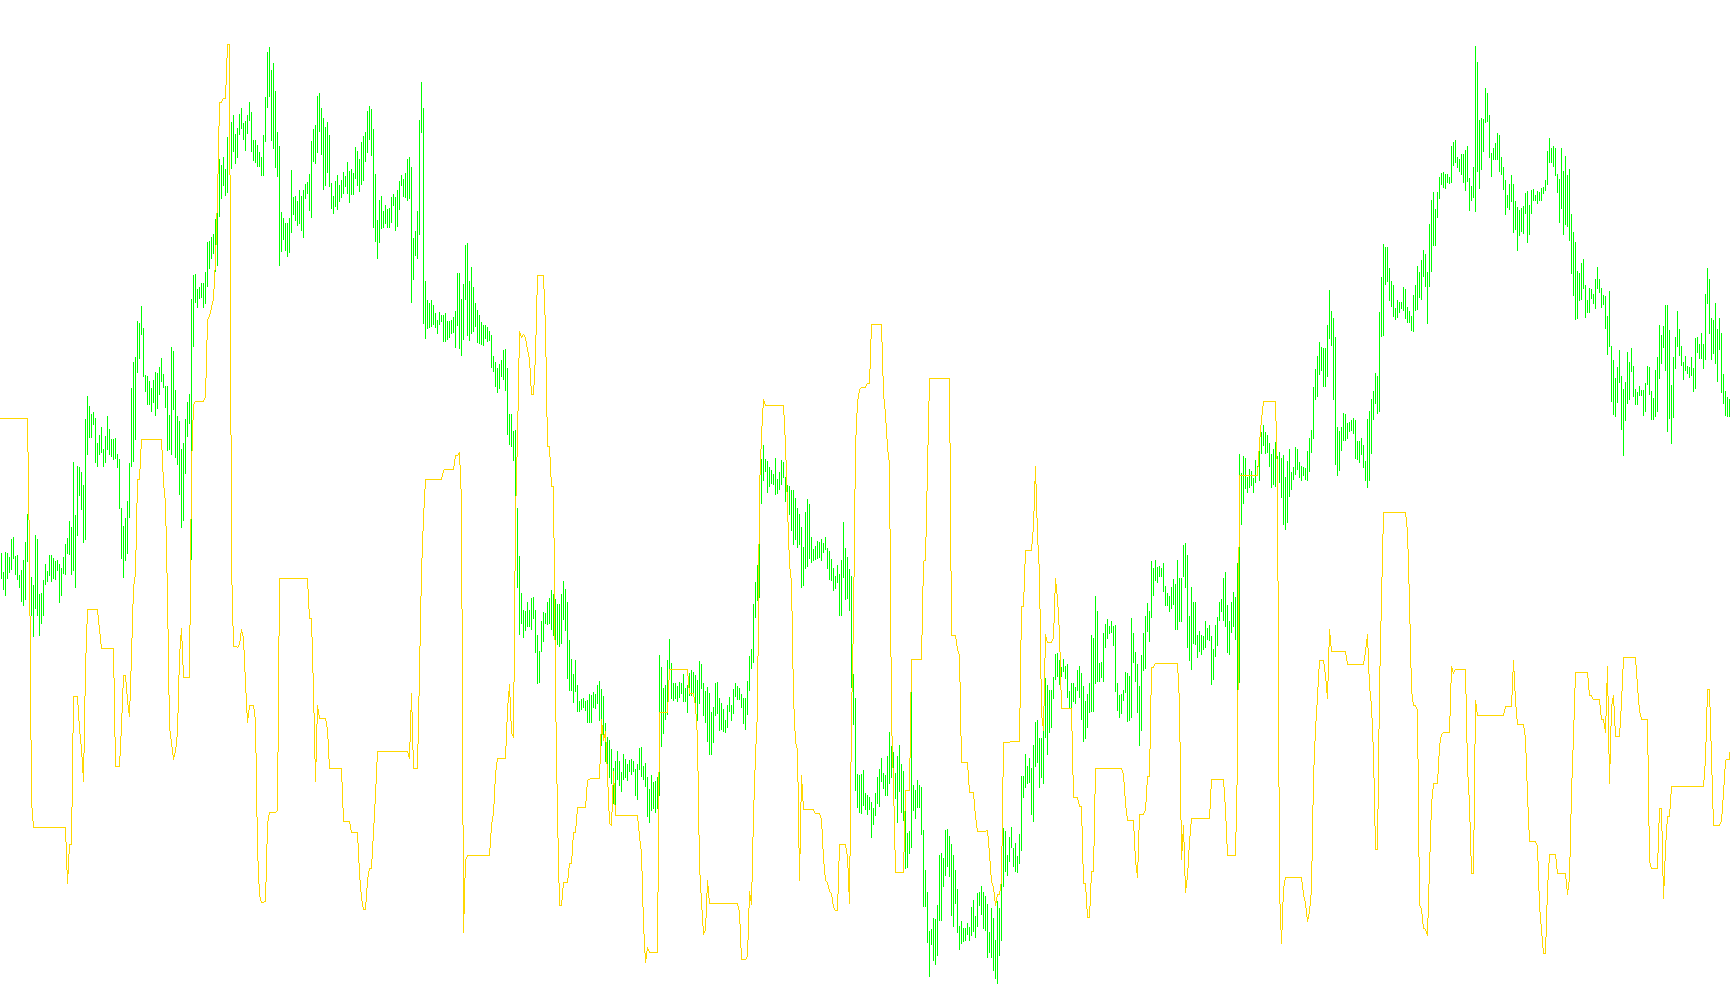
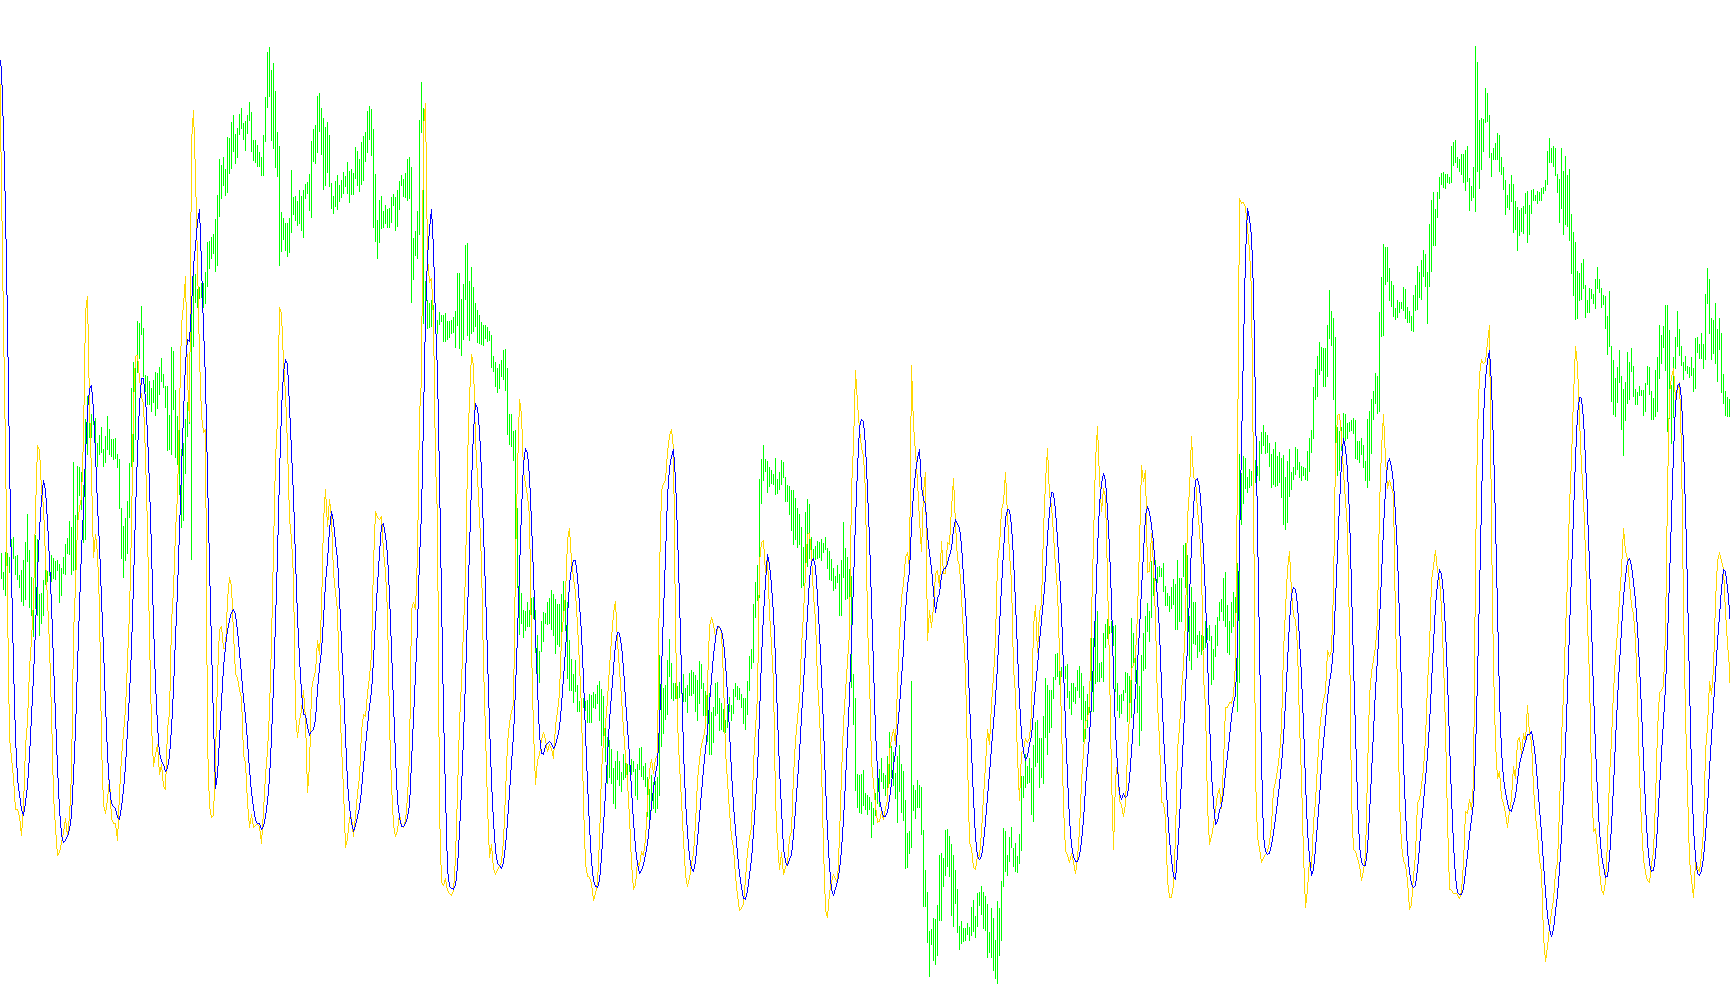
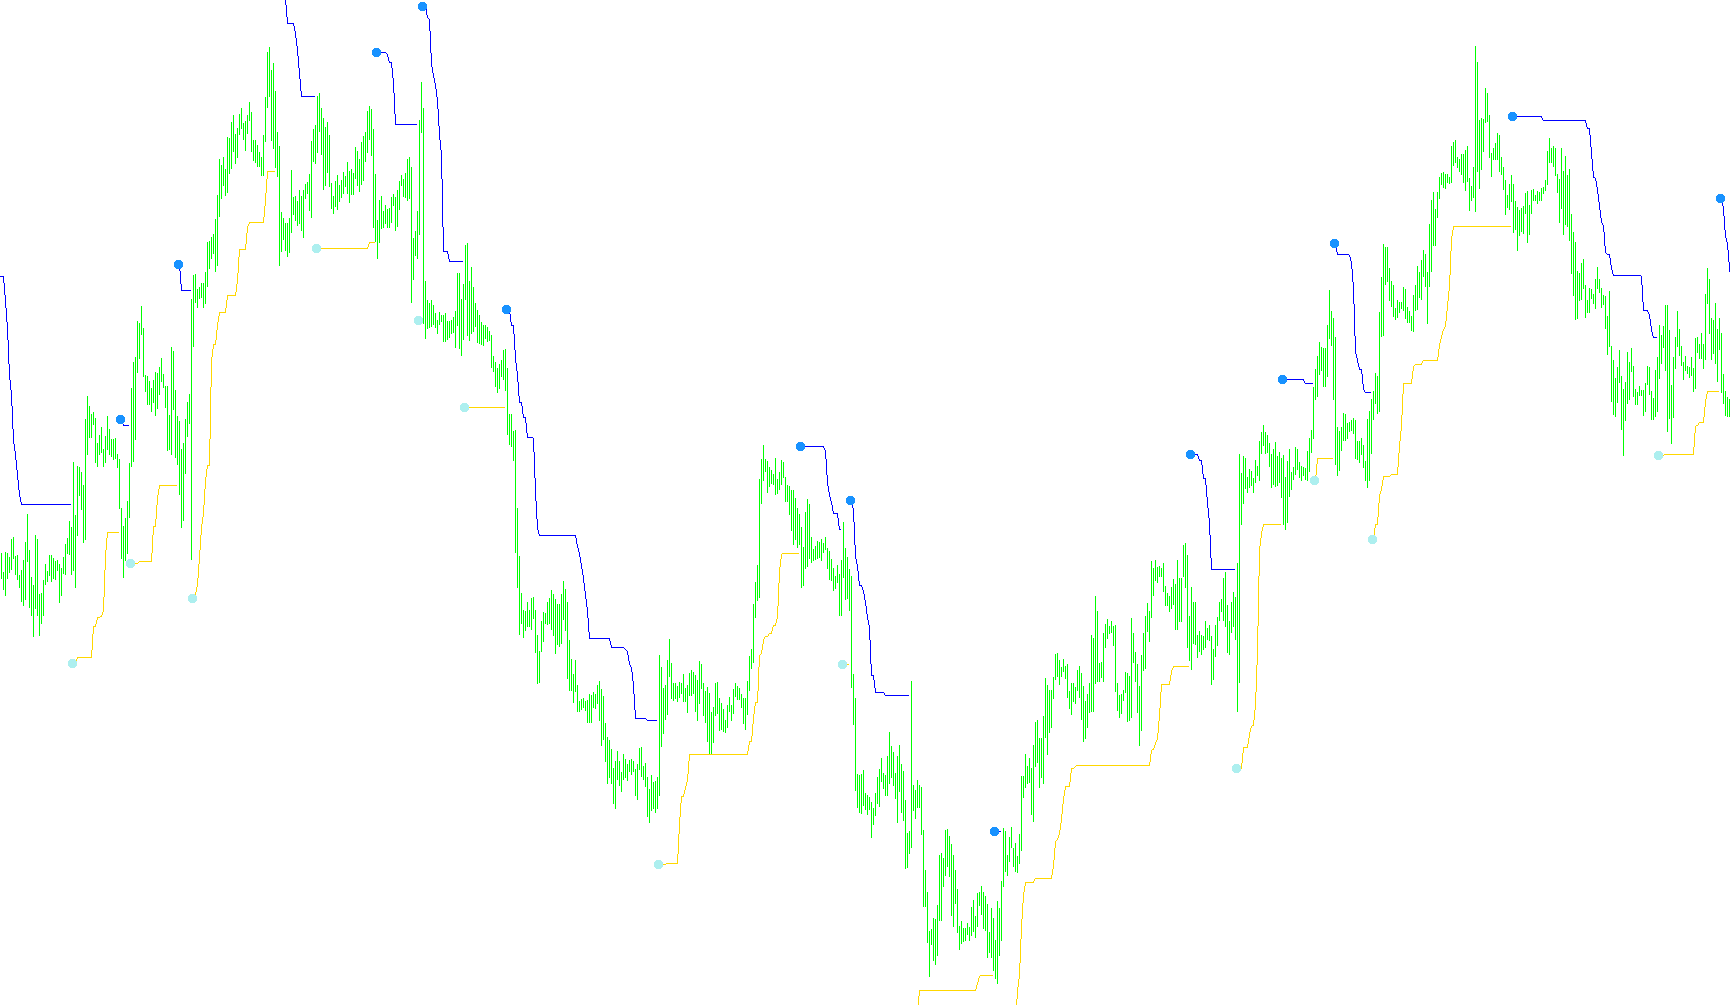
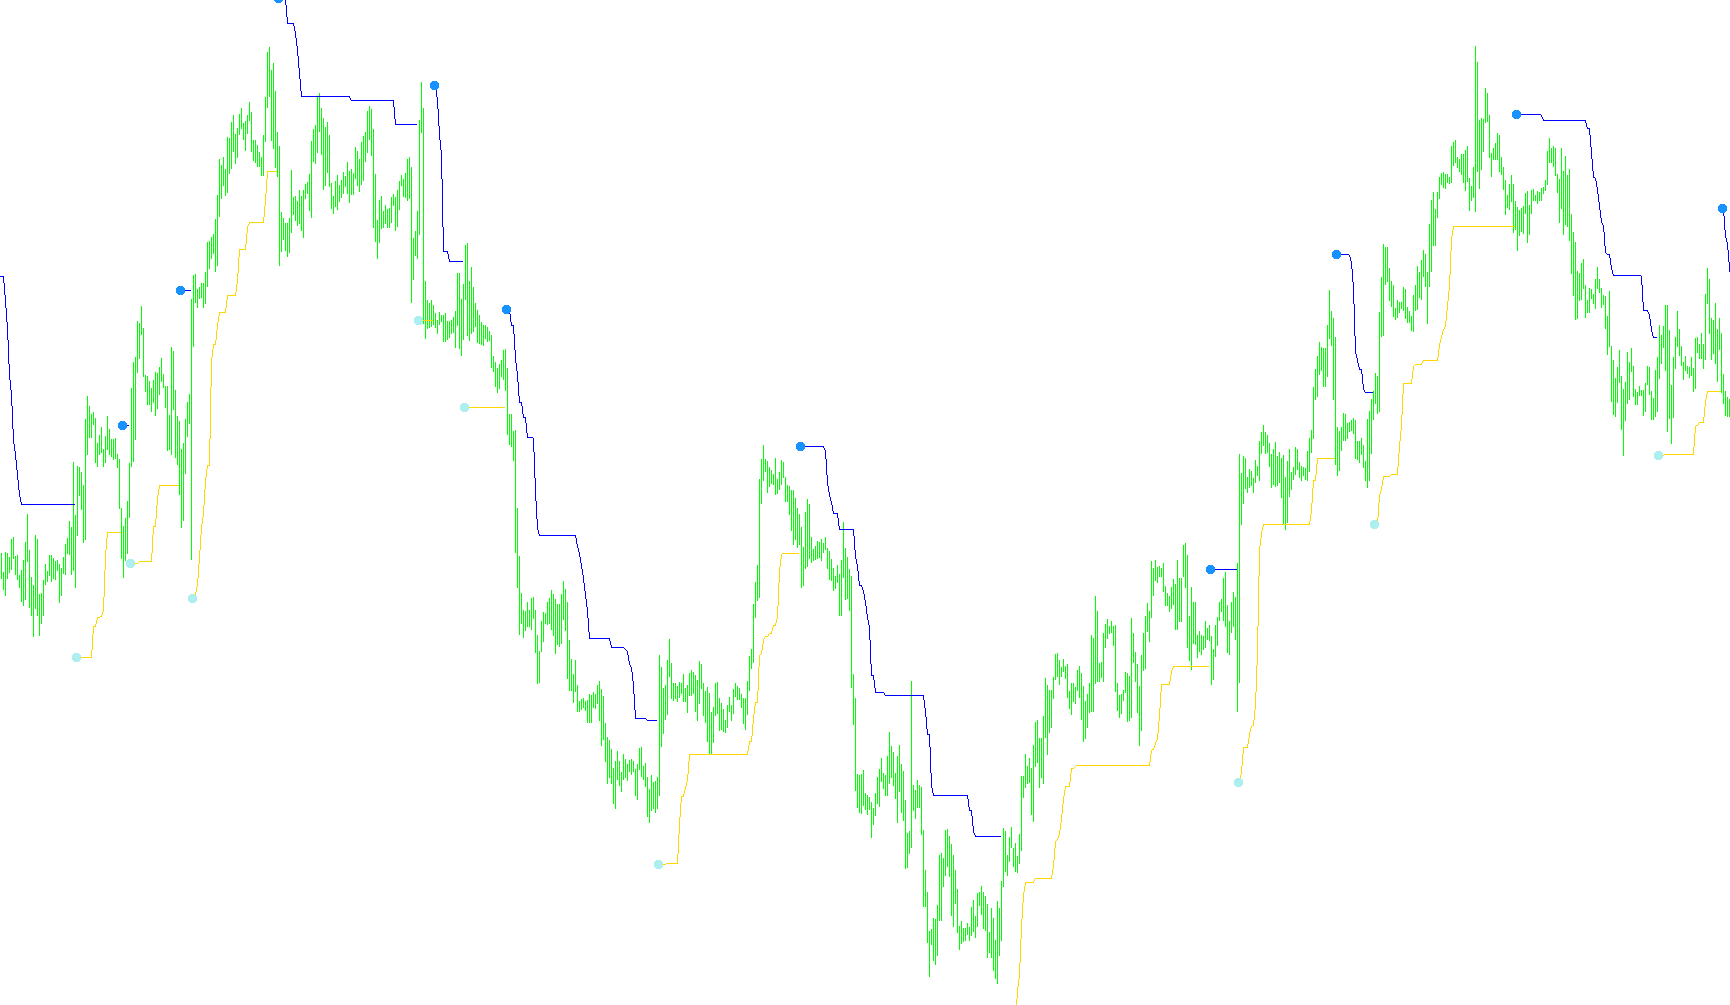
The indicator tracks market equilibrium by dynamically adjusting a trailing stop based on the product of smoothed Average True Range and a multiplier factor.

Volatility.Pivot_002
Indicator

Volatility.Pivot_002

iATRiMAOnArray

This indicator calculates a reactive price boundary that adjusts based on smoothed ATR fluctuations and price momentum to define trailing liquidity zones.

Volatility.Pivot_v1
Indicator

Volatility.Pivot_v1

iATRiMAOnArray

This indicator calculates a reactive trailing stop by adjusting price levels based on an Exponential Moving Average of the Average True Range to dynamically capture momentum shifts.

Volatility.Pivot_v3
Indicator

Volatility.Pivot_v3

iATRiMAOnArray

This indicator dynamically projects a trailing price threshold by calculating a variable offset based on smoothed Average True Range fluctuations and price breakout polarity.

Volatility2
Indicator

Volatility2

iMA

Calculates the percentage variance between high and low simple moving averages to quantify market price fluctuations.

Volatility4
Indicator

Volatility4

iMA

Quantifies price action intensity by calculating the scaled variance between moving averages of high and low price extremes.

VolatilityIndicator
Indicator

VolatilityIndicator

Calculates the absolute point difference between the highest high and lowest low over a user-defined rolling period to quantify price expansion.

Indicator

Volatility_Pivot_AplPrice_mtf

iATRiMAiMAOnArray
Indicator

Volatility_Pivot_mtf

iATRiMAOnArray
VolATR
Indicator

VolATR

iATRiMAOnArray

This indicator calculates a moving average of the Average True Range to identify underlying market volatility trends.

VolPerPip v4
Indicator

VolPerPip v4

This indicator quantifies market intensity by calculating the ratio of trading volume relative to price movement (pips) across a rolling window to identify high-effort versus low-effort trends.

Indicator

VoltyChannel_Stop

iATRiMA
VoltyChannel_Stop_v1
Indicator

VoltyChannel_Stop_v1

iATR

This indicator identifies trend reversals and trailing stop levels by dynamically expanding price boundaries based on Average True Range (ATR) fluctuations and recursive minimum/maximum tracking.

VoltyChannel_Stop_v1M
Indicator

VoltyChannel_Stop_v1M

iATR

This indicator calculates dynamic support and resistance levels based on Average True Range to plot trailing stop boundaries and trend reversal signals.

VoltyChannel_Stop_v2.1
Indicator

VoltyChannel_Stop_v2.1

iATRiMA

Identifies trend reversals and dynamic trailing stop levels by calculating price envelopes based on weighted moving averages and ATR-derived volatility multipliers.

VoltyChannel_Stop_v2.1M
Indicator

VoltyChannel_Stop_v2.1M

iATRiMA

This indicator identifies trend shifts by monitoring price breaches of ATR-based volatility envelopes and generates dynamic trailing stop levels that adjust to market expansion.

VoltyChannel_Stop_v2.1M_v1
Indicator

VoltyChannel_Stop_v2.1M_v1

iATRiMA

This indicator identifies trend reversals by monitoring price breaches of an ATR-based volatility envelope and projects non-repainting trailing stop levels based on momentum shifts.

VoltyChannel_Stop_v2.1_001
Indicator

VoltyChannel_Stop_v2.1_001

iATRiMA

This indicator calculates trend reversals by tracking price breaches of ATR-based volatility bands and generates trailing stop levels that contract based on market fluctuations.

VoltyChoppy_v1
Indicator

VoltyChoppy_v1

iATR

This indicator categorizes market momentum into four distinct states of strength and volatility by comparing price action against multi-layered ATR-based expansion bands.

VoltyChoppy_v1_002
Indicator

VoltyChoppy_v1_002

iATR

This indicator categorizes market dynamics into four distinct phases by measuring the expansion of price action against ATR-based volatility boundaries to identify trend strength and structural transitions.

VoltyChoppy_v1_005
Indicator

VoltyChoppy_v1_005

iATR

This indicator quantifies market momentum by calculating four distinct levels of price volatility relative to Average True Range (ATR) bands to identify trend strength, retracements, and transitionary phases.

VoltyChoppy_v1_sounds
Indicator

VoltyChoppy_v1_sounds

iATR

This indicator dynamically categorizes market momentum into four distinct phases by evaluating price action against multiple scaled Average True Range (ATR) thresholds.

VoltyChoppy_v1_sounds_001
Indicator

VoltyChoppy_v1_sounds_001

iATR

This indicator utilizes nested ATR-based volatility bands to categorize market dynamics into four distinct states of trend strength, retracement, and exhaustion.

Volume Custome MA
Indicator

Volume Custome MA

This indicator visualizes relative volume fluctuations through color-coded histograms while overlaying multiple moving average types to identify momentum shifts and liquidity trends.

Volume Custome MA_002
Indicator

Volume Custome MA_002

This indicator visualizes relative volume momentum by comparing current turnover against a multi-mode moving average while utilizing bimodal color coding to highlight sequential growth and contraction.

Volume JMA Option
Indicator

Volume JMA Option

iMAOnArray

This indicator identifies volume expansion and contraction by comparing price-action momentum against multiple moving average models, featuring a customizable Jurik Moving Average (JMA) to filter noise.

Volume Spread Analyzer
Indicator

Volume Spread Analyzer

This indicator identifies market sentiment by correlating relative volume intensity and price spread to detect climactic activity, trend exhaustion, and liquidity imbalances.

Volume Ticks Separate
Indicator

Volume Ticks Separate

This indicator bifurcates total bar volume into distinct bullish and bearish components based on the price delta relative to the tick size.

Volume with custom MA
Indicator

Volume with custom MA

This indicator visualizes trading activity by plotting comparative volume histograms with distinct color coding for expansion and contraction, overlaid with customizable moving average types (SMA, EMA, SMMA, LWMA) to smooth out volatility.

Volume with custom MA_v1
Indicator

Volume with custom MA_v1

This indicator visualizes volume trends by mapping sequential growth and decay onto a multi-method moving average overlay to highlight liquidity shifts.

VolumeAverage_v1
Indicator

VolumeAverage_v1

iMAOnArray

This indicator identifies significant price-action shifts by correlating real-time trading volume against a moving average threshold to highlight high-intensity volatility spikes.

volumeMA
Indicator

volumeMA

This indicator visualizes relative volume trends by comparing current tick activity against a customizable moving average and using directional color coding to signal momentum shifts.

volumeMAver2
Indicator

volumeMAver2

This indicator visualizes trading activity by mapping historical volume data onto a color-coded histogram that distinguishes between expansion and contraction trends relative to customizable moving average filters.

volumeMA_v1
Indicator

volumeMA_v1

This indicator visualizes real-time trading activity by mapping volume fluctuations onto a multi-method moving average while dynamically switching histogram colors based on relative tick momentum.

volumeMA_v2
Indicator

volumeMA_v2

This indicator visualizes relative volume fluctuations by mapping expansion and contraction into a multi-colored histogram overlaid with selectable smoothing algorithms.

VolumeMeans
Indicator

VolumeMeans

The script parses historical tick data to calculate and export time-specific average trading volumes across thirteen major currency pairs into a structured CSV format.
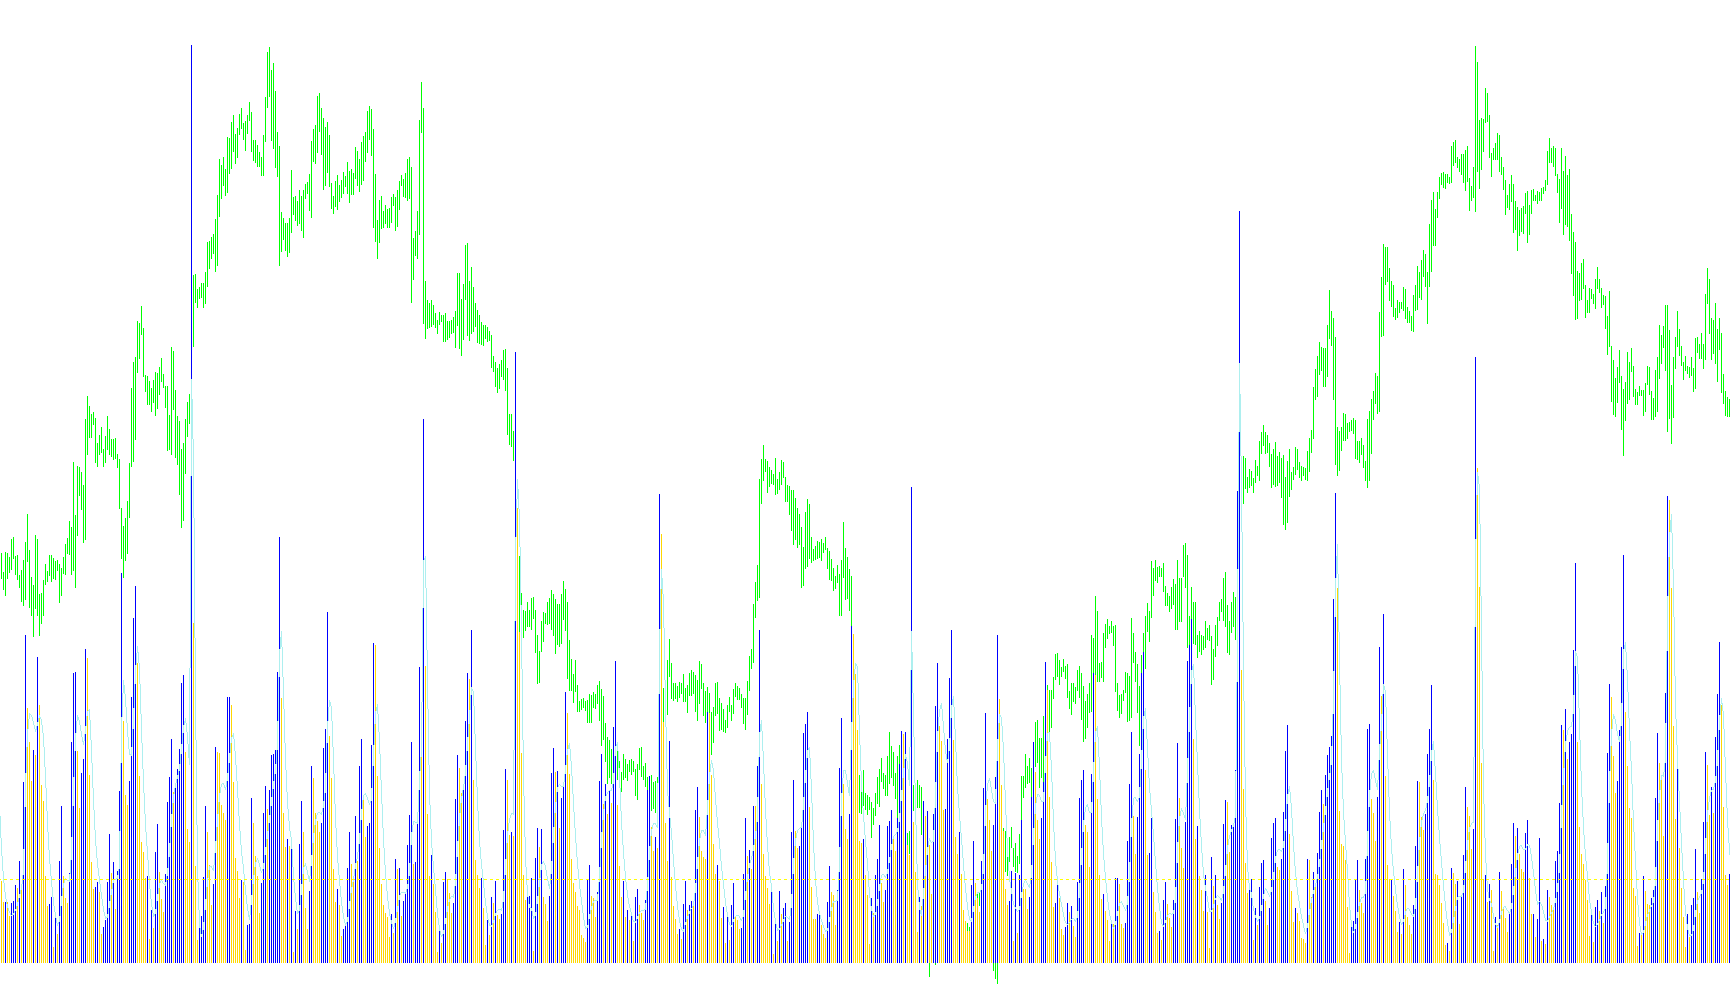
Volumes Emphasized_v1
Indicator

Volumes Emphasized_v1

This indicator categorizes and highlights relative volume spikes by overlaying color-coded graduation bars against a normalized moving average.
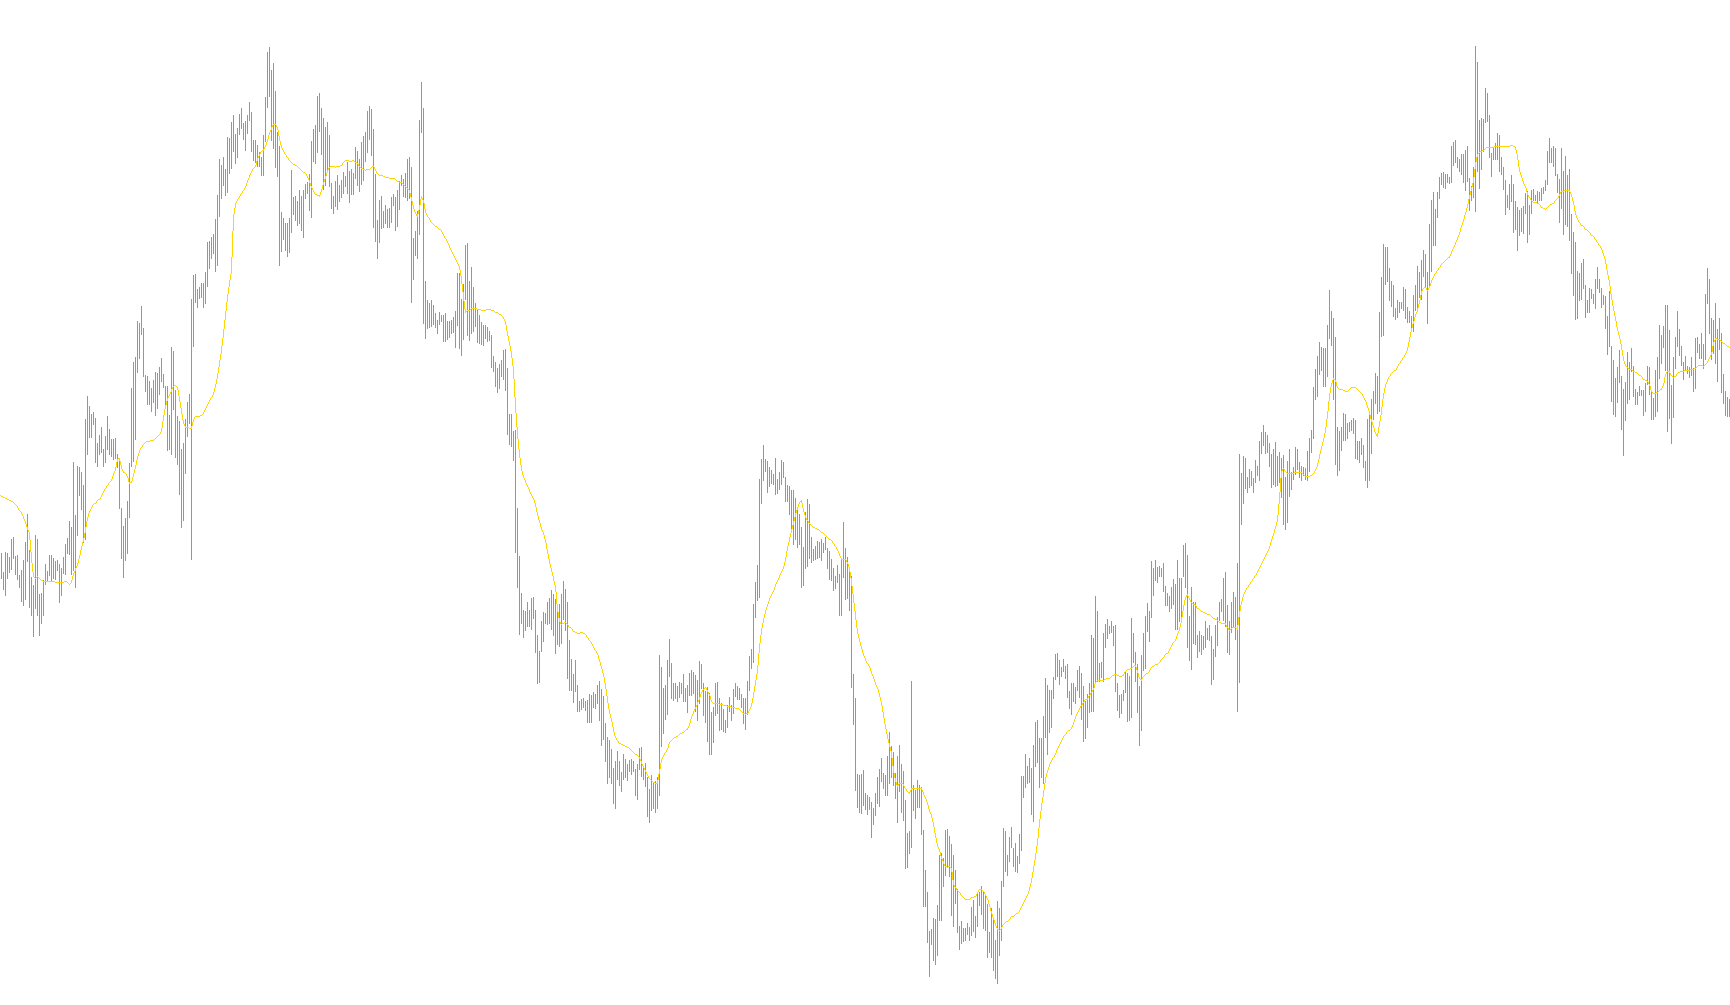
Volumes
Indicator

Volumes

The logic bifurcates raw tick volume into bullish and bearish histograms by comparing the current bar's magnitude against its immediate predecessor.

VolumesHist
Indicator

VolumesHist

Visualizes cumulative trading activity across a historical price range by normalizing M1 volume into a vertical density histogram.

VolumesHist2.3
Indicator

VolumesHist2.3

This indicator calculates the cumulative distribution of traded volume across specific price levels within a defined lookback period to identify high-liquidity zones.

Indicator

Volume_2.v4

Volume_JMA_OptionZeroCheck
Indicator

Volume_JMA_OptionZeroCheck

iMAOnArray

This indicator analyzes volume flow by applying a Jurik Moving Average (JMA) to identify high-precision momentum shifts and dynamic trading thresholds.

Indicator

Volume_MTF

Volume_Weighted_MA
Indicator

Volume_Weighted_MA

This indicator calculates a moving average where each price point within the period is weighted proportionally by its corresponding trading volume, specifically utilizing the median price for trend visualization.

Vostro_+_2010
Indicator

Vostro_+_2010

iMA

This indicator identifies extreme price deviations from a rolling median price by normalizing the distance of highs and lows against localized volatility, filtered through a linear weighted moving average.

VQ bars
Indicator

VQ bars

iMA

This indicator quantifies price velocity relative to high-low variance and filters cumulative momentum fluctuations to determine structural trend direction.

Indicator

VQ

iMA
Indicator

VQ1

iMA
Indicator

VQ2

iMA
VQ_bars
Indicator

VQ_bars

iMA

This indicator calculates a weighted volatility quotient based on relative price positioning between high, low, open, and close averages to determine directional momentum trends.