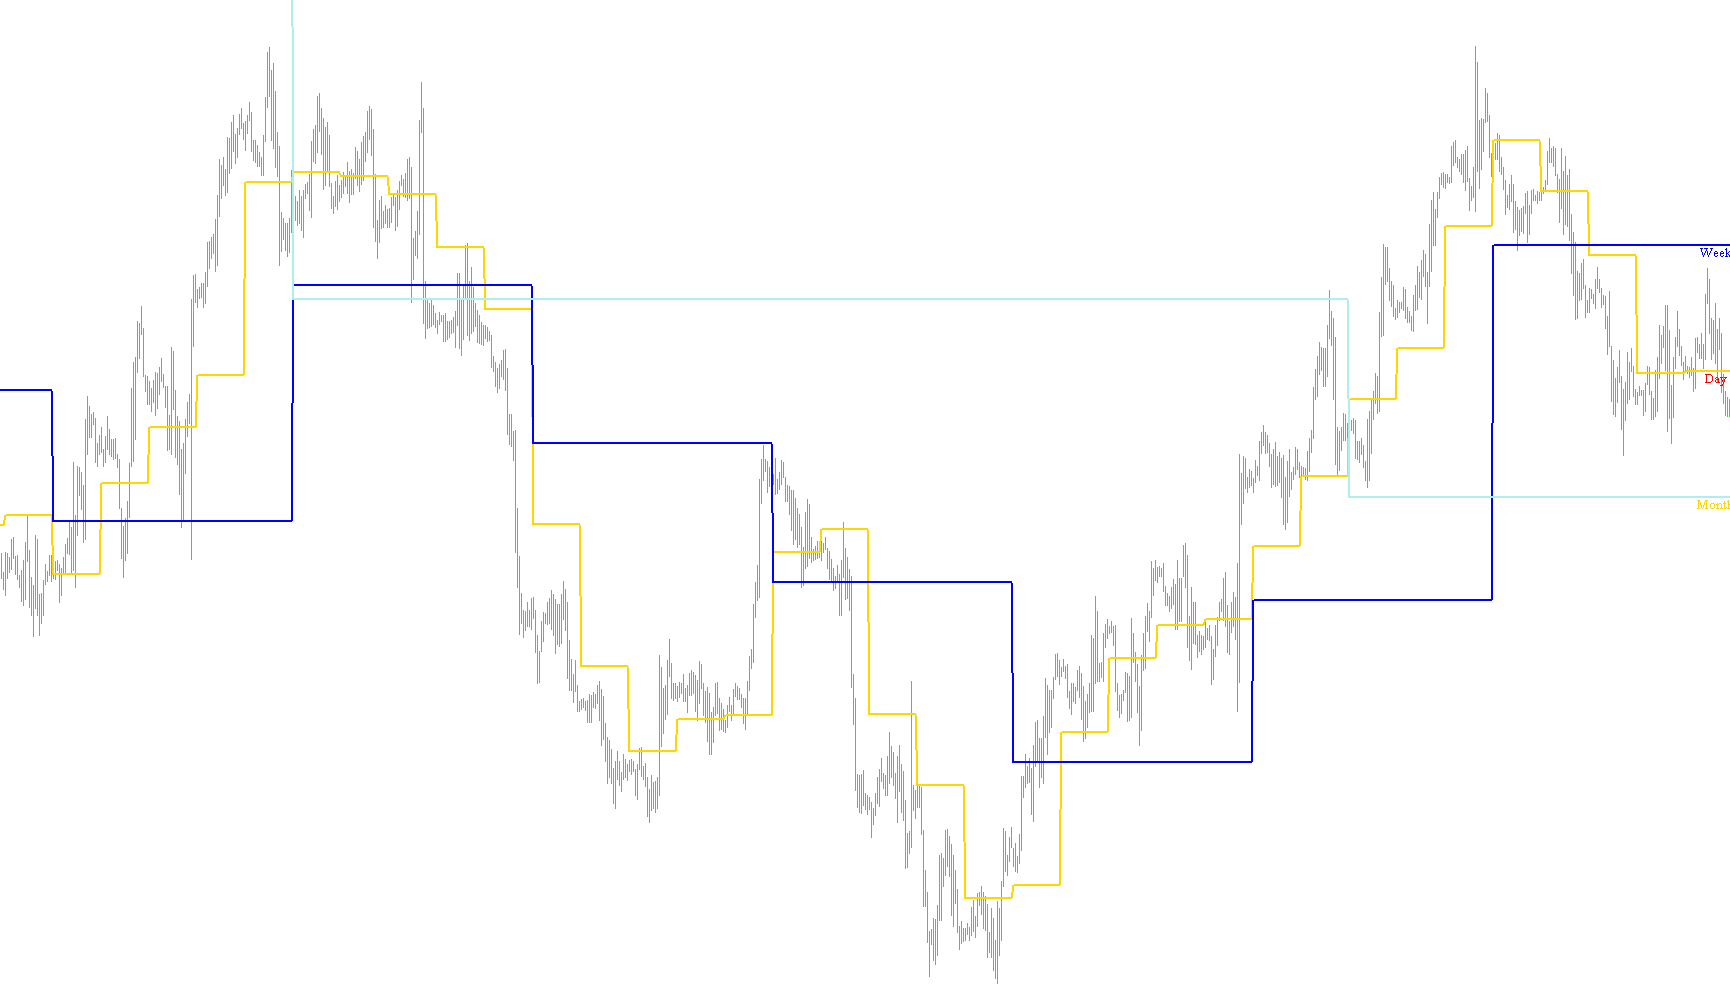
Indicator

VQ_v1

iMA
Indicator

VQ_v2

iMA
VROC
Indicator

VROC

Calculates the relative percentage shift in trading volume over a fixed historical interval to quantify momentum intensity.

VSA-wick0[1].3
Indicator

VSA-wick0[1].3

iATR

This indicator quantifies price rejection by calculating the cumulative distance between candle extremes and the closing price, optionally overlaid with ATR-based volatility bounds.

Indicator

VSAc BAR DOTS

VSAc BAR TEXT SIGNALS
Indicator

VSAc BAR TEXT SIGNALS

iMAOnArray

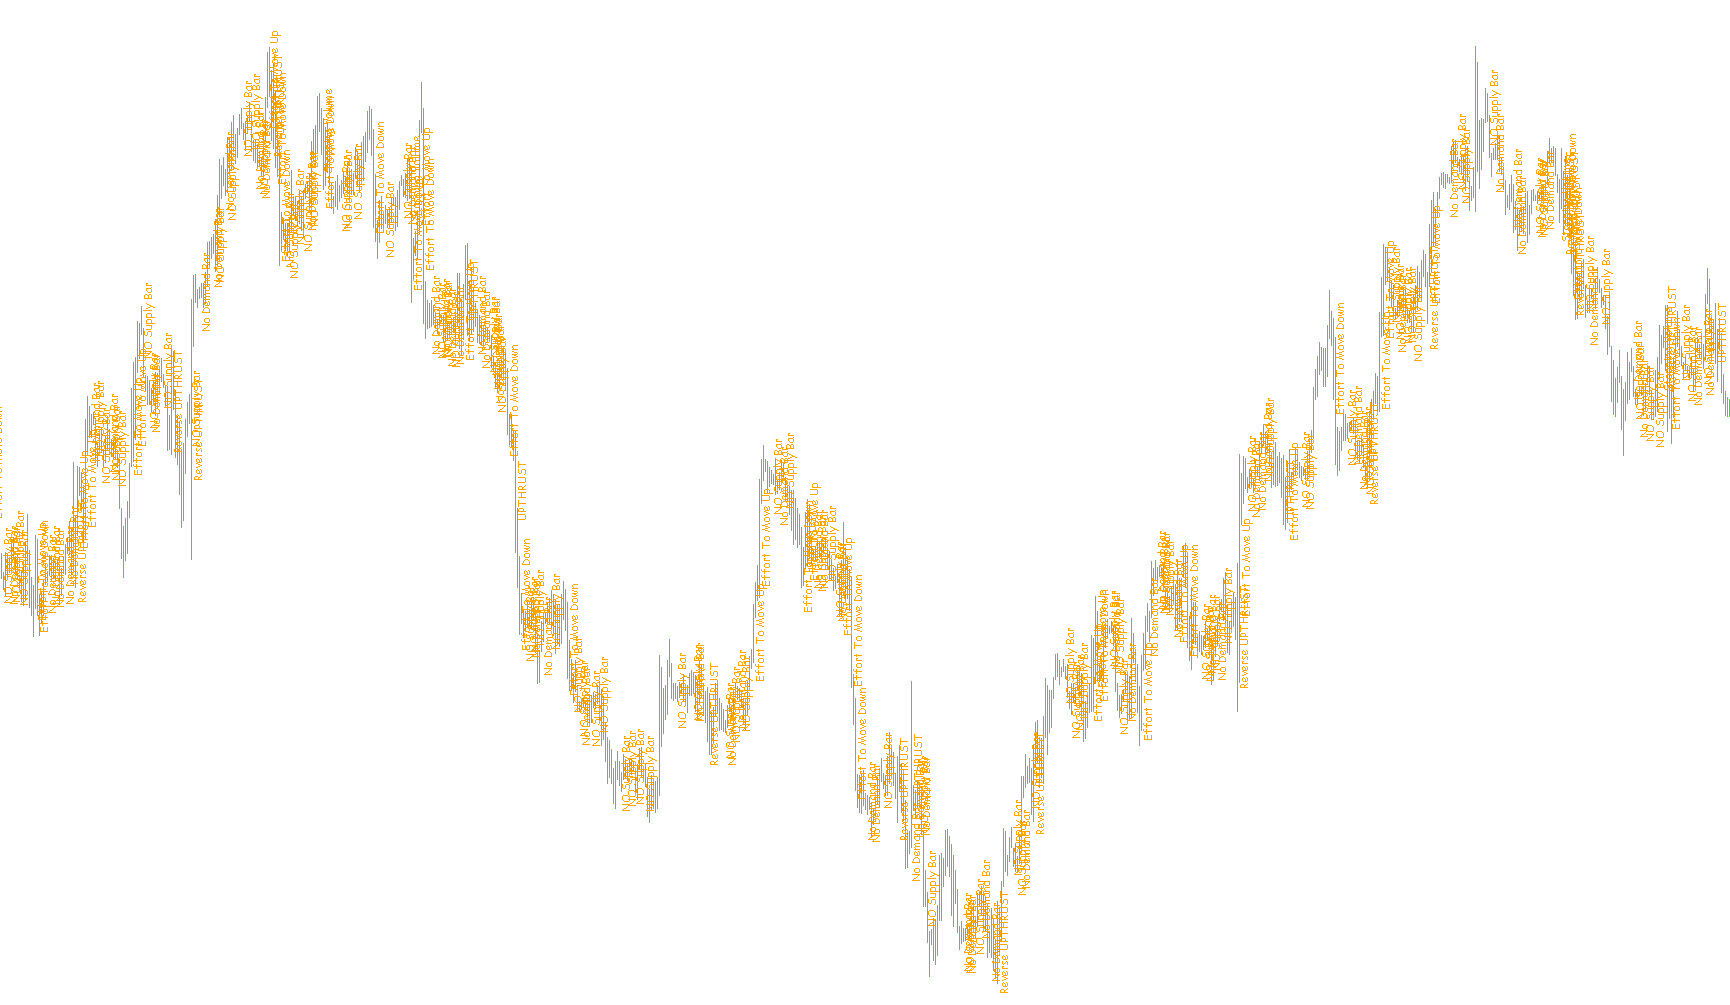
This indicator identifies market sentiment by correlating price action spreads, relative volume surges, and bar closing positions to detect supply/demand exhaustion and institutional activity.

Indicator

VSAc MULTY VOLUME HISTOGRAM(easy on cpu)

Indicator

VSAc MULTY VOLUME HISTOGRAM

VSAc ROUND NUMBERS
Indicator

VSAc ROUND NUMBERS

This indicator automatically identifies and plots horizontal levels at every 1,000-unit price interval relative to the current market bid.

Indicator

VSAc WSD HISTOGRAM

iMAOnArray
VSAdiv
Indicator

VSAdiv

iMACD

This indicator identifies price-momentum discrepancies by correlating MACD peaks and troughs with price action while filtering volume intensity via custom moving averages.

VSA_ TrendDiamonds
Indicator

VSA_ TrendDiamonds

iBandsiMAiSAR

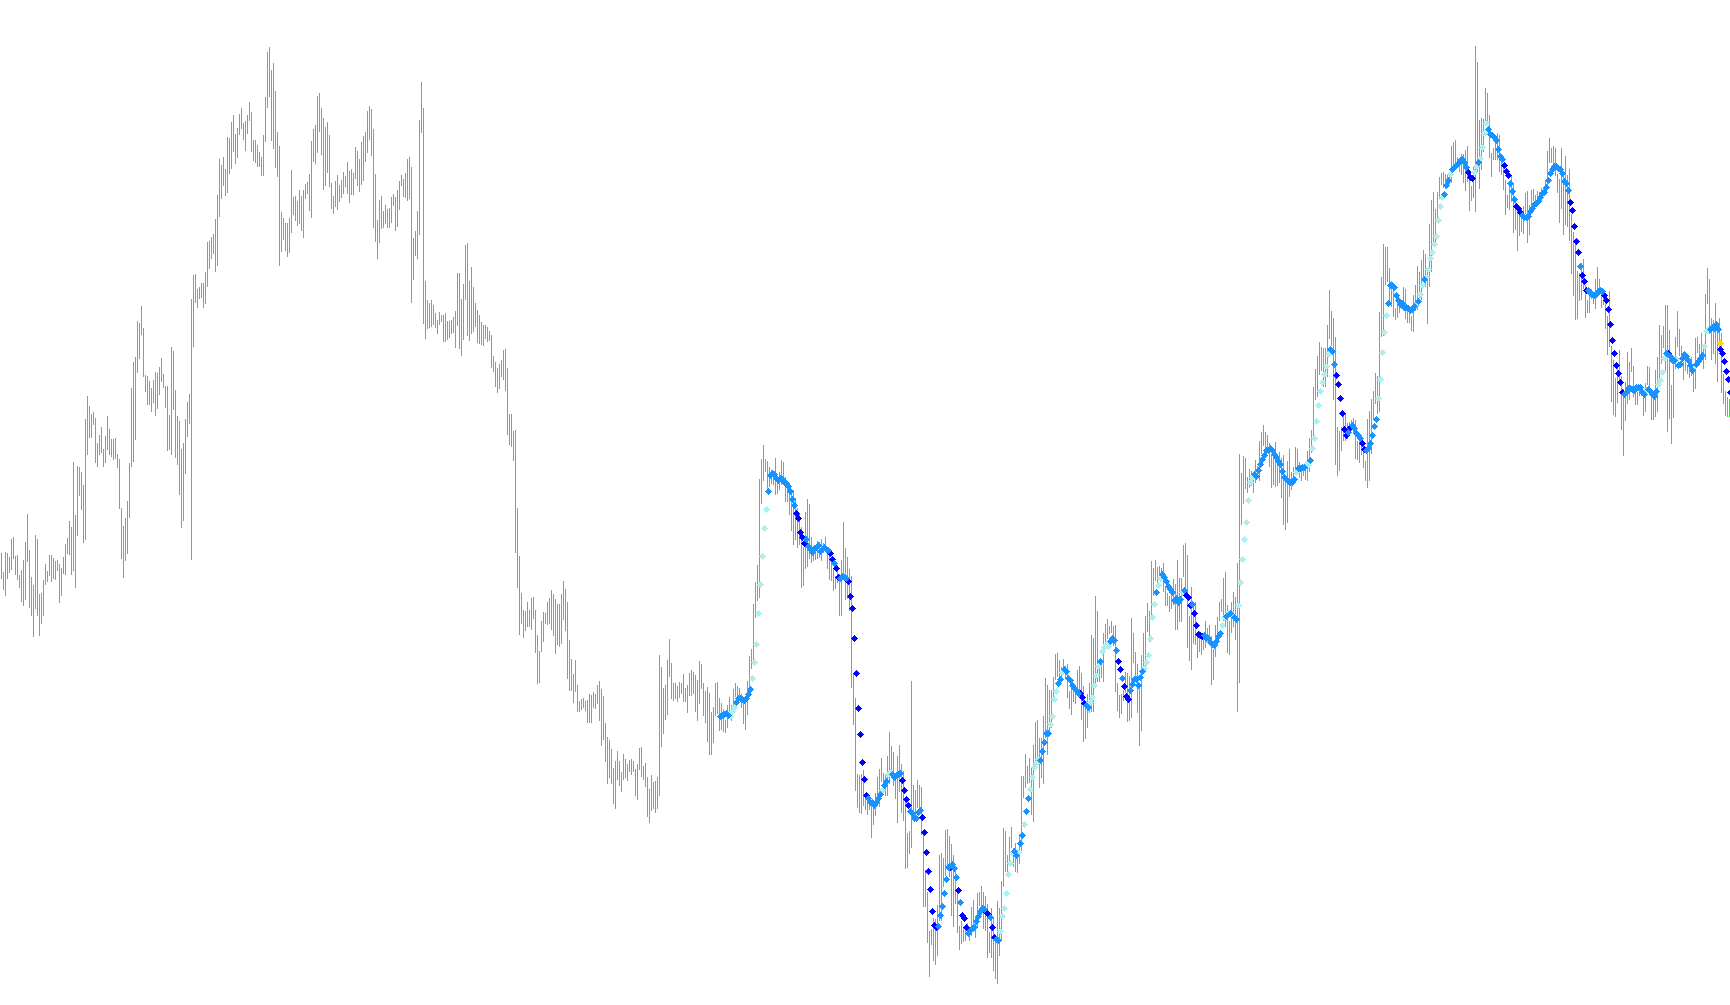
This indicator identifies directional shifts by synchronizing Smoothed Moving Average slopes with Parabolic SAR position and expanding Bollinger Band volatility thresholds.

VSA_Candle
Indicator

VSA_Candle

This indicator visualizes price action by mapping the candle range as a central spread and highlighting directional bias based on the closing price's deviation from the median midpoint.
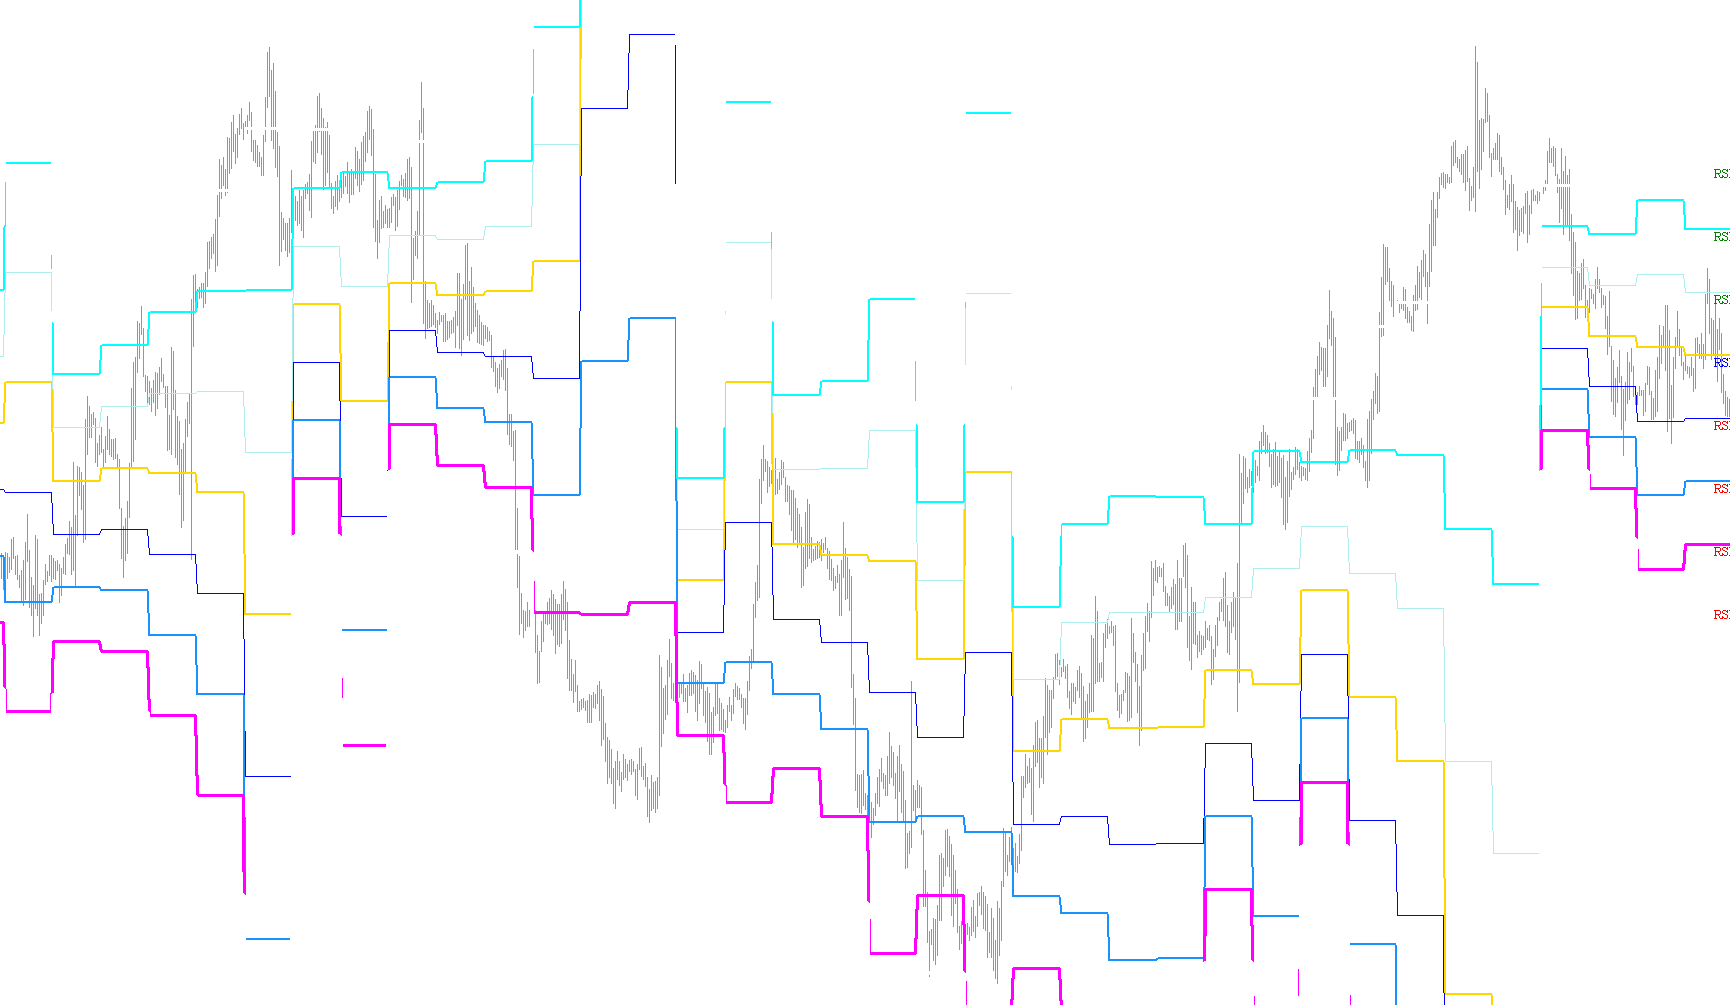
VSA_Histogram
Indicator

VSA_Histogram

This indicator visualizes price action intensity by calculating and plotting high-low ranges, upper wicks, and closing proximity across varying temporal resolutions.

VSA_Text
Indicator

VSA_Text

This indicator identifies institutional price action patterns by correlating historical volume averages with relative candle spread dynamics to detect supply and demand shifts.

VSI
Indicator

VSI

iMAOnArray

Normalizes trading activity by calculating the rate of volume distribution per unit of time to enable consistent comparison across varying chart intervals.

VSI_v1
Indicator

VSI_v1

iMAOnArray

This indicator normalizes trading activity by calculating volume per second to provide a consistent liquidity flow metric across disparate timeframes.

VSI_v2
Indicator

VSI_v2

iMAOnArray

This indicator normalizes trading activity by calculating the volume distribution per elapsed second to ensure consistent data comparability across disparate timeframes.

VSpread2
Indicator

VSpread2

iATR

This indicator quantifies relative price velocity by normalizing traded volume against the range of each candle to identify accumulation and distribution intensity.

Indicator

vS_PivotsD

Indicator

vTerminal

VTS_G2
Indicator

VTS_G2

iATR

The algorithm calculates price boundaries using Average True Range multipliers and applies successive recursive extrema to identify nested support and resistance levels.

VTS_G3
Indicator

VTS_G3

iATR

This indicator generates a nested series of recursive volatility bands by iteratively applying Max and Min functions to price levels offset by a multiple of the Average True Range.

VTS_TS
Indicator

VTS_TS

iATR

This indicator identifies potential trend exhaustion points by calculating recursive maximum and minimum price boundaries derived from ATR-based volatility bands.

VTS_VG_G1
Indicator

VTS_VG_G1

iATR

This indicator identifies extreme price boundaries by recursively applying maximum and minimum calculations to multi-layered Average True Range offsets.

VTS_VG_G2
Indicator

VTS_VG_G2

iATR

This indicator generates a nested volatility envelope by recursively applying maximum and minimum price extremes to an Average True Range expansion.

VTS_VG_G3
Indicator

VTS_VG_G3

iATR

This indicator generates dynamic price boundaries by applying successive recursive maximum and minimum calculations over a base Average True Range volatility band.

VTS_VG_TS
Indicator

VTS_VG_TS

iATR

This indicator identifies price breakout points by recursively calculating nested maximum and minimum thresholds based on a multiplier of the Average True Range.

VTS_VG_TS_setka
Indicator

VTS_VG_TS_setka

iATR

This indicator generates a multi-layered recursive volatility ceiling and floor by iteratively applying maximum and minimum calculations to ATR-based price envelopes.

VTS_VG_TS_setka_v1
Indicator

VTS_VG_TS_setka_v1

iATR

This indicator identifies extreme price boundaries by recursively nesting multiple layers of Average True Range (ATR) expansions and high-water mark calculations to detect structural exhaustion.

VTS_VG_TS_setka_v2
Indicator

VTS_VG_TS_setka_v2

iATR

This indicator calculates multi-layered price envelopes using recursive ATR extremes to identify nested volatility channels and automated breakout signals.

VTS_VG_TS_v1
Indicator

VTS_VG_TS_v1

iATR

This indicator identifies trend reversal points by calculating multi-layered recursive extrema based on price deviations from the Average True Range.

Indicator

vusual_start

VWB
Indicator

VWB

iMA

This indicator projects dynamic Fibonacci-based expansion zones around a secondary Exponential Moving Average to identify multi-layered price exhaustion levels.

VX_FibPiv_rws
Indicator

VX_FibPiv_rws

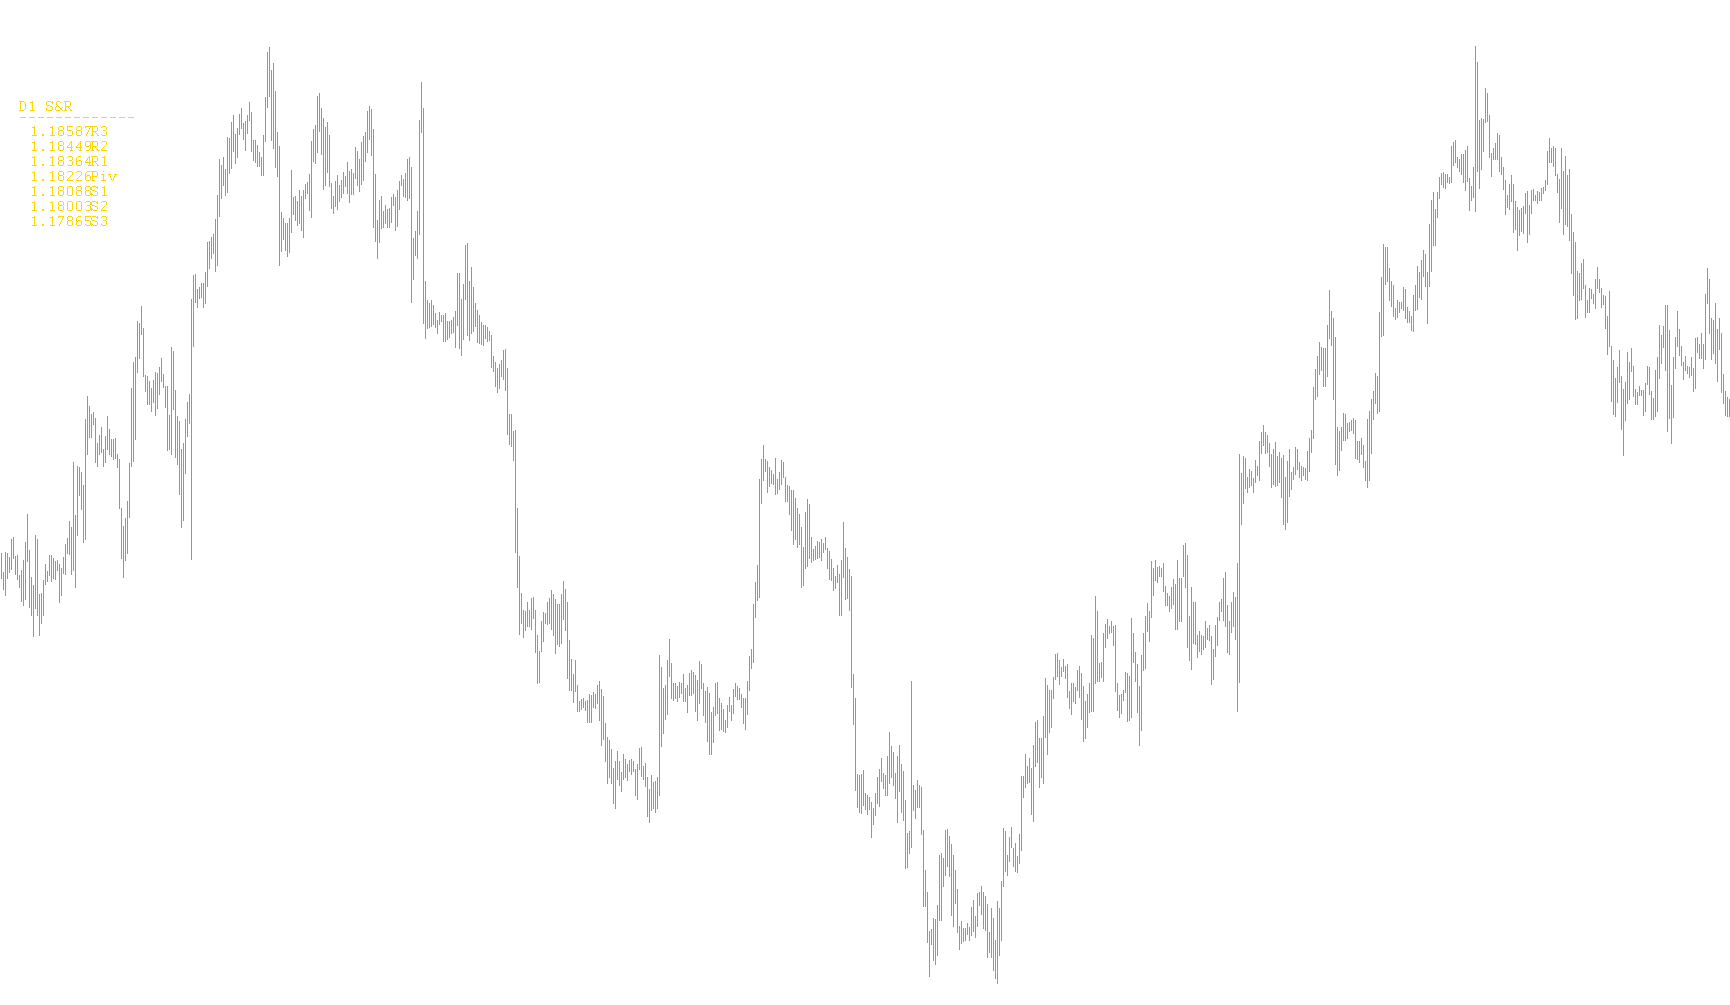
This indicator dynamically calculates and displays key Fibonacci-weighted support and resistance levels based on the previous session's high, low, and close prices.

VX_FibPiv_rws_001
Indicator

VX_FibPiv_rws_001

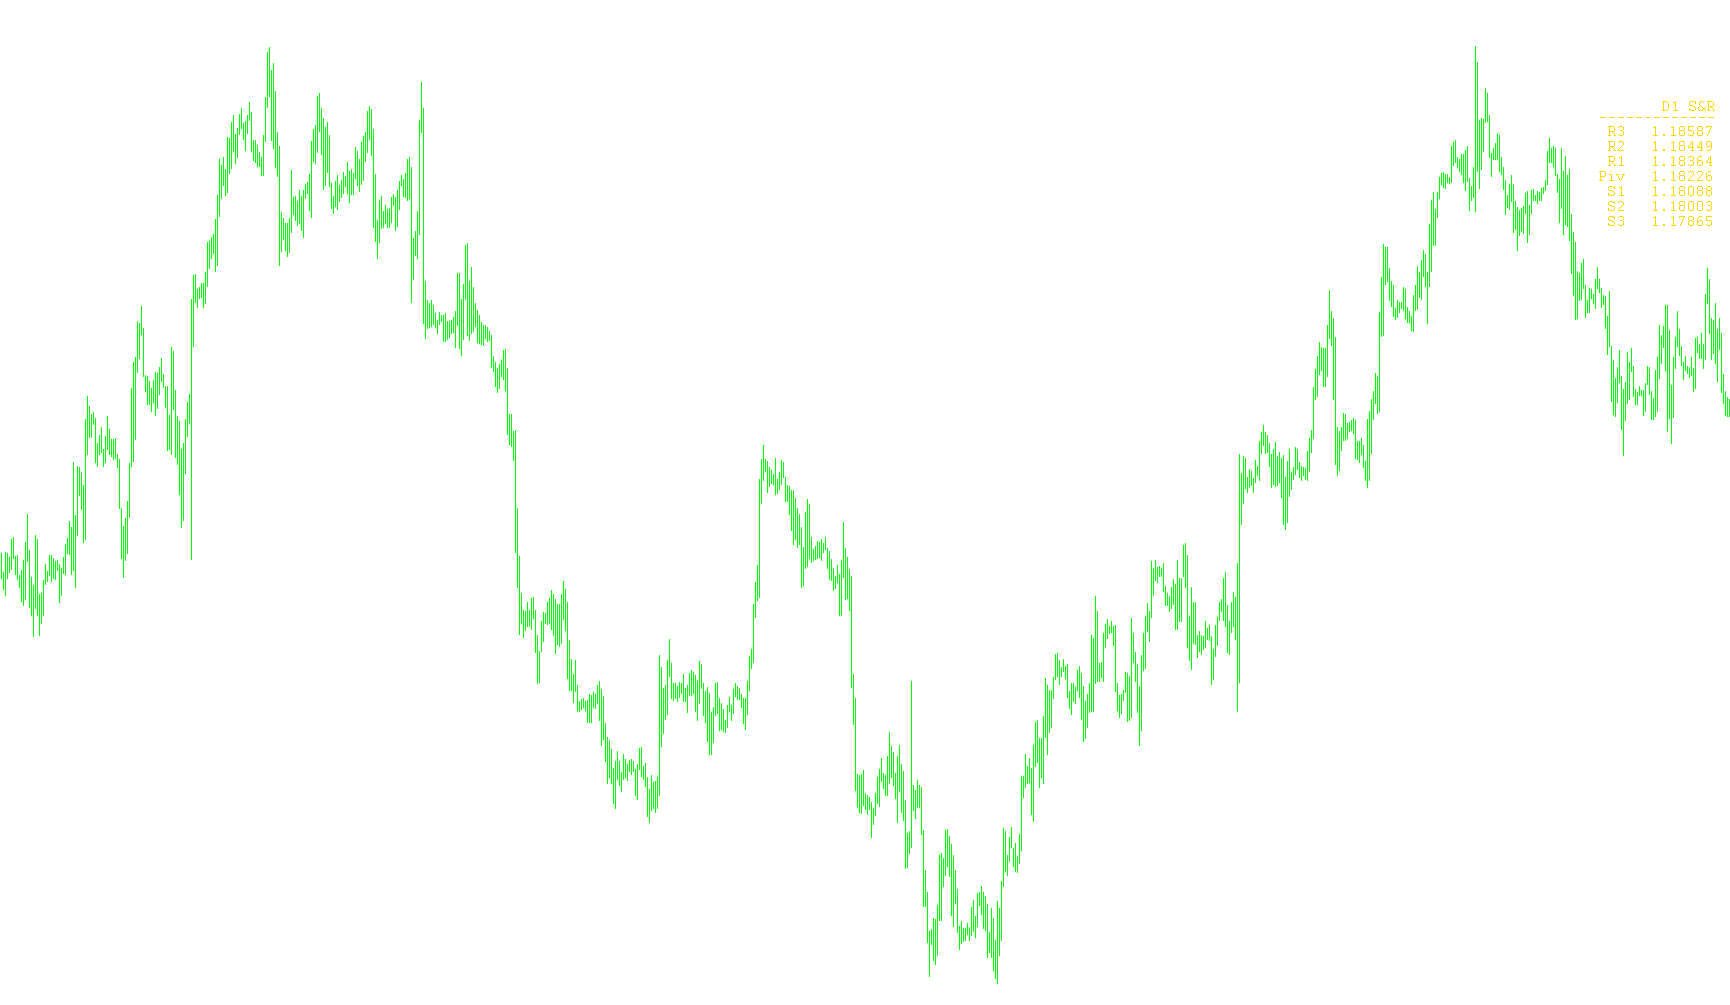
This indicator dynamically calculates and displays daily pivot levels using high, low, and close prices integrated with Fibonacci retracement ratios.

W%R_MA_LC
Indicator

W%R_MA_LC

iWPR

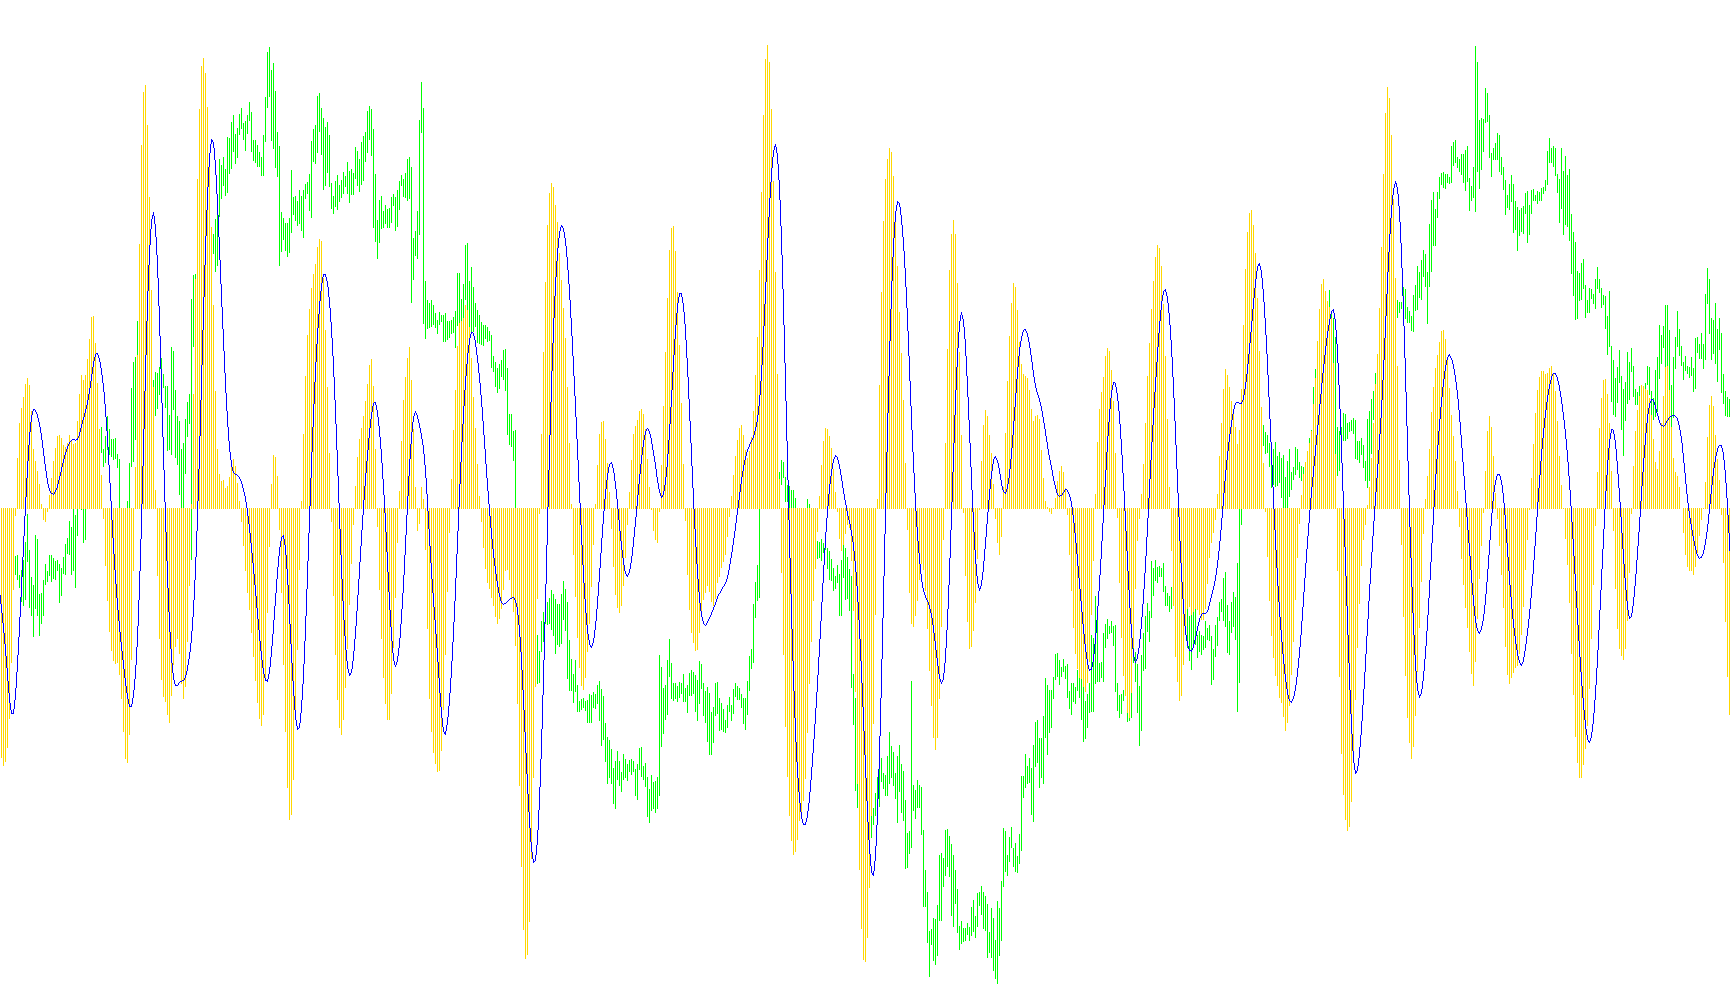
This indicator synchronizes a Williams Percent Range oscillator with its moving average through linear normalization to facilitate clear momentum trend identification.

w35260
Indicator

w35260

iMAOnArray

This indicator quantifies the divergence between two distinct slope velocity gradients to identify momentum shifts, smoothed by a moving average signal.

w35260_Colored
Indicator

w35260_Colored

iMAOnArray

This indicator calculates the differential of dual slope direction lines to generate a momentum histogram with directional state switching and a smoothed signal overlay.

w35260_ws_MA_or_SDL
Indicator

w35260_ws_MA_or_SDL

iMA

This indicator synthesizes directional bias from dual-layered momentum indicators with moving average smoothing or slope-direction line scaling to identify trend transitions.

Waddah Attar Def RSI
Indicator

Waddah Attar Def RSI

iMAOnArrayiRSI

This indicator calculates the numerical spread between two distinct Relative Strength Index periods and applies a Simple Moving Average to smooth the resulting momentum variance.

Waddah Attar Hidden Level
Indicator

Waddah Attar Hidden Level

This indicator identifies significant price levels by calculating the median extremes and 0.618 Fibonacci retracement zones based on previous daily candle structures.

Waddah Attar Monthly Fibo
Indicator

Waddah Attar Monthly Fibo

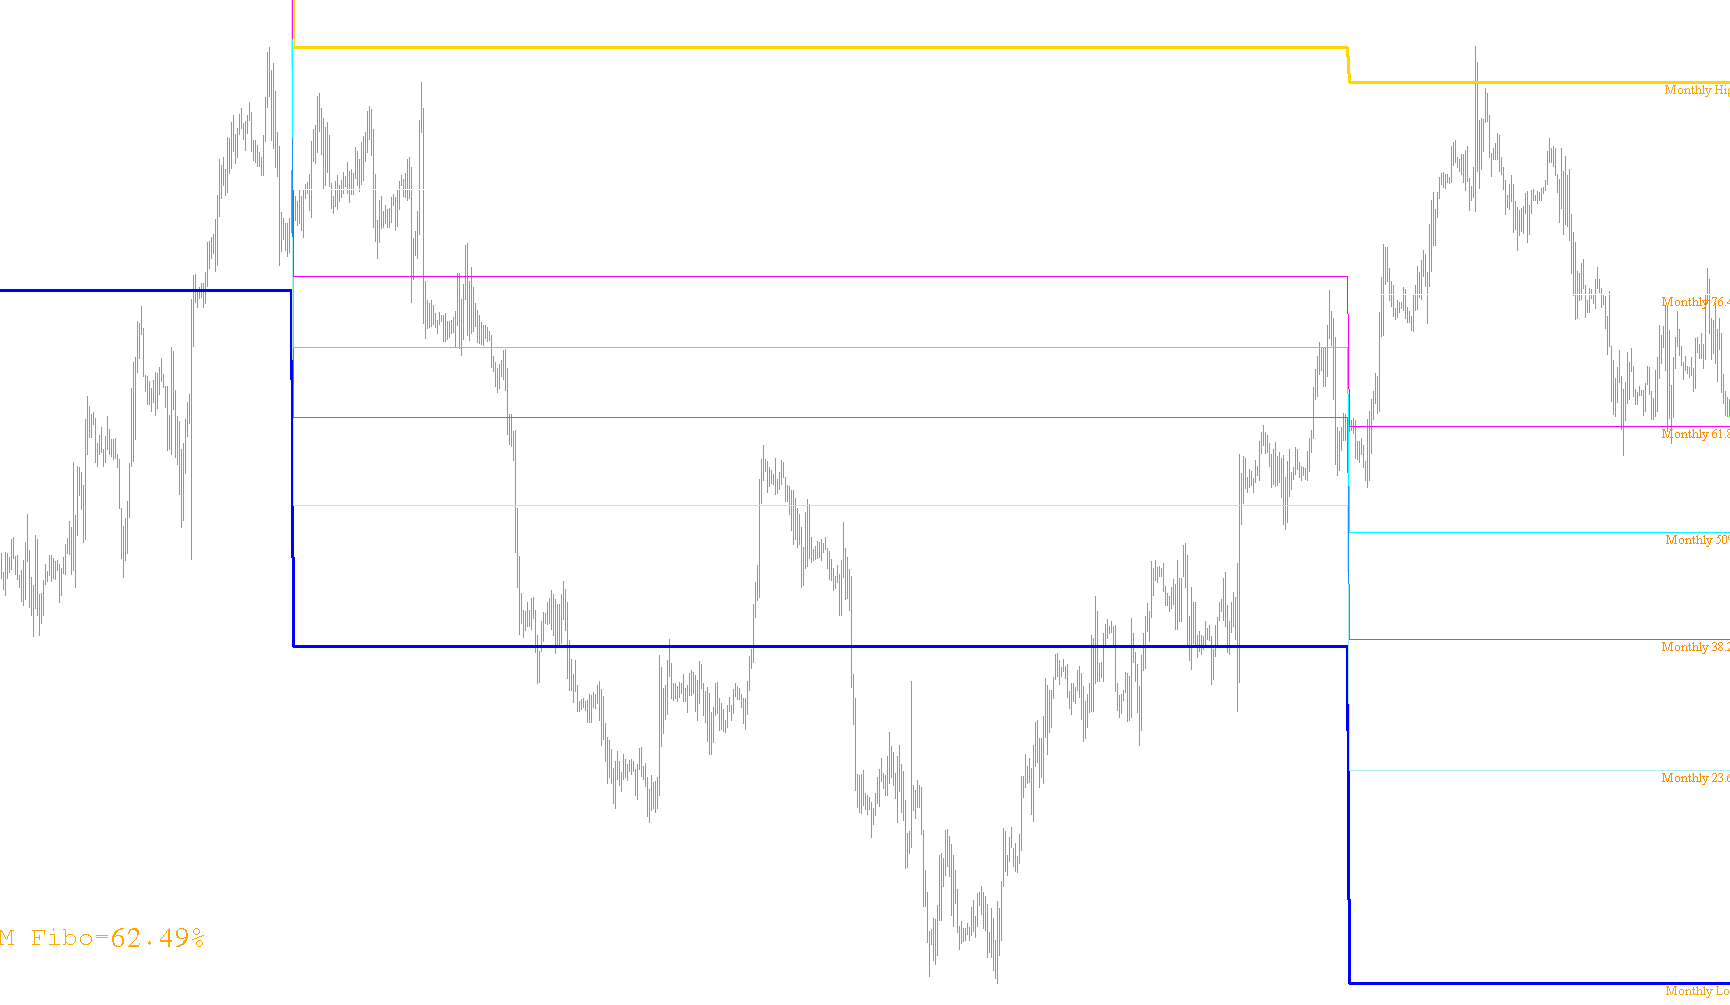
This indicator dynamically projects standard Fibonacci retracement levels based on the price extremes of the current monthly candle to identify high-timeframe liquidity zones.

Waddah Attar Pivot
Indicator

Waddah Attar Pivot

This indicator calculates and plots the daily, weekly, and monthly pivot points by averaging the previous period's high, low, and closing prices.

Waddah Attar Reverse RSI
Indicator

Waddah Attar Reverse RSI

iRSI

This indicator calculates the complementary value of the Relative Strength Index to visualize downward momentum shifts and overextended price cooling.

Waddah Attar RSI Level
Indicator

Waddah Attar RSI Level

iRSI

This indicator projects dynamic price levels by mathematically extrapolating the relationship between Relative Strength Index fluctuations and actual price movements on a daily timeframe.

Waddah Attar Scalping
Indicator

Waddah Attar Scalping

The indicator identifies synchronized bullish or bearish momentum by calculating the cumulative variance between current prices and multi-period high-low averages across two distinct timeframes.

Waddah Attar Strong Level
Indicator

Waddah Attar Strong Level

This indicator projects synchronized horizontal boundaries across daily, H4, weekly, and monthly periods by calculating price differentials between previous candle closes to identify significant supply and demand zones.

Waddah Attar Super Support Resistance
Indicator

Waddah Attar Super Support Resistance

iRSI

This indicator dynamically projects a comprehensive structural grid by aggregating Fibonacci retracements, Pivot Points, Camarilla levels, and RSI-based price conversions onto historical daily open data.

Waddah Attar Weekly Fibo
Indicator

Waddah Attar Weekly Fibo

This indicator dynamically maps weekly high and low boundaries to project precise retracement levels and calculate the current price percentage within the periodic volatility range.