TrendManagerOpen2 seperate window1
Download script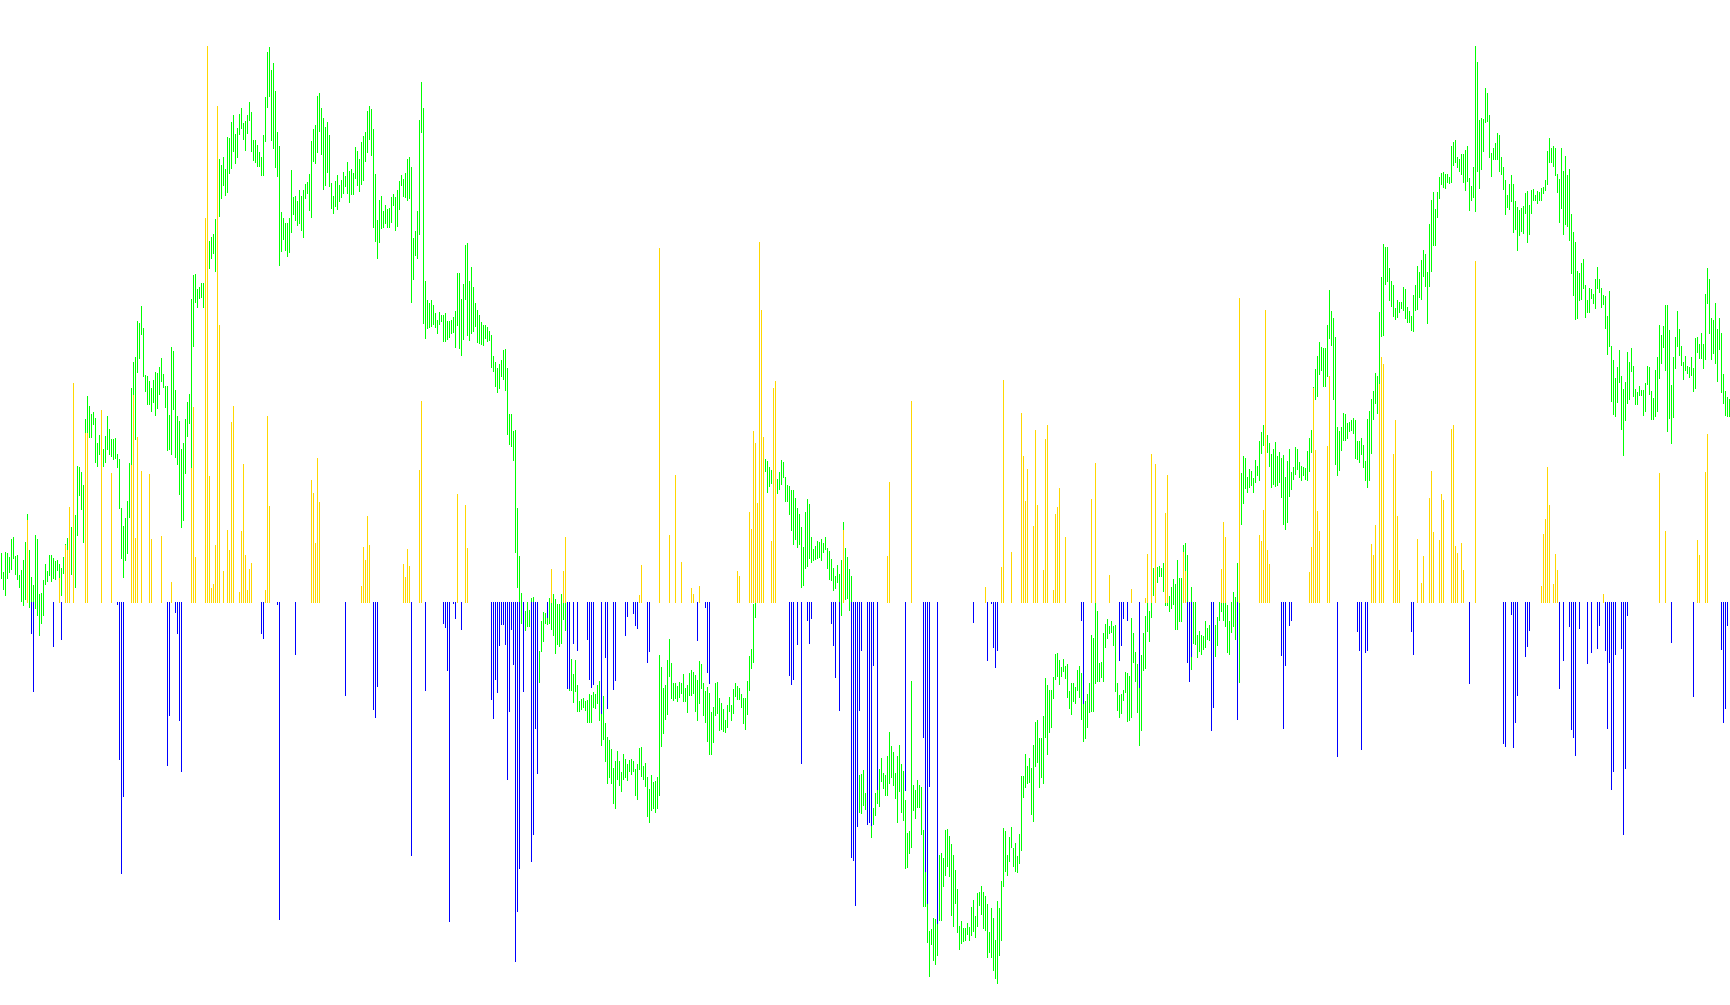
This tool is designed to help traders visualize market trends by analyzing price movements across two different timeframes simultaneously. Instead of looking at standard price action, it focuses on the "middle price" (the average between the highest high and the lowest low) over specific periods to filter out market noise.
How the Logic Works
The script operates by calculating trend data for two distinct settings, which can be thought of as a "short-term" view and a "long-term" view. Here is the step-by-step breakdown of how it processes information:
1. Establishing the Reference Points For both the short-term and long-term views, the tool identifies the highest price reached and the lowest price reached over a set number of candles (periods). It then calculates the midpoint between these two extremes. This provides a smoothed representation of where the "center" of the price action is located.
2. Measuring Movement (Momentum) The tool compares the current midpoint to a previous midpoint (based on a user-defined shift). By subtracting the old midpoint from the new one, it determines the direction and strength of the movement:
- If the value is positive, the price is moving upward.
- If the value is negative, the price is moving downward.
3. Determining Trend Agreement The core logic relies on "confluence"—meaning both timeframes must agree before a signal is shown. The script looks at the movement of both the short-term and long-term views:
- Neutral Zone: If the short-term view is moving up while the long-term view is moving down (or vice versa), the signals cancel each other out. In these cases, the indicator shows nothing (a flat line).
- Trend Confirmation: If both timeframes are moving in the same direction at the same time, the tool confirms a trend.
4. Visual Representation Once a confirmed trend is identified, the tool calculates the average strength of that move and plots it in a separate window as a histogram:
- Blue Histogram: Represents a confirmed upward trend where both periods are gaining momentum.
- Red Histogram: Represents a confirmed downward trend where both periods are losing momentum.
Summary for the Trader
Essentially, this script acts as a filter. It ignores "choppy" price action where short-term gains are offset by long-term losses. It only provides a visual signal when both the immediate price action and the broader market trend are moving in harmony, helping you stay aligned with the dominant direction of the market.
// Trend Manager Open2 separate window.mq4
//
// Look & Feel of original based on indicator sold at traderstradingsystem.com
// this one plots in lower histogram window.

// No representation it is identical.
// This file is licensed under the terms of the GNU General Public License V2.
//
// (c) 2006 Matt Kennel (mbkennel@gmail.com)

#property indicator_separate_window
#property indicator_buffers 2
#property indicator_color1 Red
#property indicator_color2 Blue


extern int TM_Period_1 = 7;
extern int TM_Shift_1 = 2;
extern int TM_Period_2 = 13; // Put TM_Period_2 params equal to first to get orig TrendManager system
extern int TM_Shift_2 = 1;

int Max_Period;
int Max_Shift;

double Up_Histogram[];
double Down_Histogram[];

int a_begin;

int init()
{
   Max_Shift = MathMax(TM_Shift_1,TM_Shift_2);
   Max_Period = MathMax(TM_Period_1,TM_Period_2);

   int b_begin = Max_Period+Max_Shift-1;

   SetIndexStyle(1,DRAW_HISTOGRAM,STYLE_SOLID);
   SetIndexBuffer(1,Down_Histogram);
   SetIndexDrawBegin(1,b_begin);
   SetIndexLabel(1,"TM_Period+");

   SetIndexStyle(0,DRAW_HISTOGRAM,STYLE_SOLID);
   SetIndexBuffer(0,Up_Histogram);
   SetIndexDrawBegin(0,b_begin);
   SetIndexLabel(0,"TM_Period");

   return(0);
}

int start()
{
   int    i,k;
   int    counted_bars=IndicatorCounted();
   double high,low,price;

   if(Bars<=Max_Period) return(0);

   i=Bars-Max_Period;
   if(counted_bars>Max_Period) i=Bars-counted_bars-1;
   while(i>=0)
   {

      double M1, M1b;
      double M2, M2b;

      M1 = MiddlePrice(TM_Period_1,i);
      M1b = MiddlePrice(TM_Period_1,i+TM_Shift_1);
      M2 = MiddlePrice(TM_Period_2,i);
      M2b = MiddlePrice(TM_Period_2,i+TM_Shift_2);

      //
      double diff1 = (M1-M1b); // up or down on short term;
      double diff2 = (M2-M2b); // up or down on longer term.
      // each has three choices, hence six possibilities.


      if (diff1*diff2 <= 0.0) { // opposite signs
         Down_Histogram[i] = 0.0;
         Up_Histogram[i] = 0.0;
      } else {
         double diff = 0.5* (M1+M2 - M1b-M2b);
         if (diff >= 0) {
            Up_Histogram[i]=diff;
            Down_Histogram[i]=0.0;
         } else {
            Up_Histogram[i] = 0.0;
            Down_Histogram[i]=diff;
         }
      }


      i--;
   }

   return(0);
}

double MiddlePrice(int nback, int shift) {
  double H = High[Highest(NULL,0,MODE_HIGH,nback,shift)];
  double L = Low[Lowest(NULL,0,MODE_LOW,nback,shift)];
  return( 0.5*(H+L));

}
Comments