TrendStrengthTrio_v1
Download script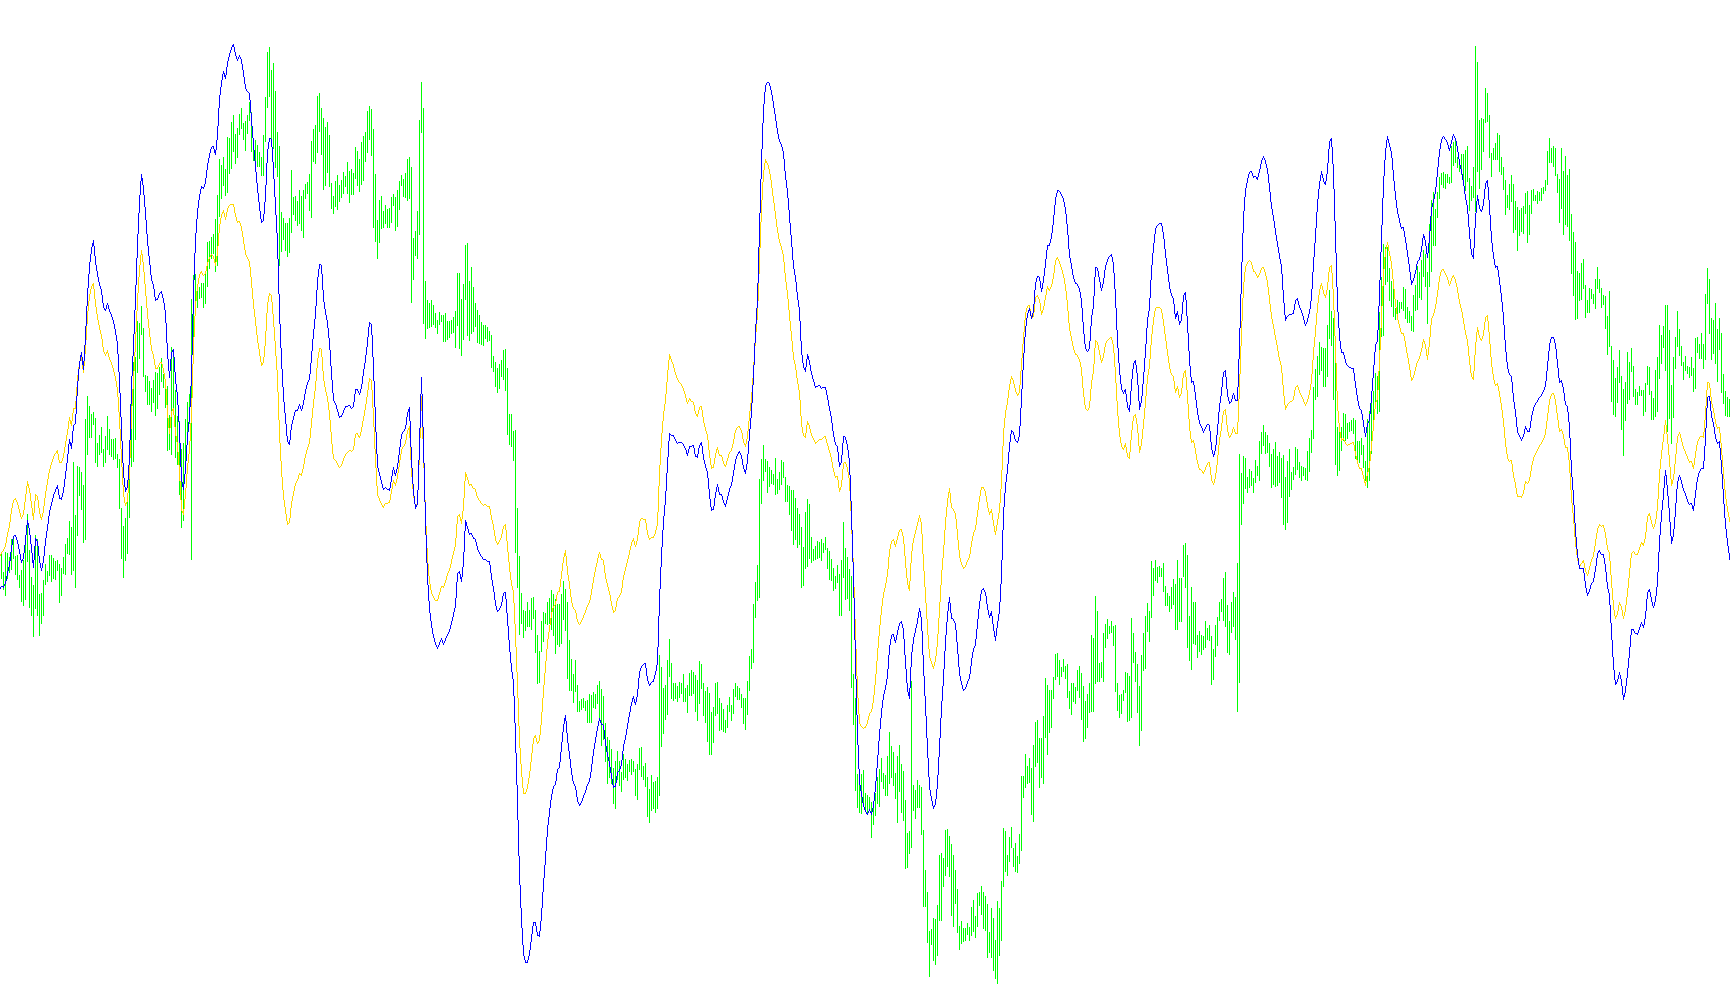
This tool is designed to help traders visualize and identify the underlying momentum and strength of a market trend by analyzing how different price averages interact with one another. Instead of looking at a single moving average, this script examines the "gap" between several layers of averages simultaneously.
How it Works
The logic operates by calculating a series of Exponential Moving Averages (EMAs) based on weighted price data. It specifically focuses on the distance between a very short-term average and a variety of longer-term averages.
For every point on the chart, the script performs the following steps:
- Baseline Identification: It establishes a primary, very fast moving average to act as a reference point.
- Comparative Analysis: It then calculates several other moving averages at increasing intervals (multiples of a user-defined "Step").
- Difference Calculation: The script subtracts these longer-term averages from the primary short-term average. This effectively measures how far the current price trend has stretched away from its historical mean.
- Aggregation: It sums up these differences across ten different intervals to create a single "Strength" value.
The Visual Output
The script produces three distinct lines (labeled TS1, TS2, and TS3) on a separate window below the main price chart:
- TS1 (Red Line): This is the primary calculation based on the initial set of intervals. It provides the first layer of trend strength data.
- TS2 (Black Line): This represents the same logic but calculated using an expanded range of intervals. It offers a broader perspective on the trend.
- TS3 (Green Line): Depending on your settings, this provides a third, even wider perspective of the trend's movement.
Key Takeaways for the User
By observing these lines, you are looking at a composite measurement of "momentum." When these lines move significantly, they indicate that the current trend is pulling away from its averages with considerable force. Because the script uses weighted price data and multiple intervals, it aims to provide a smoother, more comprehensive view of trend intensity than a standard single moving average could offer on its own.
//+------------------------------------------------------------------+
//|                                            TrendStrengthTrio.mq4 |
//|                      Copyright © 2006, MetaQuotes Software Corp. |
//|                                        http://www.metaquotes.net |
//+------------------------------------------------------------------+
#property copyright "Copyright © 2006, MetaQuotes Software Corp."
#property link      "http://www.metaquotes.net"
//----
#property indicator_separate_window
#property indicator_buffers 3
#property indicator_color1 Red
#property indicator_color2 Black
#property indicator_color3 Green
//---- input parameters
extern bool      Line2Visible=true;
extern bool      Line3Visible=false;
extern int       Step=5;
//----
double TS1[];
double TS2[];
double TS3[];
//+------------------------------------------------------------------+
//| Custom indicator initialization function                         |
//+------------------------------------------------------------------+
int init()
  {
   IndicatorBuffers(3);
   IndicatorShortName("TrendStrengthTrio");
   SetIndexBuffer(0,TS1);
   SetIndexStyle(0, DRAW_LINE);
   SetIndexLabel(0,"TS1");
   SetIndexBuffer(1,TS2);
   SetIndexStyle(1, DRAW_LINE);
   SetIndexLabel(1,"TS2");
   SetIndexBuffer(2,TS3);
   SetIndexStyle(2, DRAW_LINE);
   SetIndexLabel(3,"TS3");
   return(0);
  }
//+------------------------------------------------------------------+
//| Custor indicator deinitialization function                       |
//+------------------------------------------------------------------+
int deinit()
  {
//----
//----
   return(0);
  }
//+------------------------------------------------------------------+
//| Custom indicator iteration function                              |
//+------------------------------------------------------------------+
int start()
  {
   int    mode, shift,counted_bars=IndicatorCounted();
   //double ma40dbl;
   double ma0, ma1, ma2, ma3, ma4, ma5, ma6, ma7, ma8, ma9, ma10, tmp;
   int tmpstep;
//---- check for possible errors
   if(counted_bars<0) return(-1);
//---- last counted bar will be recounted
   if(counted_bars>0) counted_bars--;
   //limit=Bars-counted_bars;
   tmpstep=Step;
   for(int s=1; s<=4; s++)
     {
      shift=Bars-1;
      while(shift>=0)
        {
         mode=MODE_EMA;
         tmp=iMA(NULL,0,5,0,mode,PRICE_WEIGHTED,shift);
         ma1=tmp-iMA(NULL,0,tmpstep,0,mode,PRICE_WEIGHTED,shift);
         ma2=tmp-iMA(NULL,0,tmpstep*2,0,mode,PRICE_WEIGHTED,shift);
         ma3=tmp-iMA(NULL,0,tmpstep*3,0,mode,PRICE_WEIGHTED,shift);
         ma4=tmp-iMA(NULL,0,tmpstep*4,0,mode,PRICE_WEIGHTED,shift);
         ma5=tmp-iMA(NULL,0,tmpstep*5,0,mode,PRICE_WEIGHTED,shift);
         ma6=tmp-iMA(NULL,0,tmpstep*6,0,mode,PRICE_WEIGHTED,shift);
         ma7=tmp-iMA(NULL,0,tmpstep*7,0,mode,PRICE_WEIGHTED,shift);
         ma8=tmp-iMA(NULL,0,tmpstep*8,0,mode,PRICE_WEIGHTED,shift);
         ma9=tmp-iMA(NULL,0,tmpstep*9,0,mode,PRICE_WEIGHTED,shift);
         ma10=tmp-iMA(NULL,0,tmpstep*10,0,mode,PRICE_WEIGHTED,shift);
//----
         if (s==1) {TS1[shift]=ma1+ma2+ma3+ma4+ma5+ma6+ma7+ma8+ma9+ma10;}
         if ((s==2) && (Line2Visible==true)) {TS2[shift]=ma1+ma2+ma3+ma4+ma5+ma6+ma7+ma8+ma9+ma10;}
         if ((s==3) && (Line3Visible==true)) {TS3[shift]=ma1+ma2+ma3+ma4+ma5+ma6+ma7+ma8+ma9+ma10;}
         shift--;//
        }
      tmpstep+=Step;
     }
   return(0);
  }
//+------------------------------------------------------------------+
Comments