TrendManager Candle x 2
Download script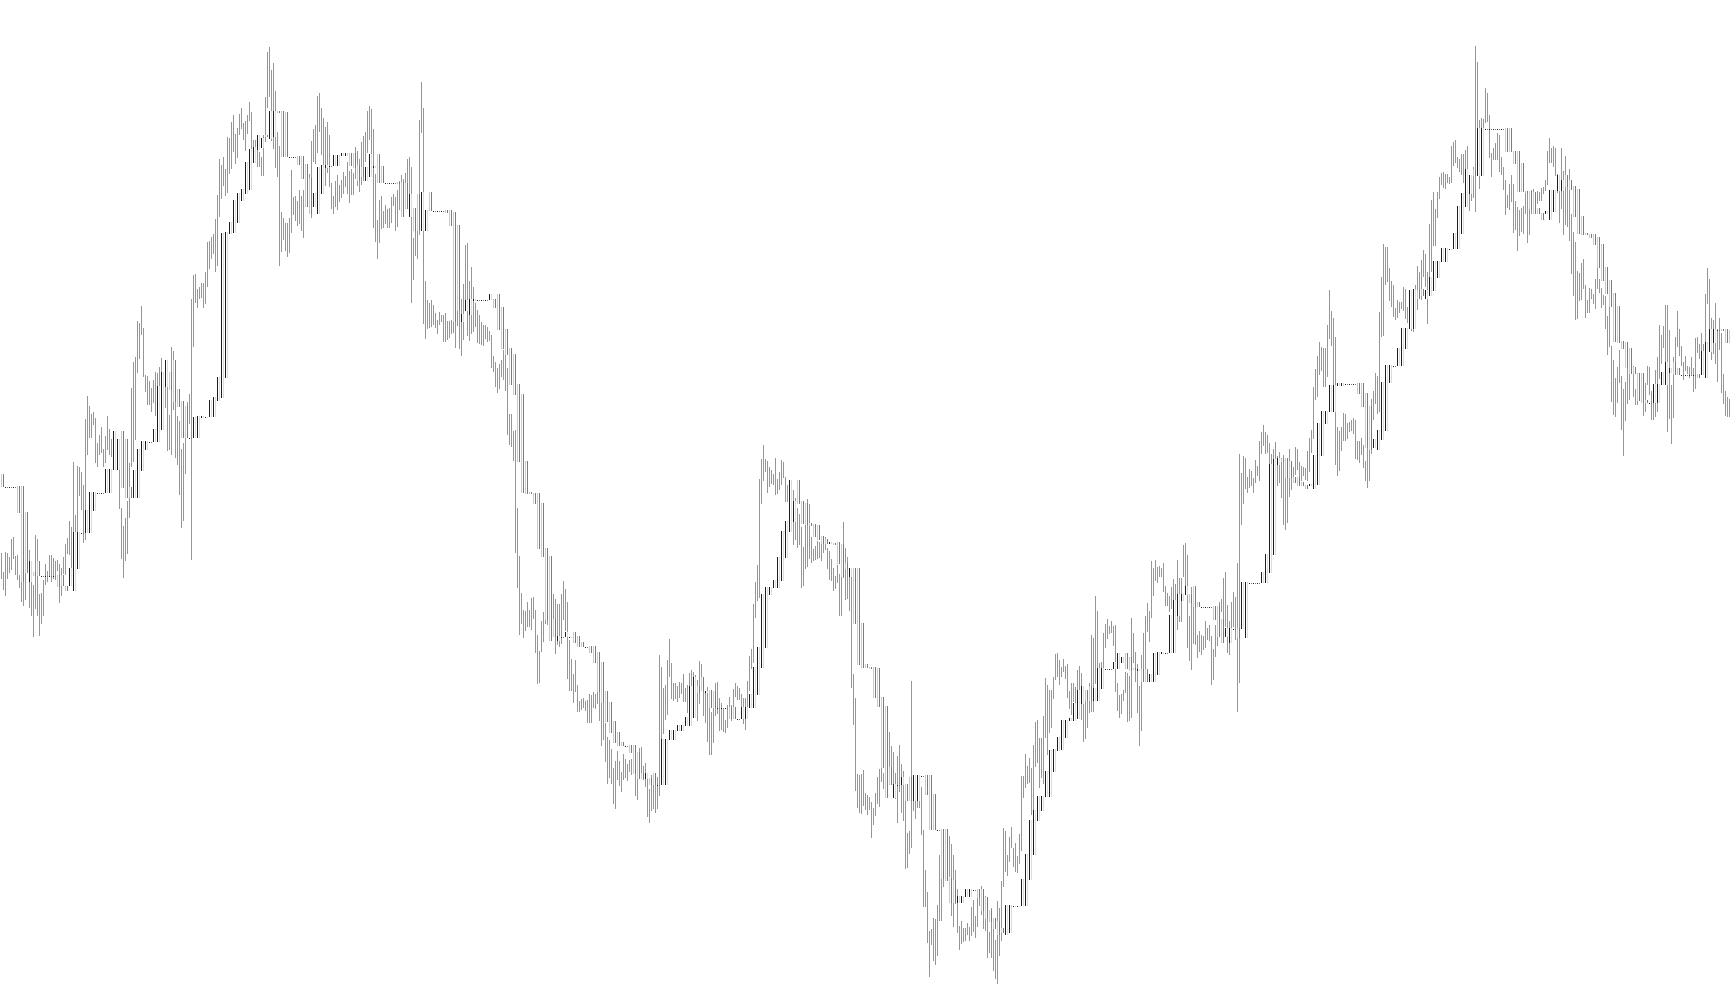
The Trend Manager is a visual analysis tool designed to help traders identify and track market momentum by smoothing out price fluctuations. Instead of looking at the jagged, rapid movements of individual price candles, this script interprets the underlying "flow" of the market to provide a clearer picture of where the trend is heading.
How the Logic Works
The core functionality of this tool relies on three main components: identifying price extremes, calculating central values, and establishing a visual relationship between different timeframes.
1. Identifying Key Price Points The script looks at specific windows of historical data to determine the highest and lowest prices reached during those periods. Rather than just looking at the most recent price, it scans backward to capture the "peaks" and "valleys" of the market movement.
2. Establishing the Centerline (Span A) By identifying these highs and lows over a user-defined period, the tool calculates the midpoint—the average value between the top and bottom of that range. This creates a baseline that represents the "equilibrium" of the current price action. As the market moves, this centerline shifts to follow the prevailing direction.
3. Creating Time Offsets (Span B) To provide more context, the tool creates a second line (Span B) based on a shifted version of the primary centerline. By comparing the current equilibrium with a slightly delayed version of itself, the script helps visualize the acceleration or deceleration of the trend.
4. Visualizing the Trend Flow The final output is rendered as a series of histograms that fill the space between these different calculation points. This creates a visual "ribbon" or "channel":
- When the primary and secondary lines move in harmony, it signals a stable trend.
- The widening or narrowing of the space between these lines can provide hints about market volatility and strength.
Summary for the Trader
Essentially, this tool acts as a filter. It removes the "noise" of minor price ticks and highlights the structural movement of the market. By observing how the colored histograms expand, contract, and shift directions, traders can better visualize whether the current momentum is strengthening in one direction or beginning to lose steam.
// Trend Manager.mq4
// Based on indicator sold at traderstradingsystem.com

#property indicator_chart_window
#property indicator_buffers 4
#property indicator_color1 Red
#property indicator_color2 Blue
#property indicator_color3 Blue
#property indicator_color4 Red

extern int TM_Period = 7;
extern int TM_Shift = 2;

double SpanA_Buffer[];
double SpanB_Buffer[];
double AFill_Buffer[];
double BFill_Buffer[];

int a_begin;

int init()
{
   a_begin=TM_Shift;
   SetIndexStyle(0,DRAW_HISTOGRAM,STYLE_SOLID);
   SetIndexBuffer(0,SpanB_Buffer);
   SetIndexDrawBegin(0,TM_Period+a_begin-1);
   SetIndexLabel(0,"TM_Period_A");

   SetIndexStyle(1,DRAW_HISTOGRAM,STYLE_SOLID);
   SetIndexBuffer(1,SpanA_Buffer);
   SetIndexDrawBegin(1,TM_Period+a_begin-1);
   SetIndexLabel(1,"TM_Period_B");

   SetIndexStyle(2,DRAW_HISTOGRAM,STYLE_SOLID);
   SetIndexBuffer(2,AFill_Buffer);
   SetIndexDrawBegin(2,TM_Period+a_begin-1);
   SetIndexLabel(2,"TM_Period_AFill");

   SetIndexStyle(3,DRAW_HISTOGRAM,STYLE_SOLID);
   SetIndexBuffer(3,BFill_Buffer);
   SetIndexDrawBegin(3,TM_Period+a_begin-1);
   SetIndexLabel(3,"TM_Period_BFill");

   return(0);
}

int start()
{
   int    i,k;
   int    counted_bars=IndicatorCounted();
   double high,low,price;

   if(Bars<=TM_Period) return(0);
   if(counted_bars<1)
   {
      for(i=1;i<=TM_Period;i+=2)
      {
         SpanA_Buffer[Bars-i]=0;
         SpanB_Buffer[Bars-i]=0;
      }
   }

   i=Bars-TM_Period;
   if(counted_bars>TM_Period) i=Bars-counted_bars-1;
   while(i>=0)
   {
      high=High[iHighest(NULL,0,MODE_HIGH,2,i)];
      low=Low[iLowest(NULL,0,MODE_LOW,2,i)];
      k=i-2+(TM_Period*2);
      while(k>=i)
      {
         price=High[iHighest(NULL,0,MODE_HIGH,2,k)];
         if(high<price) high=price;
         price=Low[iLowest(NULL,0,MODE_LOW,2,k)];
         if(low>price)  low=price;
         k-=2;
      }
      SpanA_Buffer[i]  = (high+low)/2.0;
      SpanB_Buffer[i]  = SpanA_Buffer[i+(TM_Shift*2)];
      AFill_Buffer[i-1] = SpanA_Buffer[i];
      BFill_Buffer[i-1] = SpanB_Buffer[i];
      i-=2;
   }

   return(0);
}
Comments