Trendlines_v2
Download script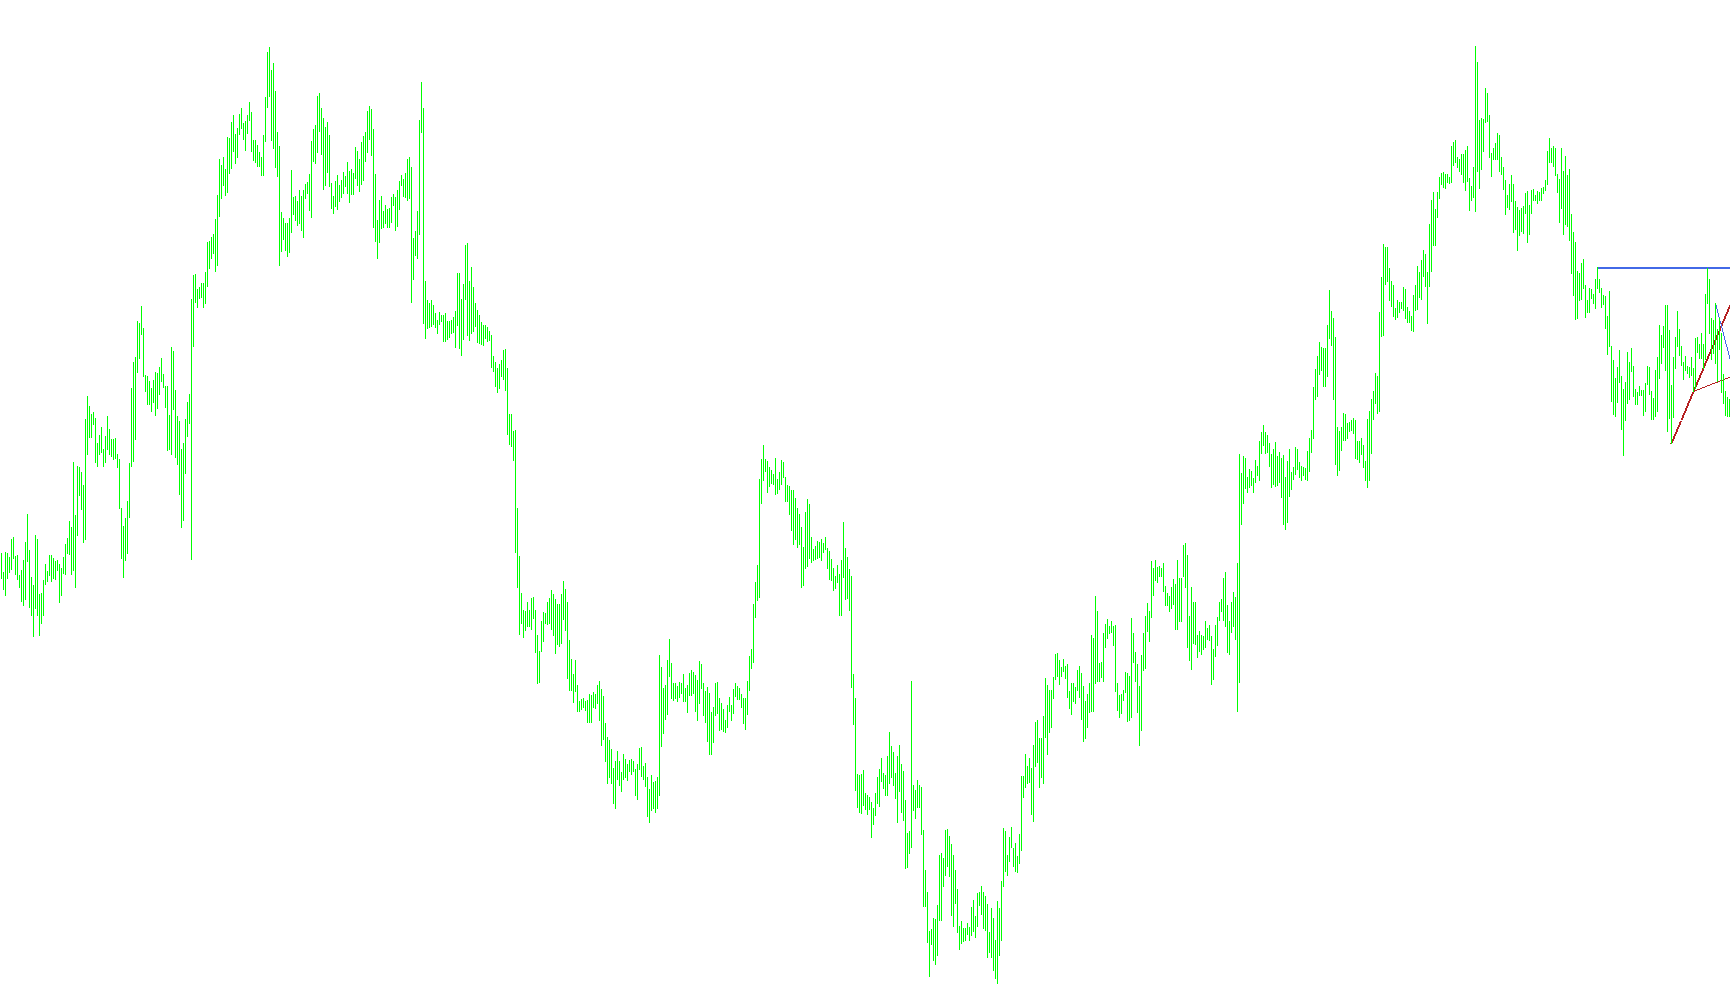
This script is designed to automatically identify and display key trendlines on your trading chart. It simplifies market analysis by highlighting major "Support" and "Resistance" levels across different timeframes, helping traders visualize where price has historically struggled to break through or where it may find a floor.
Core Functionality
The script operates by scanning historical price data to locate significant structural peaks and valleys. Here is a breakdown of how the logic works:
1. Multi-Timeframe Awareness The tool is "context-aware." Depending on which timeframe you currently have open on your chart (e.g., 5-minute, 15-minute, 1-hour, or 4-hour), the script automatically decides which trendlines are most relevant to show you. For example:
- If you are viewing a 5-minute chart, it will display trends from the 15-minute timeframe.
- If you are viewing a 15-minute chart, it will display trends from both the 1-hour and 15-minute timeframes.
- This ensures that while you are looking at short-term movements, you remain aware of the broader market structure.
2. Identification of Peaks and Valleys To draw a trendline, the script looks for two specific types of price points:
- Higher Highs (Resistance): It searches for "peaks"—points where the price was significantly higher than the bars immediately preceding and following it. These are used to establish resistance lines.
- Lower Lows (Support): It searches for "valleys"—points where the price dropped lower than the surrounding bars. These are used to establish support lines.
3. Dynamic Trendline Drawing Once the script identifies these peaks and valleys, it performs the following actions:
- Visual Styling: It differentiates the timeframes visually. For instance, 4-hour trends might appear as solid thick lines, while 15-minute trends might appear as dashed or dotted lines. This allows you to distinguish between "major" and "minor" market structures at a glance.
- Color Coding: Resistance levels (ceilings) are typically displayed in blue tones, while Support levels (floors) are displayed in red/brick tones.
- Projection: The trendlines are set as "rays," meaning they project forward into the future based on the angle established by the historical data points.
4. Data Alignment One of the most sophisticated parts of the logic is its ability to map data from different timeframes onto your current chart accurately. If you are looking at a 5-minute chart but the script is calculating a trend for the 1-hour timeframe, it performs a calculation to ensure the line starts and ends at the exact correct historical prices, even though the "bars" on your screen are much smaller than the bars used to calculate the trend.
Summary for the Trader
Instead of you having to manually click and drag lines to find old highs and lows, this script constantly monitors the data. It automatically draws the most important trendlines based on your current view, providing a clean, organized map of market history that helps you identify potential areas of interest for future trades.
//+------------------------------------------------------------------+
//|                                                   Trendlines.mq4 |
//|                                      Copyright © 2006, John Hitt |
//|                                           jhitt@kanji.dyndns.org |
//+------------------------------------------------------------------+
#property copyright "Copyright © 2006, John Hitt"
#property link      "jhitt@kanji.dyndns.org"

#property indicator_chart_window

extern color H4_R=RoyalBlue;
extern color H4_S=FireBrick;
extern color H1_R=RoyalBlue;
extern color H1_S=FireBrick;
extern color M15_R=RoyalBlue;
extern color M15_S=FireBrick;

#define RESISTANCE 1
#define SUPPORT 2

//+------------------------------------------------------------------+
//| Custom indicator initialization function                         |
//+------------------------------------------------------------------+
int init()
  {
//---- indicators

//----
   return(0);
  }
//+------------------------------------------------------------------+
//| Custom indicator deinitialization function                       |
//+------------------------------------------------------------------+
int deinit()
  {
//----
   ObjectDelete("H4_R");
   ObjectDelete("H4_S");
   ObjectDelete("H1_R");
   ObjectDelete("H1_S");
   ObjectDelete("M15_R");
   ObjectDelete("M15_S");
   ObjectDelete("M5_R");
   ObjectDelete("M5_S");
//----
   return(0);
  }
//+------------------------------------------------------------------+
//| Custom indicator iteration function                              |
//+------------------------------------------------------------------+
int start()
  {
   datetime currentbar = 0;

   if (currentbar != Time[0])
   {
      switch (Period())
      {
         case PERIOD_H4:
            Draw_H4_Trends();
            break;
         case PERIOD_H1:
            Draw_H4_Trends();
            Draw_H1_Trends();
            break;
         case PERIOD_M15:
            Draw_H1_Trends();
            Draw_M15_Trends();
            break;
         case PERIOD_M5:
            Draw_M15_Trends();
            break;
       }
   }

   return(0);
  }


void Draw_M15_Trends()
{
   int sbar=0;
   int ebar=0;
   int i;
   double rate_array[][6];

   ArrayCopyRates(rate_array, Symbol(), PERIOD_M15);

   for (i=2; i < Bars; i++)
   {
      if (HigherHigh(i, 1, rate_array) == true)
      {
        //Print("HiherHigh: ", i);
        if (ebar == 0)
          ebar = i;
        else if (sbar == 0 && rate_array[i][3] > rate_array[ebar][3]) // use 3 for high
          sbar = i;
      }
      if (sbar !=0 && ebar !=0)
         break;
   }
   DrawTrendline ("M15_R", ebar, sbar, PERIOD_M15, RESISTANCE, rate_array);

   ebar = 0;
   sbar = 0;

   for (i=2; i < Bars; i++)
   {
      if (LowerLow(i, 1, rate_array) == true)
      {
        if (ebar == 0)
          ebar = i;
        else if (sbar == 0 && rate_array[i][2] < rate_array[ebar][2]) // use 2 for low
          sbar = i;
      }
      if (sbar !=0 && ebar !=0)
         break;
   }
   DrawTrendline ("M15_S", ebar, sbar, PERIOD_M15, SUPPORT, rate_array);

}

void Draw_H1_Trends()
{
   int sbar=0;
   int ebar=0;
   int i;
   double rate_array[][6];

   ArrayCopyRates(rate_array, Symbol(), PERIOD_H1);

   for (i=2; i < Bars; i++)
   {
      if (HigherHigh(i, 1, rate_array) == true)
      {
        //Print("HiherHigh: ", i);
        if (ebar == 0)
          ebar = i;
        else if (sbar == 0 && rate_array[i][3] > rate_array[ebar][3]) // use 3 for high
          sbar = i;
      }
      if (sbar !=0 && ebar !=0)
         break;
   }
   DrawTrendline ("H1_R", ebar, sbar, PERIOD_H1, RESISTANCE, rate_array);

   ebar = 0;
   sbar = 0;

   for (i=2; i < Bars; i++)
   {
      if (LowerLow(i, 1, rate_array) == true)
      {
        if (ebar == 0)
          ebar = i;
        else if (sbar == 0 && rate_array[i][2] < rate_array[ebar][2]) // use 2 for low
          sbar = i;
      }
      if (sbar !=0 && ebar !=0)
         break;
   }
   DrawTrendline ("H1_S", ebar, sbar, PERIOD_H1, SUPPORT, rate_array);

}

void Draw_H4_Trends()
{
   int sbar=0;
   int ebar=0;
   int i;
   double rate_array[][6];

   ArrayCopyRates(rate_array, Symbol(), PERIOD_H4);

   for (i=2; i < Bars; i++)
   {
      if (HigherHigh(i, 1, rate_array) == true)
      {
        //Print("HiherHigh: ", i);
        if (ebar == 0)
          ebar = i;
        else if (sbar == 0 && rate_array[i][3] > rate_array[ebar][3]) // use 3 for high
          sbar = i;
      }
      if (sbar !=0 && ebar !=0)
         break;
   }
   DrawTrendline ("H4_R", ebar, sbar, PERIOD_H4, RESISTANCE, rate_array);

   ebar = 0;
   sbar = 0;

   for (i=2; i < Bars; i++)
   {
      if (LowerLow(i, 1, rate_array) == true)
      {
        if (ebar == 0)
          ebar = i;
        else if (sbar == 0 && rate_array[i][2] < rate_array[ebar][2]) // use 2 for low
          sbar = i;
      }
      if (sbar !=0 && ebar !=0)
         break;
   }
   DrawTrendline ("H4_S", ebar, sbar, PERIOD_H4, SUPPORT, rate_array);
}

 bool HigherHigh (int point, int shift, double array[][6])
  {
    if (shift == 0)
     return (true);

    if (array[point][3] >= array[point+shift][3] && array[point][3] >= array[point-shift][3])
    {
      if (array[point][3] == array[point+shift][3] || array[point][3] == array[point-shift][3])
      {
        if ((point - shift - 1) == 0)
          return (false);
        if (array[point][3] > array[point+shift+1][3] && array[point][3] > array[point-shift-1][3])
          return (HigherHigh (point, shift-1, array));
        else
          return (false);
      } else {
        return (HigherHigh (point, shift-1, array));
      }
    }
    else
      return (false);
  }

  bool LowerLow (int point, int shift, double array[][6])
  {
    if (shift == 0)
     return (true);

    if (array[point][2] <= array[point+shift][2] && array[point][2] <= array[point-shift][2])
    {
      if (array[point][2] == array[point+shift][2] || array[point][2] == array[point-shift][2])
      {
        if ((point-shift-1) == 0)
         return (false);
        if (array[point][2] < array[point+shift+1][2] && array[point][2] < array[point-shift-1][2])
          return(LowerLow (point, shift-1, array));
        else
          return (false);
      } else {
        return(LowerLow (point, shift-1, array));
      }
    }
    else
      return (false);
  }

 int GetRealPosition(int p1, double array[][6], int which, datetime value, double peak)
 {
   int i;

   for (i=0; i < Bars; i++)
   {
     if (array[i][0] == value || array[i][0] < value)
     {
        if (which == RESISTANCE)
        {
          if (array[i][3] == peak) return (i);
          if (array[i-1][3] == peak) return (i-1);
          if (array[i-2][3] == peak) return (i-2);
          if (array[i-3][3] == peak) return (i-3);
         } else {
          if (array[i][2] == peak) return (i);
          if (array[i-1][2] == peak) return (i-1);
          if (array[i-2][2] == peak) return (i-2);
          if (array[i-3][2] == peak) return (i-3);
         }
         if (array[i][0] < value) return (i);
     }
   }
   return (-1);
}

 int DrawTrendline (string name, int p1, int p2, int timeframe, int which, double r_array[][6])
 {
   color hue;
   int thickness = 1;
   int style = STYLE_DASH;
   double array[][6];

   ArrayCopyRates(array, Symbol(), Period());

   if (which == RESISTANCE)
   {
     hue = RoyalBlue;
     if (Period() != timeframe)
     {
       p1 = GetRealPosition(p1, array, which, r_array[p1][0], r_array[p1][3]);
       p2 = GetRealPosition(p2, array, which, r_array[p2][0], r_array[p2][3]);
     }
   }
   else
   {
     hue = FireBrick;
     if (Period() != timeframe)
     {
       p1 = GetRealPosition(p1, array, which, r_array[p1][0], r_array[p1][2]);
       p2 = GetRealPosition(p2, array, which, r_array[p2][0], r_array[p2][2]);
     }
   }

   switch(timeframe)
   {
      case PERIOD_H4:
         thickness = 2;
         style = STYLE_SOLID;
         if (which == RESISTANCE)
           hue = H4_R;
         else
           hue = H4_S;
         break;
      case PERIOD_H1:
         style = STYLE_SOLID;
         thickness = 1;
         if (which == RESISTANCE)
           hue = H1_R;
         else
           hue = H1_S;
         break;
      case PERIOD_M15:
         style = STYLE_DASHDOTDOT;
         thickness = 1;
         if (which == RESISTANCE)
           hue = M15_R;
         else
           hue = M15_S;
         break;
   }

   if (ObjectFind(name) < 0)
   {
     if (which == SUPPORT)
       ObjectCreate(name, OBJ_TREND, 0, array[p2][0], array[p2][2], array[p1][0], array[p1][2]);
     else
       ObjectCreate(name, OBJ_TREND, 0, array[p2][2], array[p2][3], array[p1][0], array[p1][3]);

     ObjectSet(name, OBJPROP_COLOR, hue);
     ObjectSet(name, OBJPROP_RAY, true);
     ObjectSet(name, OBJPROP_BACK, true);
     ObjectSet(name, OBJPROP_WIDTH, thickness);
     ObjectSet(name, OBJPROP_STYLE, style);
   }

   if (which == SUPPORT)
   { // Lows (0 == Time)
     ObjectMove (name, 0, array[p2][0], array[p2][2]);
     ObjectMove (name, 1, array[p1][0], array[p1][2]);
   }
   else
   { // Highs
     ObjectMove (name, 0, array[p2][0], array[p2][3]);
     ObjectMove (name, 1, array[p1][0], array[p1][3]);
   }

   ObjectsRedraw();
   return(0);
 }
Comments