TrendScalpIndc_PP_v1
Download script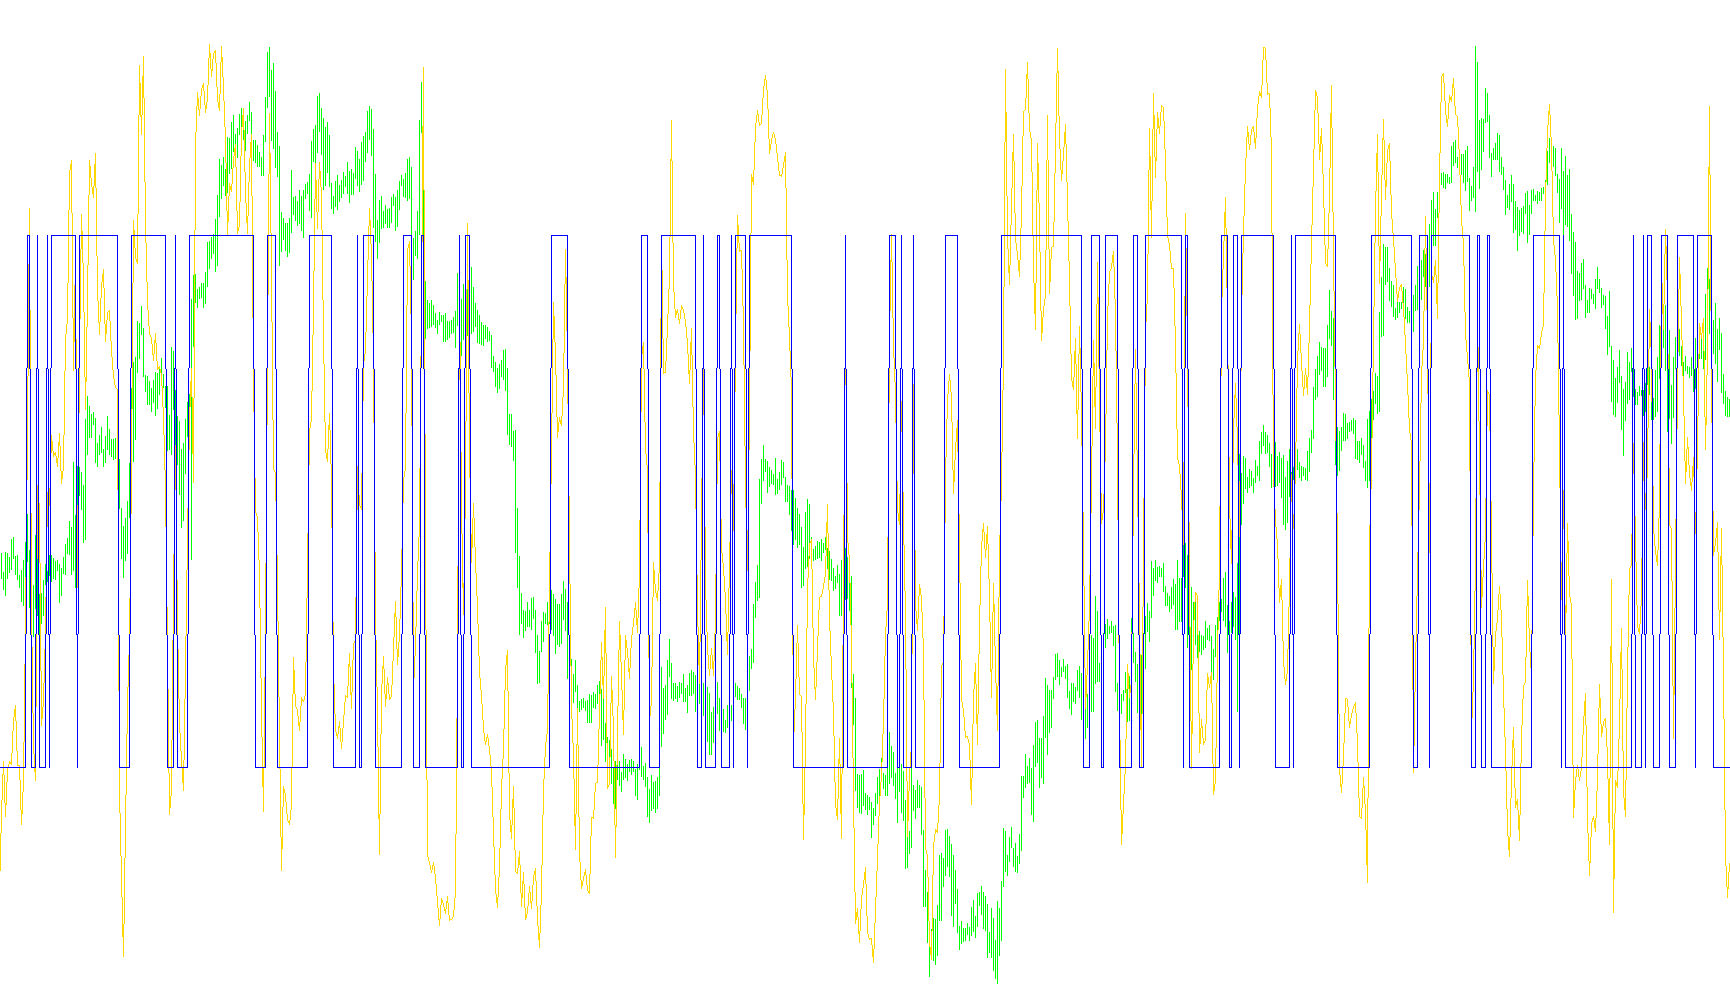
This script is designed to help traders visualize market momentum and identify trend direction by measuring the relative "strength" of buyers versus sellers over specific timeframes. Instead of simply looking at current price action, it analyzes the relationship between recent price extremes and historical highs/lows to determine who is currently in control of the market.
Core Logic and Mechanism
The indicator operates by calculating two primary forces: Buy Power and Sell Power.
- Buy Power: This is calculated by looking at the highest price reached in the immediate past and comparing it against a lower price point from a slightly older period.
- Sell Power: Conversely, this looks at the highest price from an older period compared against the lowest price reached in the most recent period.
By measuring these two forces against each other, the script produces a percentage-based value (the TrendTrend Follower). This value tells you the "imbalance" of the market:
- If the result is positive, it indicates that buying momentum is prevailing.
- If the result is negative, it suggests that selling pressure is dominant.
Visual Output and Filtering
The script provides two distinct visual layers to help with decision-making:
- Momentum Line: This represents the raw percentage of trend strength. It allows you to see how quickly the market is shifting from one sentiment to another.
- Trend Extremes: The script includes a secondary logic that maps these values to specific levels (100 and -100). This acts as a clear visual boundary, highlighting when the trend reaches significant intensity in either direction.
Advanced Smoothing
For traders who find standard market movements too "noisy" or erratic, the script includes an optional smoothing mechanism (the T3 Smoothing logic). When activated, it processes the raw momentum data through a sophisticated mathematical filter. This filters out minor price fluctuations (market noise) while preserving the integrity of the primary trend, resulting in a much smoother, more readable line that is easier to use for identifying long-term direction.
Key Summary for Traders
Essentially, this tool acts as a "tug-of-war" indicator. It identifies which side—the buyers or the sellers—is pulling harder based on recent price peaks and valleys. By providing both a raw momentum flow and a smoothed version of that data, it helps traders stay aligned with the prevailing market trend while filtering out unnecessary volatility.
/*-----------------------------+
|			       |
| Shared by www.Aptrafx.com    |
|			       |
+------------------------------*/

//+------------------------------------------------------------------+
//|                                               TrendScalpIndc.mq4 |
//|                      Copyright © 2005, MetaQuotes Software Corp. |
//|                                        http://www.metaquotes.net |
//+------------------------------------------------------------------+
#property copyright "Copyright © 2005, MetaQuotes Software Corp."
#property link      "http://www.metaquotes.net"

#property indicator_separate_window
#property indicator_buffers 2
#property indicator_color1 DeepSkyBlue
#property indicator_color2 RoyalBlue

//---- Parameters
extern int TTFbars=15;
extern bool UseT3Smoothing=false;
extern int t3_period = 5;
extern double b=0.7;
extern int maxbars=5000;

//---- buffers
double ExtMapBuffer1[];
double ExtMapBuffer2[];

//+------------------------------------------------------------------+
//| Custom indicator initialization function                         |
//+------------------------------------------------------------------+
int init()
  {
//---- indicators
   SetIndexStyle(0,DRAW_LINE);
   SetIndexBuffer(0,ExtMapBuffer1);
   SetIndexStyle(1,DRAW_LINE);
   SetIndexBuffer(1,ExtMapBuffer2);
//----
   return(0);
  }
//+------------------------------------------------------------------+
//| Custor indicator deinitialization function                       |
//+------------------------------------------------------------------+
int deinit()
  {
//----

//----
   return(0);
  }
//+------------------------------------------------------------------+
//| Custom indicator iteration function                              |
//+------------------------------------------------------------------+
int start()
  {
   int    i,k;
   int    counted_bars=IndicatorCounted();
   i=Bars-1;
   if(counted_bars>0) i=Bars-counted_bars+0;

//Note:  to add the spread to the highesthigh price then uncomment below
   double sp = (MarketInfo(Symbol(),MODE_SPREAD)*Point);
//   double sp = 0;
//----
   double HighestHighRecent, HighestHighOlder, LowestLowRecent, LowestLowOlder, BuyPower, SellPower, TTF, TTF1;

   i = MathMin(i,maxbars);

   while (i>=0)
   {

	     HighestHighRecent=High[Highest(NULL,0,MODE_HIGH,1, i+1)] + sp;
	     HighestHighOlder =High[Highest(NULL,0,MODE_HIGH,TTFbars,i+2)] + sp;
	     LowestLowRecent =Low[Lowest(NULL,0,MODE_LOW ,1,i+1)];
	     LowestLowOlder =Low[Lowest(NULL,0,MODE_LOW ,TTFbars,i+2)];
	     BuyPower =HighestHighRecent-LowestLowOlder;
	     SellPower=HighestHighOlder -LowestLowRecent;

	     TTF1=(BuyPower-SellPower)/(0.5*(BuyPower+SellPower))*100;

	     if (UseT3Smoothing)
            TTF = GetT3Val( Symbol(), t3_period, b, TTF1);
	     else
	         TTF = TTF1;

	     ExtMapBuffer1[i] = TTF;
	     if (TTF>=0)
	        ExtMapBuffer2[i] = 100;
	     else
	        ExtMapBuffer2[i] = -100;

        i--;
   }

//----
   return(0);
  }
//+------------------------------------------------------------------+

double GetT3Val( string symbol, int t3_Period, double b, double dVal)
{
   double e1,e2,e3,e4,e5,e6;
   double c1,c2,c3,c4;
   double n,w1,w2,b2,b3;

   e1=0; e2=0; e3=0; e4=0; e5=0; e6=0;
   c1=0; c2=0; c3=0; c4=0;
   n=0;
   w1=0; w2=0;
   b2=0; b3=0;

   b2=b*b;
   b3=b2*b;
   c1=-b3;
   c2=(3*(b2+b3));
   c3=-3*(2*b2+b+b3);
   c4=(1+3*b+b3+3*b2);
   n=t3_Period;

   if (n<1) n=1;
   n = 1 + 0.5*(n-1);
   w1 = Div(2,(n + 1));
   w2 = 1 - w1;


//---- indicator calculation

        e1 = w1* (dVal) + w2*e1;
        e2 = w1*e1 + w2*e2;
        e3 = w1*e2 + w2*e3;
        e4 = w1*e3 + w2*e4;
        e5 = w1*e4 + w2*e5;
        e6 = w1*e5 + w2*e6;

        return (NormalizeDouble( c1*e6 + c2*e5 + c3*e4 + c4*e3, MarketInfo(symbol,MODE_DIGITS)));
}

//+------------------------------------------------------------------+
double Div(double nVal, double nDiv)
{
   if (nVal == 0 || nDiv == 0)
   {
      return (0);
   }
   return (nVal/nDiv);
}
Comments