TrendManager_001
Download script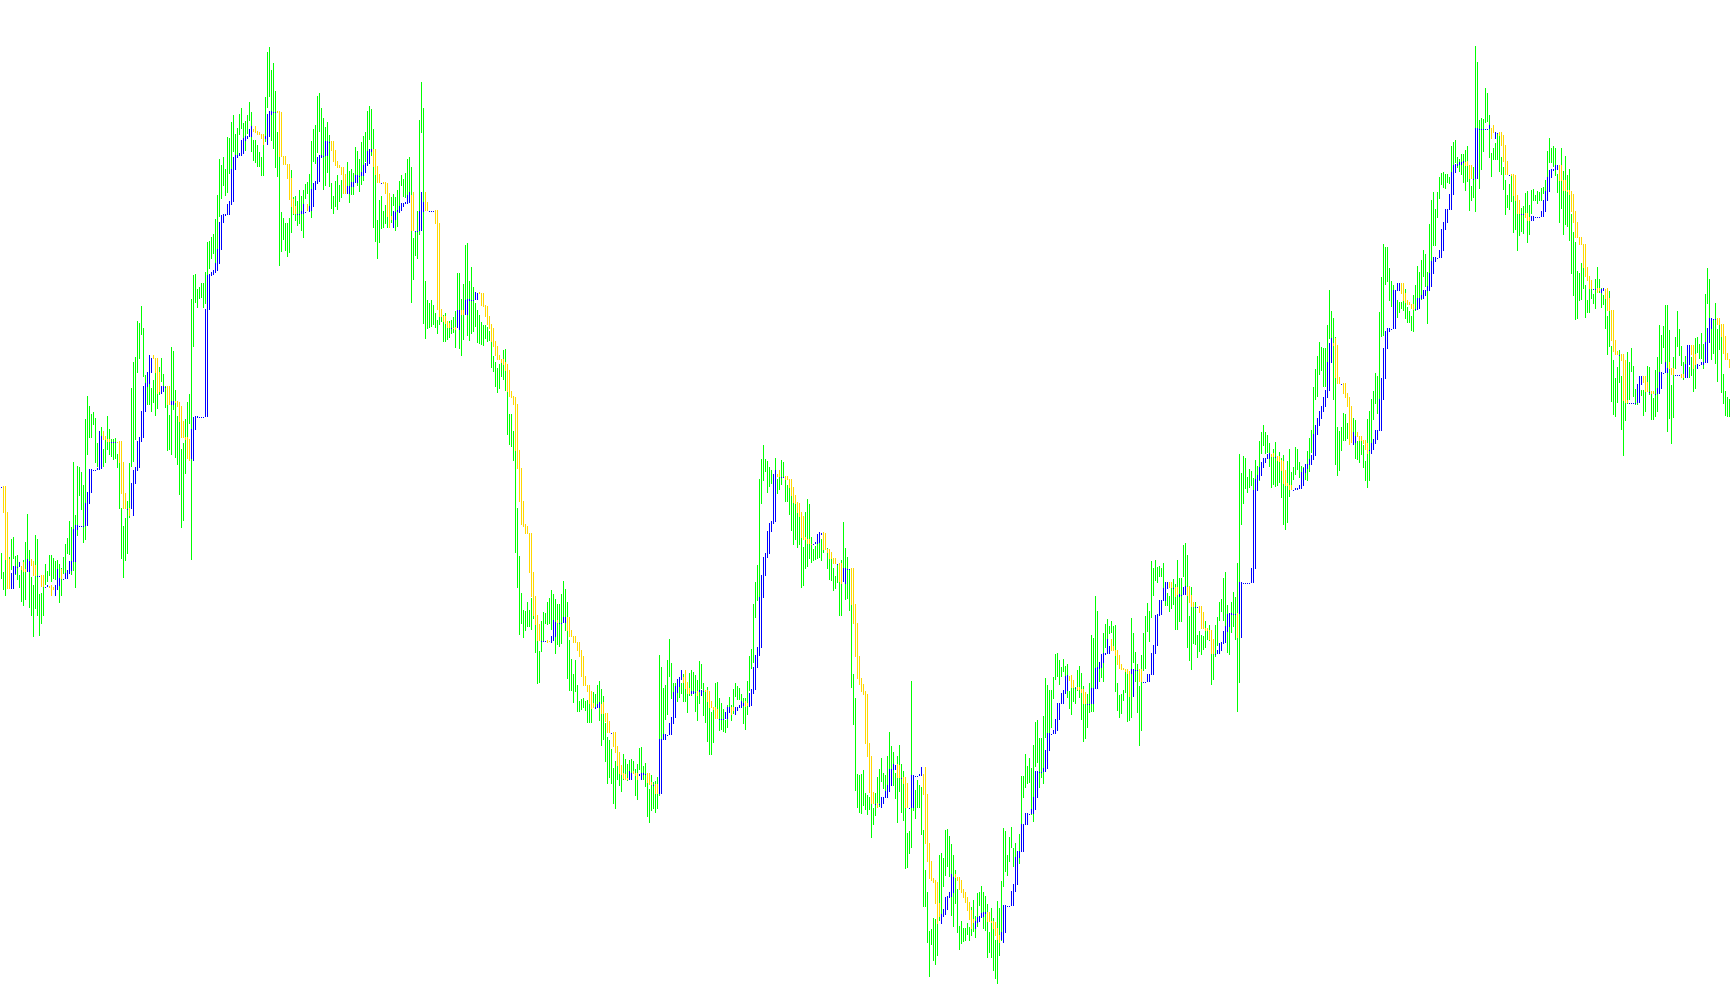
This script serves as a visual trend management tool designed to help traders identify the primary direction of price movement on a chart. By analyzing historical price data, it translates complex market fluctuations into two distinct visual components that represent moving averages of high and low price points.
Core Logic and Functionality
The script operates by looking at specific "windows" of time (defined by the user as a period) to determine the average price level at any given moment. Instead of simply following the closing price, which can sometimes be misleading due to sudden spikes, this tool focuses on the relationship between the highest and lowest prices reached during a set timeframe.
Key processes include:
- Price Range Analysis: For every point on the chart, the script looks backward across a pre-defined number of candles. It identifies the highest peak and the lowest valley reached within that specific window.
- Midpoint Calculation: Once the highs and lows are identified for that period, the script calculates the exact midpoint between them. This represents the "center of gravity" for price action during that timeframe.
- Trend Visualization: The logic generates two distinct visual lines (displayed as histograms):
- The primary indicator tracks the current midpoint of the moving window.
- The secondary indicator tracks the midpoint from a slightly delayed point in time (the "shift").
How it Helps the Trader
By comparing these two calculated midpoints, the tool provides a visual representation of momentum. When the two values move in harmony, it indicates a stable trend. Significant deviations or crossovers between these points can help a trader perceive whether the market is accelerating, slowing down, or potentially reversing direction. Essentially, it smooths out the "noise" of individual price ticks to reveal the underlying structure of the market trend.
// Trend Manager.mq4
// Based on indicator sold at traderstradingsystem.com

#property indicator_chart_window
#property indicator_buffers 2
#property indicator_color1 Red
#property indicator_color2 Blue

extern int TM_Period = 7;
extern int TM_Shift = 2;

double SpanA_Buffer[];
double SpanB_Buffer[];
int a_begin;

int init()
{
   a_begin=TM_Shift;
   SetIndexStyle(0,DRAW_HISTOGRAM,STYLE_SOLID);
   SetIndexBuffer(0,SpanB_Buffer);
   SetIndexDrawBegin(0,TM_Period+a_begin-1);
   SetIndexLabel(0,"TM_Period+");
   SetIndexStyle(1,DRAW_HISTOGRAM,STYLE_SOLID);
   SetIndexBuffer(1,SpanA_Buffer);
   SetIndexDrawBegin(1,TM_Period+a_begin-1);
   SetIndexLabel(1,"TM_Period");

   return(0);
}

int start()
{
   int    i,k;
   int    counted_bars=IndicatorCounted();
   double high,low,price;

   if(Bars<=TM_Period) return(0);
   if(counted_bars<1)
   {
      for(i=1;i<=TM_Period;i++)
      {
         SpanA_Buffer[Bars-i]=0;
         SpanB_Buffer[Bars-i]=0;
      }
   }

   i=Bars-TM_Period;
   if(counted_bars>TM_Period) i=Bars-counted_bars-1;
   while(i>=0)
   {
      high=High[i]; low=Low[i]; k=i-1+TM_Period;
      while(k>=i)
      {
         price=High[k];
         if(high<price) high=price;
         price=Low[k];
         if(low>price)  low=price;
         k--;
      }
      SpanA_Buffer[i]  = (high+low)/2.0;
      SpanB_Buffer[i]  = SpanA_Buffer[i+TM_Shift];
      i--;
   }

   return(0);
}
Comments