TrendstrenghtEMA_v1
Download script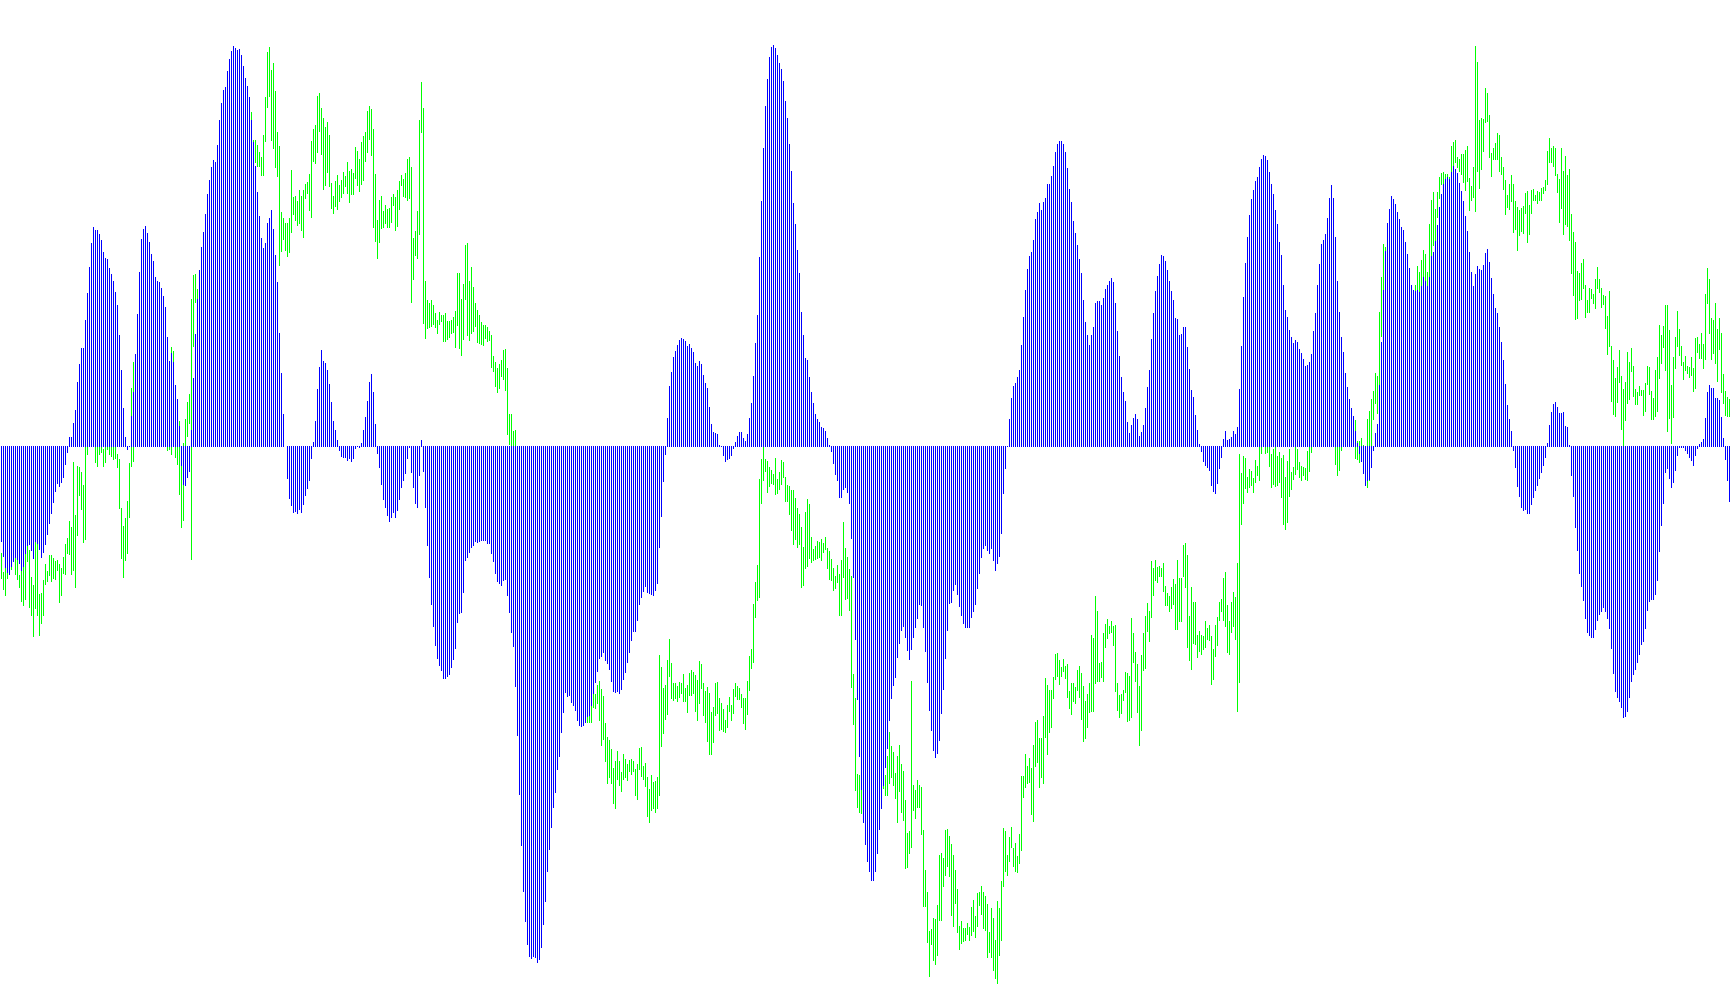
This tool is designed to help traders visualize the momentum and strength of a current market trend by analyzing how different moving averages interact with one another. Rather than simply showing you the price, it calculates a "Trend Strength" value that helps identify whether a move in the market has significant backing or is losing steam.
How the Logic Works
The script functions by comparing a primary baseline against several other short-term benchmarks. Here is the step-by-step logic:
- Establishing a Baseline: The tool first identifies a specific Moving Average (based on an 11-period window). This serves as the primary reference point for the current price trend.
- Measuring Variance: The script then looks at seven different variations of moving averages ranging from very short-term (5 periods) to slightly longer-term (40 periods). It calculates the mathematical distance—or "gap"—between the primary baseline and each of these seven benchmarks.
- Calculating the Average Strength: By taking the difference between the baseline and all seven variations, the tool creates a composite score. It averages these differences to produce a single numerical value.
- Visual Representation: This final value is plotted as a histogram in a separate window below your main price chart.
What This Means for the User
- Trend Intensity: When the histogram bars are larger, it indicates a wider spread between the short-term and medium-term averages, suggesting a stronger, more aggressive trend.
- Momentum Decay: As the histogram bars shrink toward the zero line, it signals that the various moving averages are converging. This often suggests that the current trend is losing its power and the market may be entering a period of consolidation or reversal.
- Trend Direction: By observing whether the values are positive or negative relative to the zero line, traders can better gauge the "health" of the prevailing market direction.
Indicators Used
Miscellaneous
12
Views
0
Downloads
0
Favorites
TrendstrenghtEMA_v1
//+------------------------------------------------------------------+
//|                                             TrendStrengthEMA.mq4 |
//|                                                        Xaoc 2006 |
//|                                             http://forex.xcd.ru/ |
//|                                          modified by Braindancer |
//+------------------------------------------------------------------+
#property copyright "][aoc 2006"
#property link      "http://forex.xcd.ru/"

#property indicator_separate_window
#property indicator_buffers 1

#property indicator_color1 Yellow
#property indicator_level1 0
//#property indicator_maximum 0.02
//#property indicator_minimum -0.02

double TS[];


//+------------------------------------------------------------------+
//| Custom indicator initialization function                         |
//+------------------------------------------------------------------+
int init()
  {
   IndicatorBuffers(1);

   IndicatorShortName("TrendStrenghtEMA");

   SetIndexBuffer(0,TS);
   SetIndexStyle(0, DRAW_HISTOGRAM, STYLE_SOLID, 1, Blue);
   SetIndexDrawBegin(0,2);
   SetIndexLabel(0,"TS");

//---- indicators
//----
   return(0);
  }
//+------------------------------------------------------------------+
//| Custor indicator deinitialization function                       |
//+------------------------------------------------------------------+
int deinit()
  {
//---- TODO: add your code here

//----
   return(0);
  }
//+------------------------------------------------------------------+
//| Custom indicator iteration function                              |
//+------------------------------------------------------------------+
int start()
  {
   int    shift,counted_bars=IndicatorCounted();
   //double ma40dbl;
   double ma0, ma1, ma2, ma3, ma4, ma5, ma6, ma7, ma8, ma9, tmp;
//---- TODO: add your code here


  //---- check for possible errors
     if(counted_bars<0) return(-1);
  //---- last counted bar will be recounted
     if(counted_bars>0) counted_bars--;
     //limit=Bars-counted_bars;
  //---- main loop
//---- main calculation loop
   shift=Bars-1;
   while(shift>=0)
     {
   tmp=iMA(NULL,0,11,0,MODE_EMA,PRICE_CLOSE,shift);
   ma1=tmp-iMA(NULL,0,5,0,MODE_EMA,PRICE_CLOSE,shift);
   ma2=tmp-iMA(NULL,0,10,0,MODE_EMA,PRICE_CLOSE,shift);
   ma3=tmp-iMA(NULL,0,15,0,MODE_EMA,PRICE_CLOSE,shift);
   ma4=tmp-iMA(NULL,0,20,0,MODE_EMA,PRICE_CLOSE,shift);
   ma5=tmp-iMA(NULL,0,25,0,MODE_EMA,PRICE_CLOSE,shift);
   ma6=tmp-iMA(NULL,0,30,0,MODE_EMA,PRICE_CLOSE,shift);
   ma7=tmp-iMA(NULL,0,40,0,MODE_EMA,PRICE_CLOSE,shift);


   TS[shift]=(ma1+ma2+ma3+ma4+ma5+ma6+ma7)/7;

     shift--;//
     }

//----
   return(0);
  }
//+------------------------------------------------------------------+
Comments