TrendStrength RMD
Download script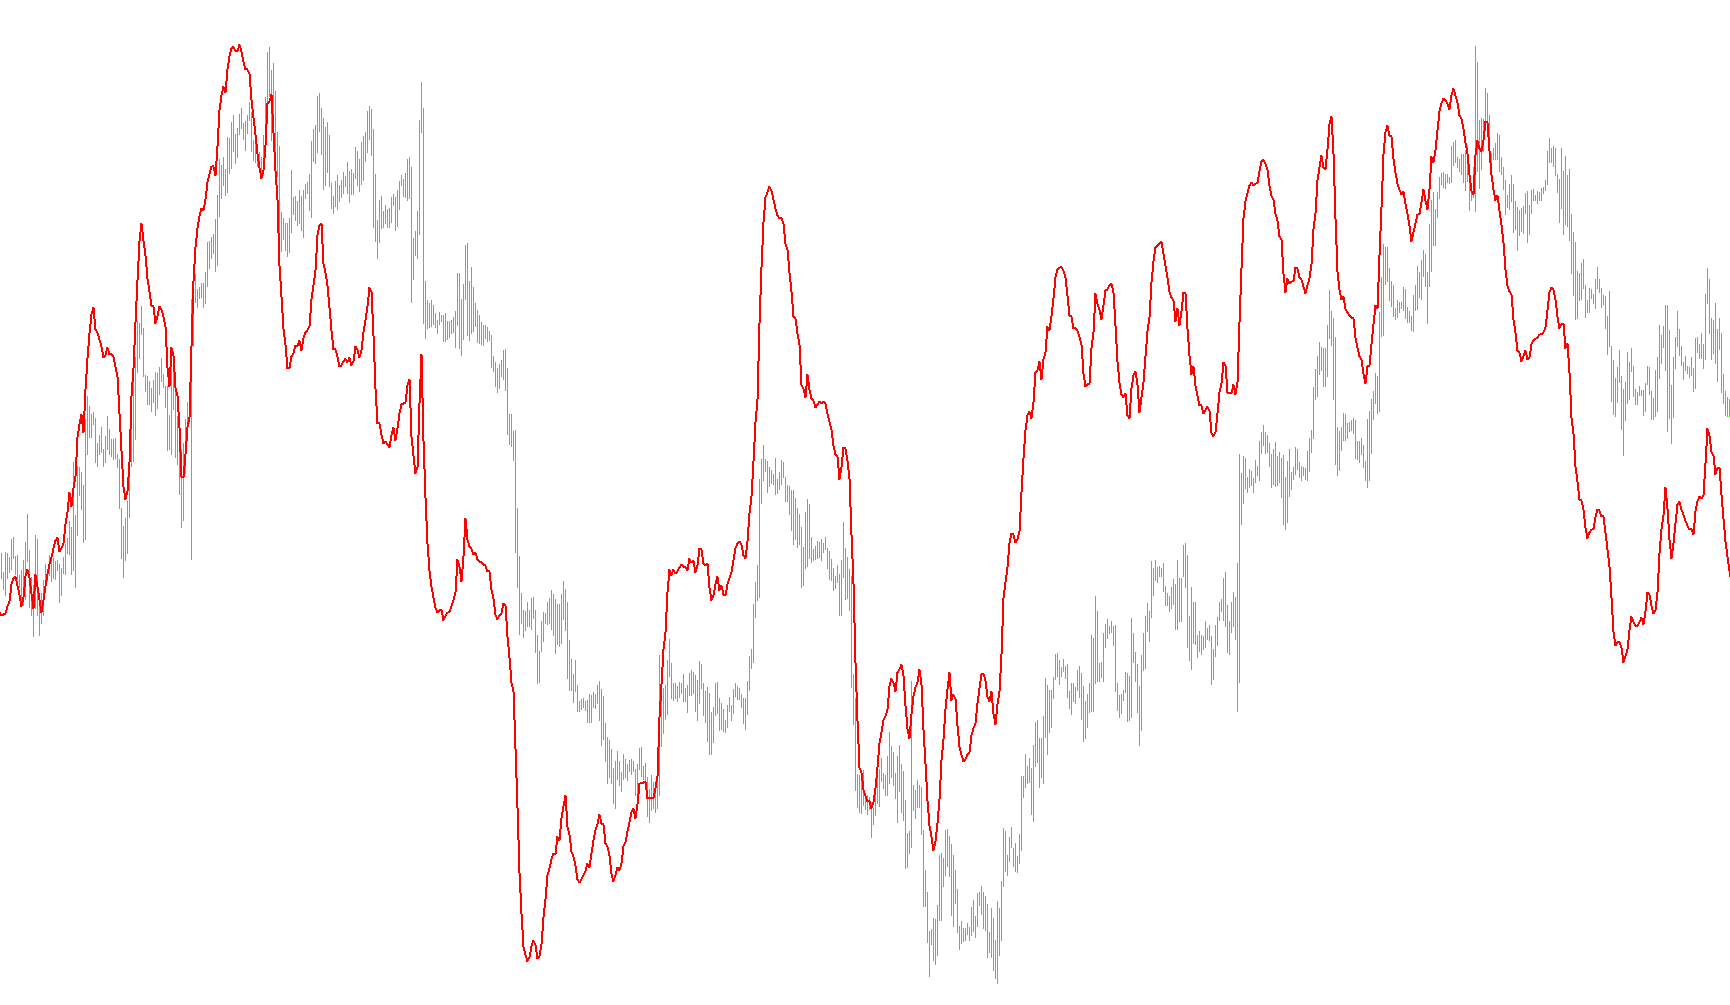
This tool is designed to help traders visualize the momentum and strength of a market trend by measuring the "gap" between different types of moving averages. Instead of just showing you where the price is, it provides a dedicated reading of how forcefully the current price movement is pushing away from historical averages.
How the Logic Works
The script operates by comparing two distinct types of price smoothing techniques:
- The Fast Reference: It first identifies a very responsive "Fast" average (an Exponential Moving Average). This represents the most recent price action and reacts quickly to new information.
- The Slow Benchmarks: It then calculates a series of "Slow" averages (Smoothed Moving Averages) across various timeframes, ranging from short-term to long-term horizons (specifically looking at 10, 20, 30, 40, 50, 60, 70, 80, and 90 periods).
Calculating Trend Strength
For every point on the chart, the script performs the following steps:
- Difference Mapping: It calculates the mathematical distance between the "Fast" reference and each of the nine "Slow" benchmarks. This essentially tells the script how far the current price has moved away from different levels of historical memory.
- Averaging the Deviations: The script takes all nine of those distances, adds them together, and divides them by nine to find a single average value.
- The Resulting Line: This final average is plotted as a line in a separate window on your screen.
How to Interpret the Data
Because the result is based on the difference between price and averages:
- Positive Movement: When the line trends upward, it indicates that the current price is pulling away from the historical averages at an increasing rate, signaling strengthening bullish momentum.
- Negative Movement: When the line trends downward, it suggests the price is moving further below the historical benchmarks, indicating stronger bearish momentum.
- Stability vs. Volatility: A flat or near-zero line suggests that the price is hovering very close to its historical averages (a sideways or "ranging" market), while a steep incline or decline indicates a powerful, established trend.
Indicators Used
Miscellaneous
16
Views
0
Downloads
0
Favorites
TrendStrength RMD
//+------------------------------------------------------------------+
//|                                                TrendStrength.mq4 |
//|                                                        Xaoc 2006 |
//|                                             http://forex.xcd.ru/ |
//+------------------------------------------------------------------+
#property copyright "][aoc 2006"
#property link      "http://forex.xcd.ru/"

#property indicator_separate_window
#property indicator_buffers 1

#property indicator_color1 Red
#property indicator_level1 0
//#property indicator_maximum 0.02
//#property indicator_minimum -0.02

double TS[];


//+------------------------------------------------------------------+
//| Custom indicator initialization function                         |
//+------------------------------------------------------------------+
int init()
  {
   IndicatorBuffers(1);

   IndicatorShortName("TrendStrength RMD");

   SetIndexBuffer(0,TS);
   SetIndexStyle(0, DRAW_LINE, STYLE_SOLID, 2, Red);
   SetIndexDrawBegin(0,2);
   SetIndexLabel(0,"TS");

//---- indicators
//----
   return(0);
  }
//+------------------------------------------------------------------+
//| Custor indicator deinitialization function                       |
//+------------------------------------------------------------------+
int deinit()
  {
//---- TODO: add your code here

//----
   return(0);
  }
//+------------------------------------------------------------------+
//| Custom indicator iteration function                              |
//+------------------------------------------------------------------+
int start()
  {
   int    shift,counted_bars=IndicatorCounted();
   //double ma40dbl;
   double ma0, ma1, ma2, ma3, ma4, ma5, ma6, ma7, ma8, ma9, tmp;
//---- TODO: add your code here


  //---- check for possible errors rsi
     if(counted_bars<0) return(-1);
  //---- last counted bar will be recounted
     if(counted_bars>0) counted_bars--;
     //limit=Bars-counted_bars;
  //---- main loop
//---- main calculation loop
   shift=Bars-1;
   while(shift>=0)
     {
   tmp=iMA(NULL,0,5,0,MODE_EMA,PRICE_CLOSE,shift);
   ma1=tmp-iMA(NULL,0,10,0,MODE_SMMA,PRICE_CLOSE,shift);
   ma2=tmp-iMA(NULL,0,20,0,MODE_SMMA,PRICE_CLOSE,shift);
   ma3=tmp-iMA(NULL,0,30,0,MODE_SMMA,PRICE_CLOSE,shift);
   ma4=tmp-iMA(NULL,0,40,0,MODE_SMMA,PRICE_CLOSE,shift);
   ma5=tmp-iMA(NULL,0,50,0,MODE_SMMA,PRICE_CLOSE,shift);
   ma6=tmp-iMA(NULL,0,60,0,MODE_SMMA,PRICE_CLOSE,shift);
   ma7=tmp-iMA(NULL,0,70,0,MODE_SMMA,PRICE_CLOSE,shift);
   ma8=tmp-iMA(NULL,0,80,0,MODE_SMMA,PRICE_CLOSE,shift);
   ma9=tmp-iMA(NULL,0,90,0,MODE_SMMA,PRICE_CLOSE,shift);

   TS[shift]=(ma1+ma2+ma3+ma4+ma5+ma6+ma7+ma8+ma9)/9;

     shift--;//
     }

//----
   return(0);
  }
//+------------------------------------------------------------------+
Comments