TrendManagerOpen2 seperate window2
Download script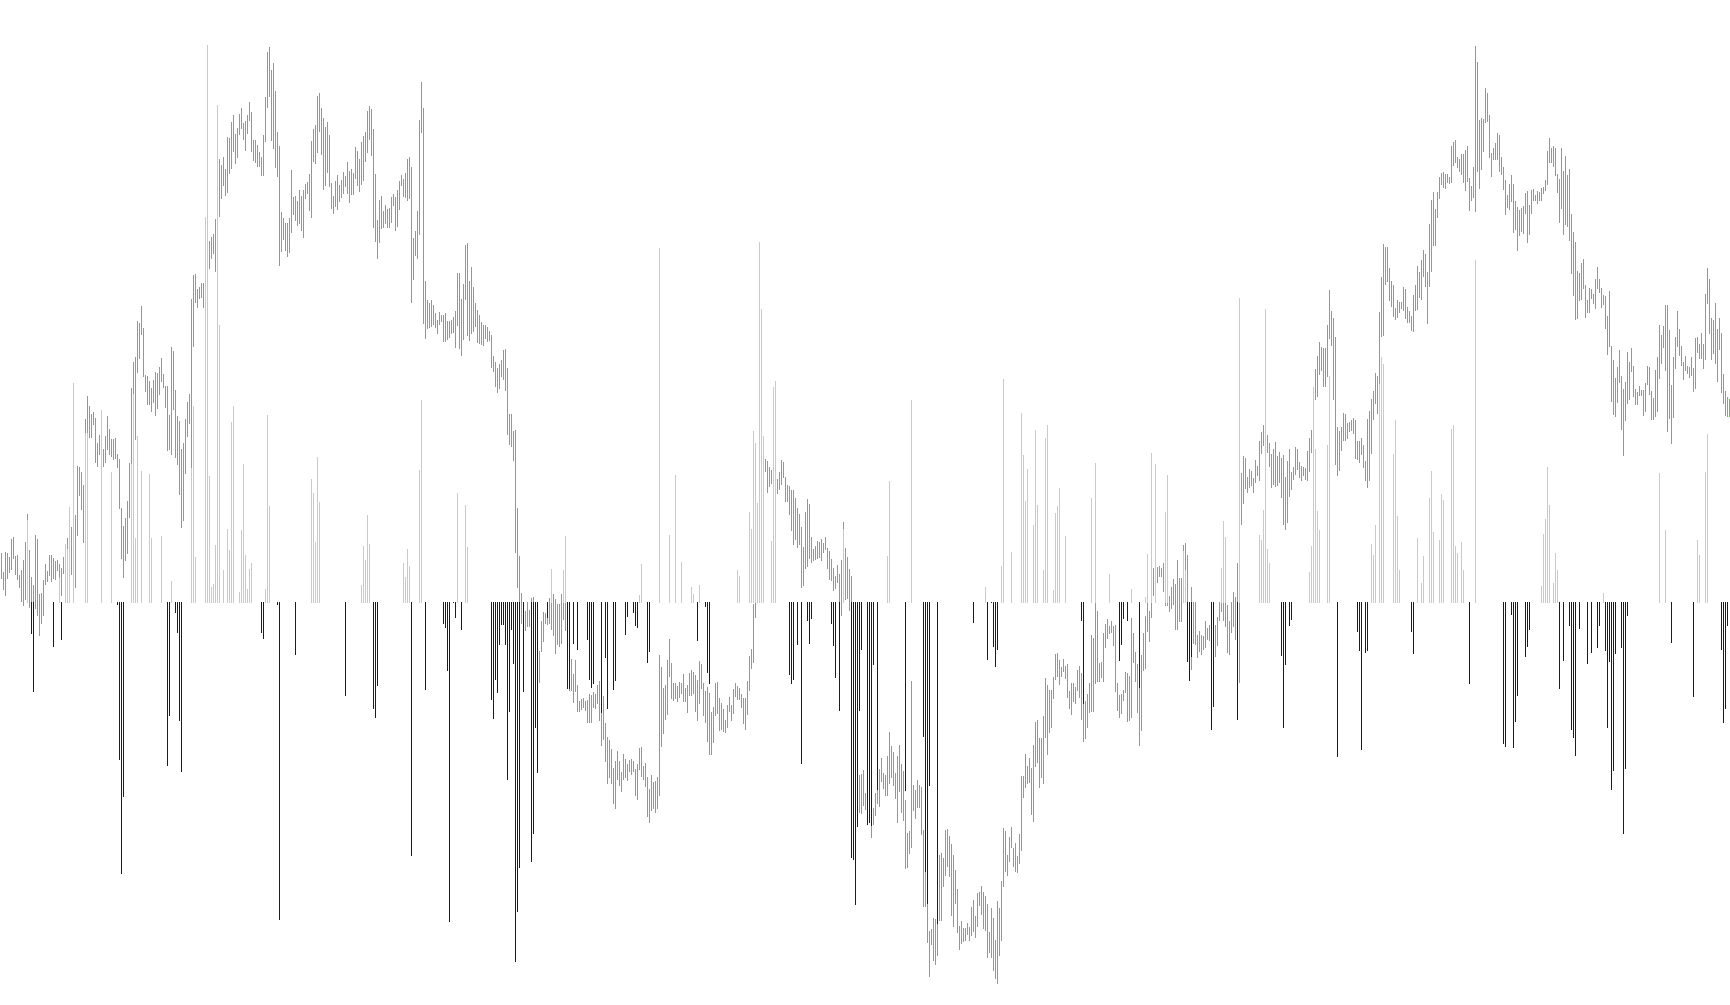
The Trend Manager is a visual trading tool designed to help market participants identify the underlying direction of price movement by filtering out minor market "noise." It functions by analyzing two different time horizons simultaneously and displaying the results in a dedicated histogram window below your main price chart.
Core Logic & Methodology
The script operates based on the principle of Trend Confluence. Instead of looking at a single price point, it evaluates the relationship between two distinct moving averages—one representing a short-term trend and the other representing a longer-term trend.
1. Data Calculation (The Middle Price)
To determine the "true" price for each period, the script identifies the highest high and the lowest low within a specific look-back window. It then calculates the midpoint between these two values. This approach is used to smooth out erratic price spikes, providing a more stable baseline for trend analysis.
2. Dual-Horizon Analysis
The tool tracks two different sets of parameters:
- Short-Term Analysis: A fast-moving calculation that reacts quickly to recent price changes.
- Long-Term Analysis: A slower-moving calculation that captures the broader market trajectory.
3. Trend Filtering & Visualization
The heart of the script lies in how it compares these two horizons. The tool looks for alignment:
- Neutral Zone (No Signal): If the short-term trend and the long-term trend are moving in opposite directions (e.g., short-term is up while long-term is down), the script considers the market to be in a state of conflict or transition. In this scenario, the histogram remains flat at zero, indicating no clear trend.
- Bullish Signal (Up Trend): If both the short-term and long-term trends are moving upward simultaneously, the script validates the strength of the move. It then calculates the magnitude of this upward momentum and displays it as a positive value in the Up Pips histogram.
- Bearish Signal (Down Trend): Conversely, if both horizons are moving downward together, the tool confirms a dominant sell trend. It calculates the magnitude of this decline and displays it in the Down Pips histogram.
Summary for the User
Essentially, this script acts as a "confirmation engine." It ensures that you are only alerted to significant trends when the short-term momentum agrees with the long-term direction. By providing a visual histogram, it allows you to see not just which way the market is moving, but how much strength is behind that specific move at any given moment.
// Trend Manager Open2 separate window.mq4
//
// Look & Feel of original based on indicator sold at traderstradingsystem.com
// this one plots in lower histogram window.

// No representation it is identical.
// This file is licensed under the terms of the GNU General Public License V2.
//
// (c) 2006 Matt Kennel (mbkennel@gmail.com)

#property indicator_separate_window
#property indicator_buffers 2
#property indicator_color1 Red
#property indicator_color2 Blue


extern int TM_Period_1 = 7;
extern int TM_Shift_1 = 2;
extern int TM_Period_2 = 13; // Put TM_Period_2 params equal to first to get orig TrendManager system
extern int TM_Shift_2 = 1;

int Max_Period;
int Max_Shift;

double Up_Histogram[];
double Down_Histogram[];

int a_begin;

int init()
{
   Max_Shift = MathMax(TM_Shift_1,TM_Shift_2);
   Max_Period = MathMax(TM_Period_1,TM_Period_2);

   int b_begin = Max_Period+Max_Shift-1;

   SetIndexStyle(1,DRAW_HISTOGRAM,STYLE_SOLID);
   SetIndexBuffer(1,Down_Histogram);
   SetIndexDrawBegin(1,b_begin);
   SetIndexLabel(1,"Down Pips");

   SetIndexStyle(0,DRAW_HISTOGRAM,STYLE_SOLID);
   SetIndexBuffer(0,Up_Histogram);
   SetIndexDrawBegin(0,b_begin);
   SetIndexLabel(0,"Up Pips");

   return(0);
}

int start()
{
   int    i,k;
   int    counted_bars=IndicatorCounted();
   double high,low,price;

   if(Bars<=Max_Period) return(0);

   i=Bars-Max_Period;
   if(counted_bars>Max_Period) i=Bars-counted_bars-1;
   while(i>=0)
   {

      double M1, M1b;
      double M2, M2b;

      M1 = MiddlePrice(TM_Period_1,i);
      M1b = MiddlePrice(TM_Period_1,i+TM_Shift_1);
      M2 = MiddlePrice(TM_Period_2,i);
      M2b = MiddlePrice(TM_Period_2,i+TM_Shift_2);

      //
      double diff1 = (M1-M1b); // up or down on short term;
      double diff2 = (M2-M2b); // up or down on longer term.
      // each has three choices, hence six possibilities.


      if (diff1*diff2 <= 0.0) { // opposite signs
         Down_Histogram[i] = 0.0;
         Up_Histogram[i] = 0.0;
      } else {
         double diff = 0.5* (M1+M2 - M1b-M2b) / Point;
         if (diff >= 0) {
            Up_Histogram[i]=diff;
            Down_Histogram[i]=0.0;
         } else {
            Up_Histogram[i] = 0.0;
            Down_Histogram[i]=diff;
         }
      }


      i--;
   }

   return(0);
}

double MiddlePrice(int nback, int shift) {
  double H = High[Highest(NULL,0,MODE_HIGH,nback,shift)];
  double L = Low[Lowest(NULL,0,MODE_LOW,nback,shift)];
  return( 0.5*(H+L));

}
Comments