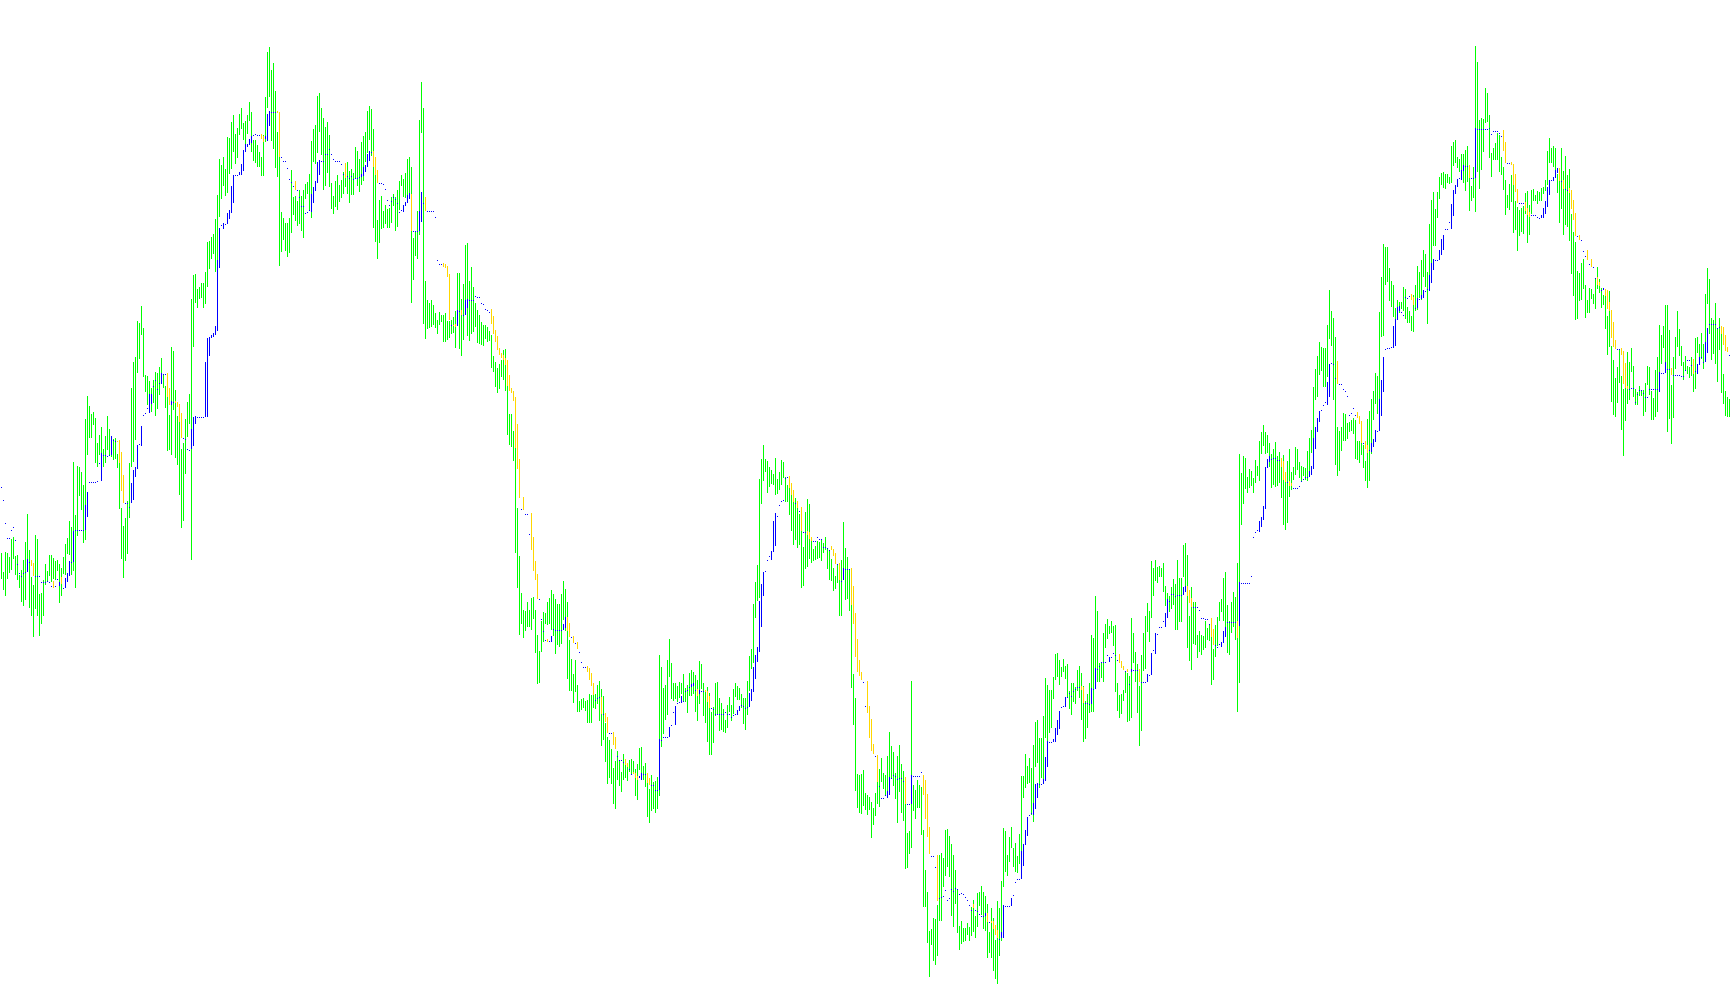
Overview
The Trend Manager Open2 is a visual technical analysis tool designed to help traders identify and visualize market momentum. Instead of looking at simple price action, this script analyzes the relationship between two different timeframes (or "periods") simultaneously to determine if the market is moving in harmony or in conflict.
How It Works
The logic of this tool relies on comparing short-term price movements against longer-term trends. Here is a breakdown of the underlying mechanics:
1. Price Point Calculation The script begins by identifying the "Middle Price" for two distinct settings. To do this, it looks back at a specific number of candles and finds the highest peak and the lowest valley within that range. It then calculates the exact midpoint between those two extremes. This provides a more stable "average" price than just looking at the most recent closing price.
2. Dual-Trend Comparison The tool tracks these middle prices across two different scales:
- Short-Term: A fast-moving look at recent price action.
- Long-Term: A slower-moving look that captures the broader market direction.
By comparing where these prices are now versus where they were a few candles ago, the script determines the "velocity" of both the short-term and long-term trends.
3. Trend Harmony vs. Conflict The core intelligence of the script lies in how it reacts to these two movements. It looks for "confluence"—when both the short-term and long-term movements are moving in the same direction.
- In Harmony: If both the short-term and long-term trends are moving upward (or both downward), the tool reflects this shared momentum.
- In Conflict: If the short-term trend is moving up while the long-term trend is moving down (or vice versa), the script recognizes this as a state of contradiction or "noise" in the market.
Visual Representation
The logic is translated onto your chart using two colored histograms:
- The Blue and Red Bars: These represent the calculated price points based on the harmony of the trends.
- Gap Identification: When the short-term and long-term movements agree, the bars will appear in a way that shows clear directional momentum. When they disagree (opposite signs), the script flattens the logic to indicate a lack of clear trend alignment.
Summary for Traders
Essentially, this tool acts as a filter. It helps you see past the immediate "jitter" of the market by highlighting whether the current price movement is supported by the broader trend. When the two periods align, it provides a visual confirmation of the prevailing direction; when they diverge, it warns you that the market may be experiencing conflicting forces.
// Trend Manager Open2.mq4
//
// Look & Feel based on indicator sold at traderstradingsystem.com
// No representation it is identical.
// This file is licensed under the terms of the GNU General Public License V2.
//
// (c) 2006 Matt Kennel (mbkennel@gmail.com)

#property indicator_chart_window
#property indicator_buffers 2
#property indicator_color1 Red
#property indicator_color2 Blue


extern int TM_Period_1 = 7;
extern int TM_Shift_1 = 2;
extern int TM_Period_2 = 13;
extern int TM_Shift_2 = 1;

int Max_Period;
int Max_Shift;

double SpanA_Buffer[];
double SpanB_Buffer[];
int a_begin;

int init()
{
   Max_Shift = MathMax(TM_Shift_1,TM_Shift_2);
   Max_Period = MathMax(TM_Period_1,TM_Period_2);

   int b_begin = Max_Period+Max_Shift-1;

   SetIndexStyle(0,DRAW_HISTOGRAM,STYLE_SOLID);
   SetIndexBuffer(0,SpanB_Buffer);
   SetIndexDrawBegin(0,b_begin);
   SetIndexLabel(0,"TM_Period+");

   SetIndexStyle(1,DRAW_HISTOGRAM,STYLE_SOLID);
   SetIndexBuffer(1,SpanA_Buffer);
   SetIndexDrawBegin(1,b_begin);
   SetIndexLabel(1,"TM_Period");

   return(0);
}

int start()
{
   int    i,k;
   int    counted_bars=IndicatorCounted();
   double high,low,price;

   if(Bars<=Max_Period) return(0);
   if(counted_bars<1)
   {
      for(i=1;i<=Max_Period;i++)
      {
         SpanA_Buffer[Bars-i]=0;
         SpanB_Buffer[Bars-i]=0;
      }
   }

   i=Bars-Max_Period;
   if(counted_bars>Max_Period) i=Bars-counted_bars-1;
   while(i>=0)
   {

      double M1, M1b;
      double M2, M2b;

      M1 = MiddlePrice(TM_Period_1,i);
      M1b = MiddlePrice(TM_Period_1,i+TM_Shift_1);
      M2 = MiddlePrice(TM_Period_2,i);
      M2b = MiddlePrice(TM_Period_2,i+TM_Shift_2);

      //
      double diff1 = (M1-M1b); // up or down on short term;
      double diff2 = (M2-M2b); // up or down on longer term.
      // each has three choices, hence six possibilities.


      if (diff1*diff2 <= 0.0) { // opposite signs
         SpanA_Buffer[i] = (M1+M2)*0.5;
         SpanB_Buffer[i] = SpanA_Buffer[i];
      } else {
         SpanA_Buffer[i]  =  (M1+M2)*0.5;
         SpanB_Buffer[i]  =  (M1b+M2b)*0.5;
      }
   //   Comment(SpanB_Buffer[i],"\n",SpanA_Buffer[i] );


      i--;
   }

   return(0);
}

double MiddlePrice(int nback, int shift) {
  double H = High[Highest(NULL,0,MODE_HIGH,nback,shift)];
  double L = Low[Lowest(NULL,0,MODE_LOW,nback,shift)];
  return( 0.5*(H+L));

}
Comments