TrendRSI_v1_v1
Download script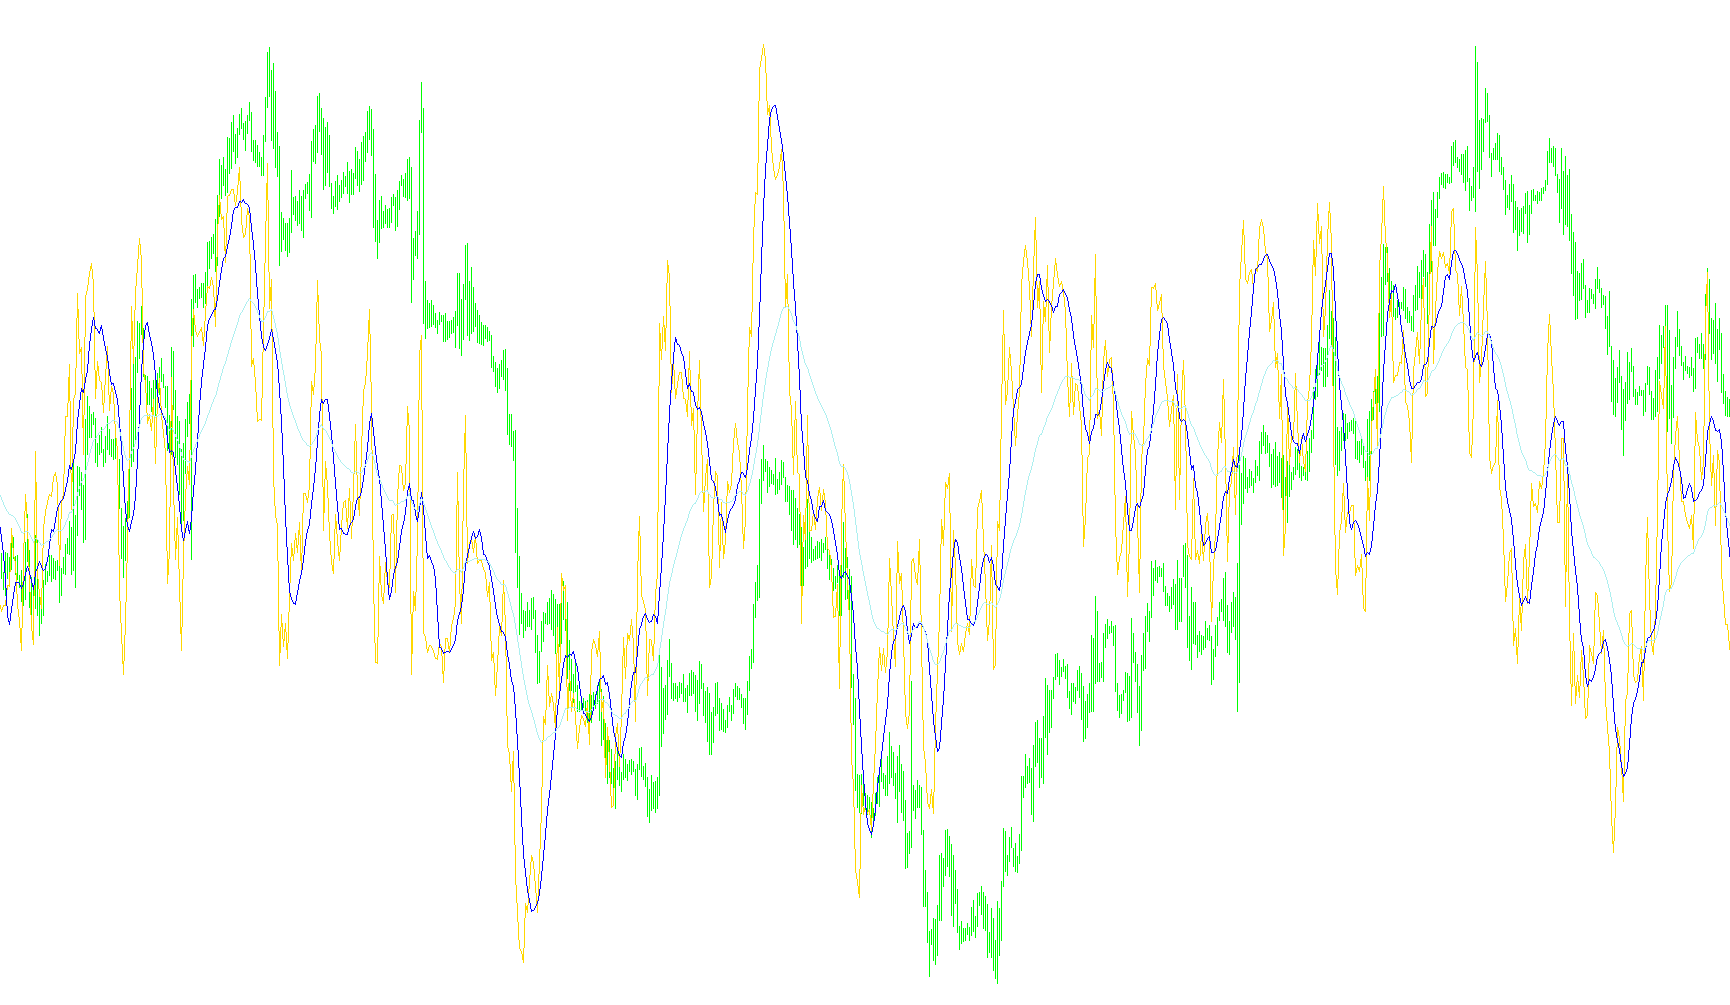
This tool is designed to help traders visualize market momentum and identify potential trend shifts by layering different types of mathematical averages over the Relative Strength Index (RSI). Instead of looking at a single line, this indicator creates a multi-layered visual landscape that helps distinguish between "noise" and significant price movements.
How it Works
The logic operates in three distinct stages:
1. Measuring Momentum (The Base Layer) First, the script calculates the standard RSI. This is a common technical tool used to measure how fast and how much prices are moving. It tells you if an asset is becoming overbought (too high) or oversold (too low). In this visual window, this serves as your primary foundation.
2. Identifying Fast Trends (The Fast Layer) The script then takes that RSI data and applies a "Fast Moving Average" to it. Think of this as a smoothing agent. By averaging the RSI over a short period, it filters out minor, jagged price fluctuations. This helps you see the immediate direction of the momentum more clearly without getting distracted by every small tick in the market.
3. Identifying Long-Term Trends (The Slow Layer) Finally, the script applies a "Slow Moving Average" to the RSI data as well. This is calculated over a much broader timeframe. While the fast layer shows you what is happening right now, this slow layer represents the bigger picture—the underlying trend of the momentum.
What this means for your trading
By combining these three elements, the indicator allows you to see the relationship between short-term intensity and long-term direction:
- Smoothing: Because the script applies moving averages directly to the RSI (rather than just applying them to the price), it creates a much cleaner visual output that focuses specifically on "momentum energy."
- Trend Confirmation: When the fast line and the slow line are moving in harmony, it suggests a strong, consistent trend.
- Potential Reversals: When these lines begin to diverge or cross one another, it can serve as a visual cue that the current momentum is losing steam and the market may be preparing for a change in direction.
//+------------------------------------------------------------------+
//|                                                   TrendRSI_v1.mq4 |
//|                           Copyright © 2005, TrendLaboratory Ltd. |
//|                                       E-mail: igorad2004@list.ru |
//+------------------------------------------------------------------+
#property copyright "Copyright © 2005, TrendLaboratory Ltd."
#property link      "E-mail: igorad2004@list.ru"
//-----
#property indicator_separate_window
#property indicator_minimum 20
#property indicator_maximum 80
#property indicator_buffers 3
#property indicator_color1 Orange
#property indicator_color2 SkyBlue
#property indicator_color3 Magenta
//---- input parameters
extern int PeriodRSI=14;
extern int PeriodMAFast=9;
extern int PeriodMASlow=45;
//---- indicator buffers
double Line1Buffer[];
double Line2Buffer[];
double Line3Buffer[];
//+------------------------------------------------------------------+
//| Custom indicator initialization function                         |
//+------------------------------------------------------------------+
  int init()
  {
   string short_name;
//---- indicator line
   SetIndexStyle(0,DRAW_LINE,STYLE_SOLID,1);
   SetIndexStyle(1,DRAW_LINE,STYLE_SOLID,1);
   SetIndexStyle(2,DRAW_LINE,STYLE_SOLID,1);
   SetIndexBuffer(0,Line1Buffer);
   SetIndexBuffer(1,Line2Buffer);
   SetIndexBuffer(2,Line3Buffer);
   IndicatorDigits(MarketInfo(Symbol(),MODE_DIGITS));
//---- name for DataWindow and indicator subwindow label
   short_name="TrendRSI("+PeriodRSI+","+PeriodMAFast+","+PeriodMASlow+")";
   IndicatorShortName(short_name);
   SetIndexLabel(0,"RSI");
   SetIndexLabel(1,"MARSI fast");
   SetIndexLabel(2,"MARSI slow");
//----
   SetIndexDrawBegin(0,PeriodRSI);
   SetIndexDrawBegin(1,PeriodMAFast);
   SetIndexDrawBegin(2,PeriodMASlow);
//----
   return(0);
  }
//+------------------------------------------------------------------+
//| TrendRSI_v1                                                         |
//+------------------------------------------------------------------+
int start()
  {
   int shift;
//-----
   for(shift=Bars-1;shift>=0;shift--)
     {
      Line1Buffer[shift]=iRSI(NULL,0,PeriodRSI,PRICE_CLOSE,shift);
     }
   for(shift=Bars-PeriodMASlow;shift>=0;shift--)
     {
      Line2Buffer[shift]=iMAOnArray(Line1Buffer,0,PeriodMAFast,0,MODE_SMA,shift);
      Line3Buffer[shift]=iMAOnArray(Line1Buffer,0,PeriodMASlow,0,MODE_EMA,shift);
     }
   return(0);
  }
//+------------------------------------------------------------------+
Comments