Trendsignal_001
Download script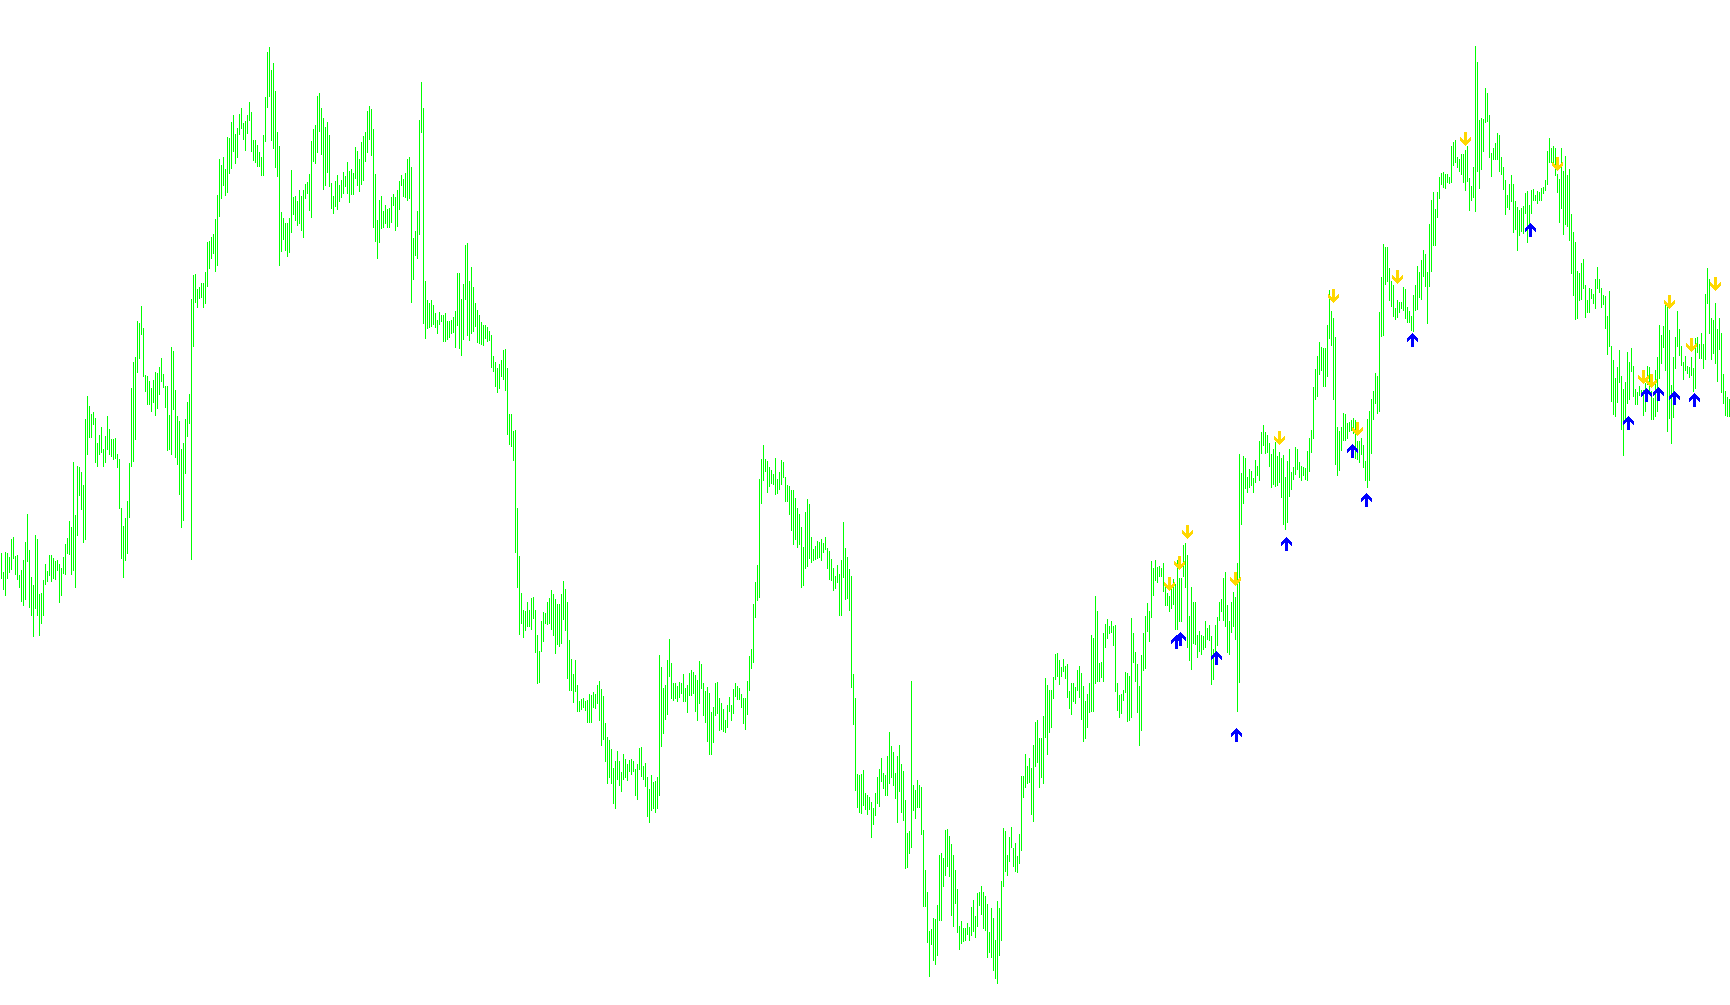
This script is a specialized technical analysis tool designed to identify potential trend reversals on a trading chart. Rather than simply looking at price movements in isolation, the logic works by analyzing the relationship between historical price volatility and momentum oscillations.
Here is a breakdown of how the underlying logic functions:
Volatility and Range Analysis
The script begins by examining a small window of recent price data to calculate an "Average Range." It measures the distance between the highs and lows of previous candles to establish a baseline for how much the market is currently moving. This baseline is used as a benchmark to distinguish between normal market noise and significant price action.
Trend Intensity Detection
To determine if a trend is actually gaining strength or losing steam, the script performs two specific checks:
- Price Gap Analysis: It looks for significant "jumps" between opening and closing prices relative to the average range.
- Momentum Acceleration: It measures the distance between current closes and previous closes to see if the price is moving with enough velocity to confirm a trend.
Based on these checks, the script dynamically adjusts its sensitivity. If it detects a strong move, it modifies its internal calculation parameters to stay aligned with the market's current behavior.
Momentum Filtering (The WPR Component)
The tool utilizes a modified version of the Williams Percent Range (WPR) logic. This is a momentum indicator that measures how far the price has moved relative to its high-low range over a specific period. By comparing this momentum against the volatility established in the first step, the script can identify "overextended" conditions—points where the price may have moved too far, too fast.
Signal Generation
The final logic produces visual signals (arrows) on the chart based on two conditions:
- Sell Signals: If the momentum indicator drops below a specific low threshold and then shows signs of recovery, it suggests a potential upward reversal or a "bottoming" move.
- Buy Signals: If the momentum indicator rises above a specific high threshold and begins to cool off, it suggests a potential downward reversal or a "topping" move.
User Customization
The script includes two primary settings that allow users to tune the logic:
- Risk Factor: This adjusts the sensitivity of the entry thresholds. A higher risk value makes the signals more conservative by requiring larger momentum shifts before an arrow appears.
- CountBars: This defines how much historical data the script processes at one time to ensure the chart remains responsive and focused on relevant price action.
//+------------------------------------------------------------------+
//| //| Ramdass - Conversion only
//+------------------------------------------------------------------+

#property indicator_chart_window
#property indicator_buffers 2
#property indicator_color1 Magenta
#property indicator_color2 Aqua

//---- input parameters
extern int RISK=3;
extern int CountBars=300;

//---- buffers
double val1[];
double val2[];


//+------------------------------------------------------------------+
//| Custom indicator initialization function                         |
//+------------------------------------------------------------------+
int init()
  {
//---- indicator line
   IndicatorBuffers(2);
   SetIndexStyle(0,DRAW_ARROW);
   SetIndexArrow(0,234);
   SetIndexStyle(1,DRAW_ARROW);
   SetIndexArrow(1,233);
   SetIndexBuffer(0,val1);
   SetIndexBuffer(1,val2);

//----
   return(0);
  }
//+------------------------------------------------------------------+
//| ASCTrend1sig                                                     |
//+------------------------------------------------------------------+
int start()
  {
   if (CountBars>=1000) CountBars=950;
   SetIndexDrawBegin(0,Bars-CountBars+11+1);
   SetIndexDrawBegin(1,Bars-CountBars+11+1);
   int i,shift,counted_bars=IndicatorCounted();
   int Counter,i1,value10,value11;
   double value1,x1,x2;
   double value2,value3;
   double TrueCount,Range,AvgRange,MRO1,MRO2;
   double Table_value2[1000];

   value10=3+RISK*2;
   x1=67+RISK;
   x2=33-RISK;
   value11=value10;
//----
   if(Bars<=11+1) return(0);
//---- initial zero
   if(counted_bars<11+1)
   {
      for(i=1;i<=0;i++) val1[CountBars-i]=0.0;
      for(i=1;i<=0;i++) val2[CountBars-i]=0.0;
   }
//----
   shift=CountBars-11-1;
   while(shift>=0)
     {

   Counter=shift;
	Range=0.0;
	AvgRange=0.0;
	for (Counter=shift; Counter<=shift+9; Counter++) AvgRange=AvgRange+MathAbs(High[Counter]-Low[Counter]);

	Range=AvgRange/10;
	Counter=shift;
	TrueCount=0;
	while (Counter<shift+9 && TrueCount<1)
		{if (MathAbs(Open[Counter]-Close[Counter+1])>=Range*2.0) TrueCount=TrueCount+1;
		Counter=Counter+1;
		}
	if (TrueCount>=1) {MRO1=Counter;} else {MRO1=-1;}
	Counter=shift;
	TrueCount=0;
	while (Counter<shift+6 && TrueCount<1)
		{if (MathAbs(Close[Counter+3]-Close[Counter])>=Range*4.6) TrueCount=TrueCount+1;
		Counter=Counter+1;
		}
	if (TrueCount>=1) {MRO2=Counter;} else {MRO2=-1;}
	if (MRO1>-1) {value11=3;} else {value11=value10;}
	if (MRO2>-1) {value11=4;} else {value11=value10;}
	value2=100-MathAbs(iWPR(NULL,0,value11,shift)); // PercentR(value11=9)
	Table_value2[shift]=value2;
	val1[shift]=0;
	val2[shift]=0;
	value3=0;
	if (value2<x2)
		{i1=1;
		while (Table_value2[shift+i1]>=x2 && Table_value2[shift+i1]<=x1){i1++;}
		if (Table_value2[shift+i1]>x1)
			{
			value3=High[shift]+Range*0.5;
			val1[shift]=value3;
			}
		}
	if (value2>x1)
		{i1=1;
		while (Table_value2[shift+i1]>=x2 && Table_value2[shift+i1]<=x1){i1++;}
		if (Table_value2[shift+i1]<x2)
			{
			value3=Low[shift]-Range*0.5;
			val2[shift]=value3;
			}
		}

      shift--;
     }

   return(0);
  }
//+------------------------------------------------------------------+
Comments