Here's a breakdown of what this MetaTrader script does, explained in a way that doesn't require programming knowledge:
Overall Purpose:
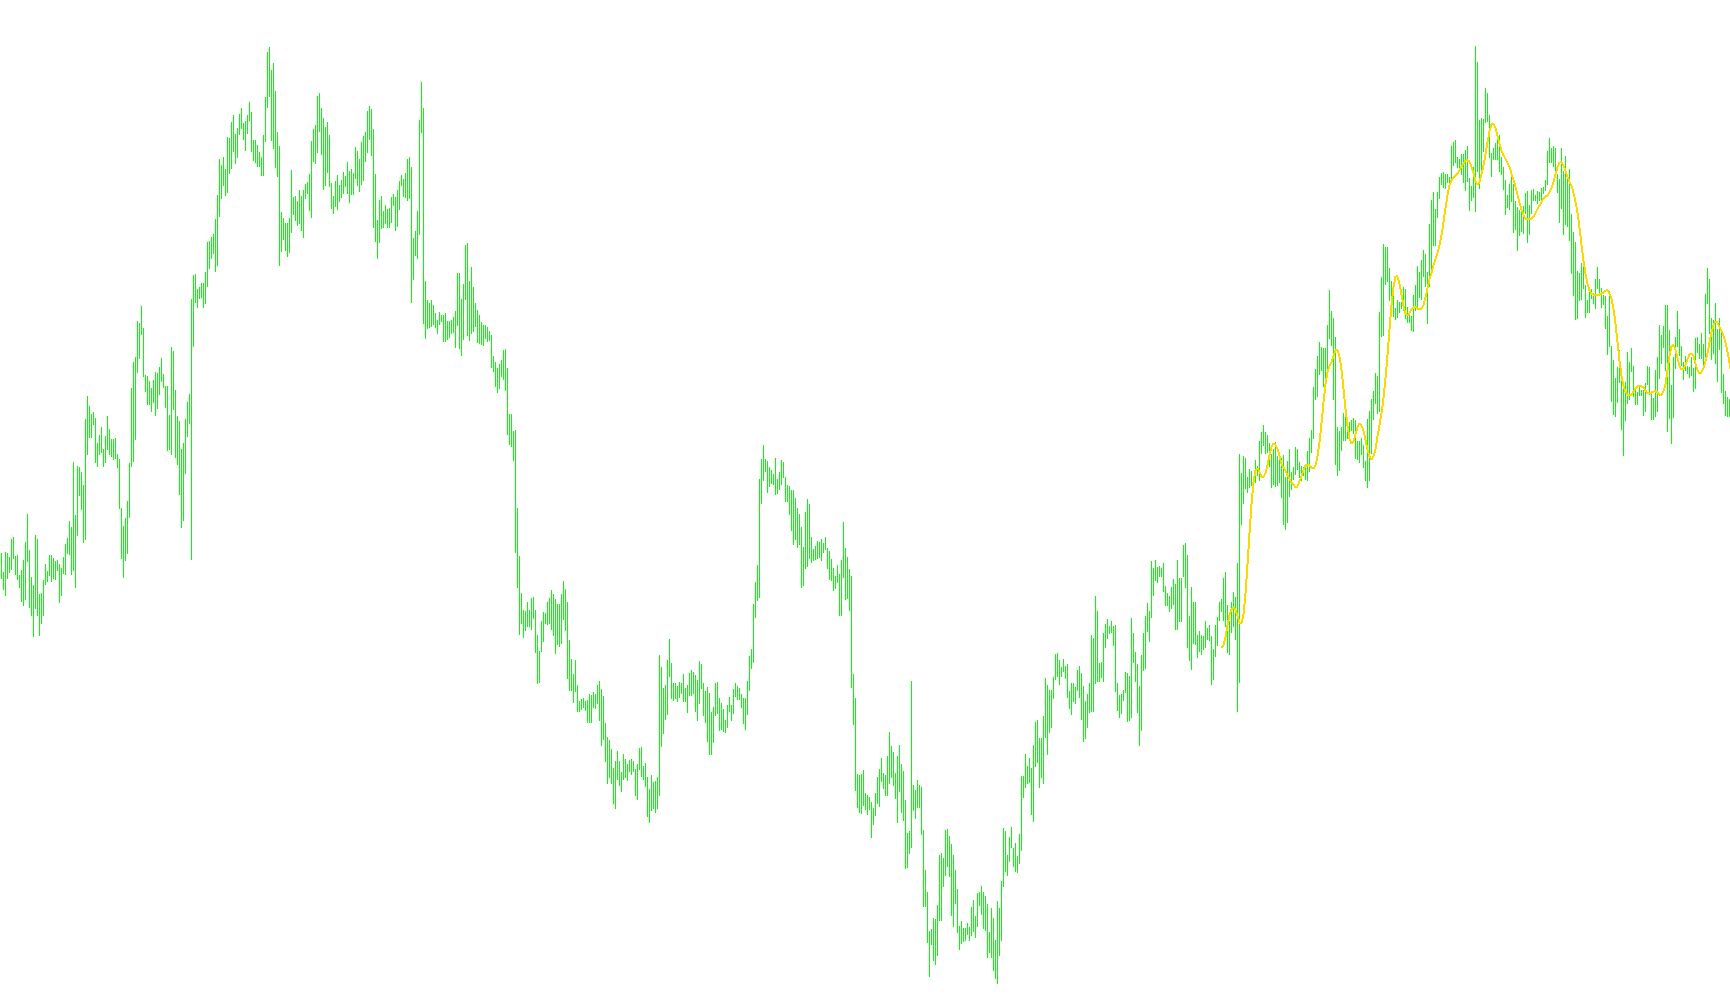
This script is designed to display a custom indicator on a trading chart within the MetaTrader platform. This indicator, called "RFTL," aims to provide insights into potential price movements. It does this by performing a complex calculation based on historical price data. The result of this calculation is plotted as a line on the chart, allowing traders to visually analyze the market.
Key Components and How They Work:
-
External Input (CountBars): The script has a setting that can be adjusted by the user called "CountBars". This setting determines how many historical price bars (periods of time represented on the chart) the indicator uses in its calculations. A higher number means the indicator considers more past data.
-
Data Storage (RFTLBuffer): The script uses a temporary storage area called "RFTLBuffer". This is where the results of the indicator's calculations are stored before being displayed on the chart. It holds the calculated value for each bar that the indicator is drawing on.
-
Initialization (init() function): When the script starts, this section prepares the indicator for display. It sets up the line that will be drawn on the chart, specifying its style (solid line) and color (SkyBlue). It also links the line to the storage area ("RFTLBuffer") so the line knows where to get its values to draw.
-
Calculation and Plotting (start() function): This is the heart of the script. It's where the actual calculations happen and where the indicator's line is drawn on the chart. Here's a more detailed breakdown of what happens within this section:
-
Data Preparation: First, the script determines from which bar it will start drawing, based on the "CountBars" setting and current bars on the chart.
-
Historical Price Analysis: The script accesses historical closing prices for each bar going back a certain number of periods. For each bar it considers, it retrieves the closing price of that bar, and of the 44 bars after that.
-
Weighted Calculation: The core of the indicator is a complex mathematical formula. This formula takes the closing prices of these 44 bars and multiplies each one by a specific weight, which are the numbers like "-0.02232324", "+0.02268676", etc. These weights determine how much influence each price has on the final indicator value. These weights are pre-defined, meaning they are fixed within the script and do not change dynamically.
-
Result Storage: The result of this weighted calculation is then stored in the "RFTLBuffer" for that particular bar.
-
Iterative Process: The script repeats this process for each bar, moving backward in time. This means that for each bar on the chart (within the "CountBars" range), the script calculates an indicator value and stores it.
-
Drawing the Indicator: Finally, the MetaTrader platform uses the values stored in "RFTLBuffer" to draw the SkyBlue line on the chart. Each value in the buffer corresponds to a point on the line, creating the visual representation of the indicator.
-
In Summary:
The script calculates and displays a custom technical indicator, "RFTL", on a MetaTrader chart. The indicator's value for each bar is determined by a weighted sum of the closing prices of the current and subsequent 44 bars. These calculated values are then plotted as a line, allowing traders to visually interpret the market.
//+------------------------------------------------------------------+
//| RFTL.mq4
//| Ramdass - Conversion only
//+------------------------------------------------------------------+
#property copyright "Copyright 2002, Finware.ru Ltd."
#property link "http://www.finware.ru/"

#property indicator_chart_window
#property indicator_buffers 1
#property indicator_color1 SkyBlue

extern int CountBars=300;
//---- buffers
double RFTLBuffer[];
//+------------------------------------------------------------------+
//| Custom indicator initialization function                         |
//+------------------------------------------------------------------+
int init()
  {
//---- indicator line
   SetIndexStyle(0,DRAW_LINE,STYLE_SOLID,2);
   SetIndexBuffer(0,RFTLBuffer);
//----
   return(0);
  }
//+------------------------------------------------------------------+
//| RFTL                                                             |
//+------------------------------------------------------------------+
int start()
  {
   SetIndexDrawBegin(0,Bars-CountBars+44);
   int i,counted_bars=IndicatorCounted();
//----
   if(Bars<=44) return(0);
//---- initial zero
   if(counted_bars<44)
      for(i=1;i<=0;i++) RFTLBuffer[CountBars-i]=0.0;
//----
   i=CountBars-44-1;
//   if(counted_bars>=44) i=Bars-counted_bars-1;
   while(i>=0)
     {
      RFTLBuffer[i]=
-0.02232324*Close[i+0]
+0.02268676*Close[i+1]
+0.08389067*Close[i+2]
+0.14630380*Close[i+3]
+0.19282649*Close[i+4]
+0.21002638*Close[i+5]
+0.19282649*Close[i+6]
+0.14630380*Close[i+7]
+0.08389067*Close[i+8]
+0.02268676*Close[i+9]
-0.02232324*Close[i+10]
-0.04296564*Close[i+11]
-0.03980614*Close[i+12]
-0.02082171*Close[i+13]
+0.00243636*Close[i+14]
+0.01950580*Close[i+15]
+0.02460929*Close[i+16]
+0.01799295*Close[i+17]
+0.00470540*Close[i+18]
-0.00831985*Close[i+19]
-0.01544722*Close[i+20]
-0.01456262*Close[i+21]
-0.00733980*Close[i+22]
+0.00201852*Close[i+23]
+0.00902504*Close[i+24]
+0.01093067*Close[i+25]
+0.00766099*Close[i+26]
+0.00145478*Close[i+27]
-0.00447175*Close[i+28]
-0.00750446*Close[i+29]
-0.00671646*Close[i+30]
-0.00304016*Close[i+31]
+0.00143433*Close[i+32]
+0.00457475*Close[i+33]
+0.00517589*Close[i+34]
+0.00336708*Close[i+35]
+0.00034406*Close[i+36]
-0.00233637*Close[i+37]
-0.00352280*Close[i+38]
-0.00293522*Close[i+39]
-0.00114249*Close[i+40]
+0.00083536*Close[i+41]
+0.00215524*Close[i+42]
+0.00604133*Close[i+43]
-0.00013046*Close[i+44];

      i--;
     }
   return(0);
  }
//+------------------------------------------------------------------+
Comments