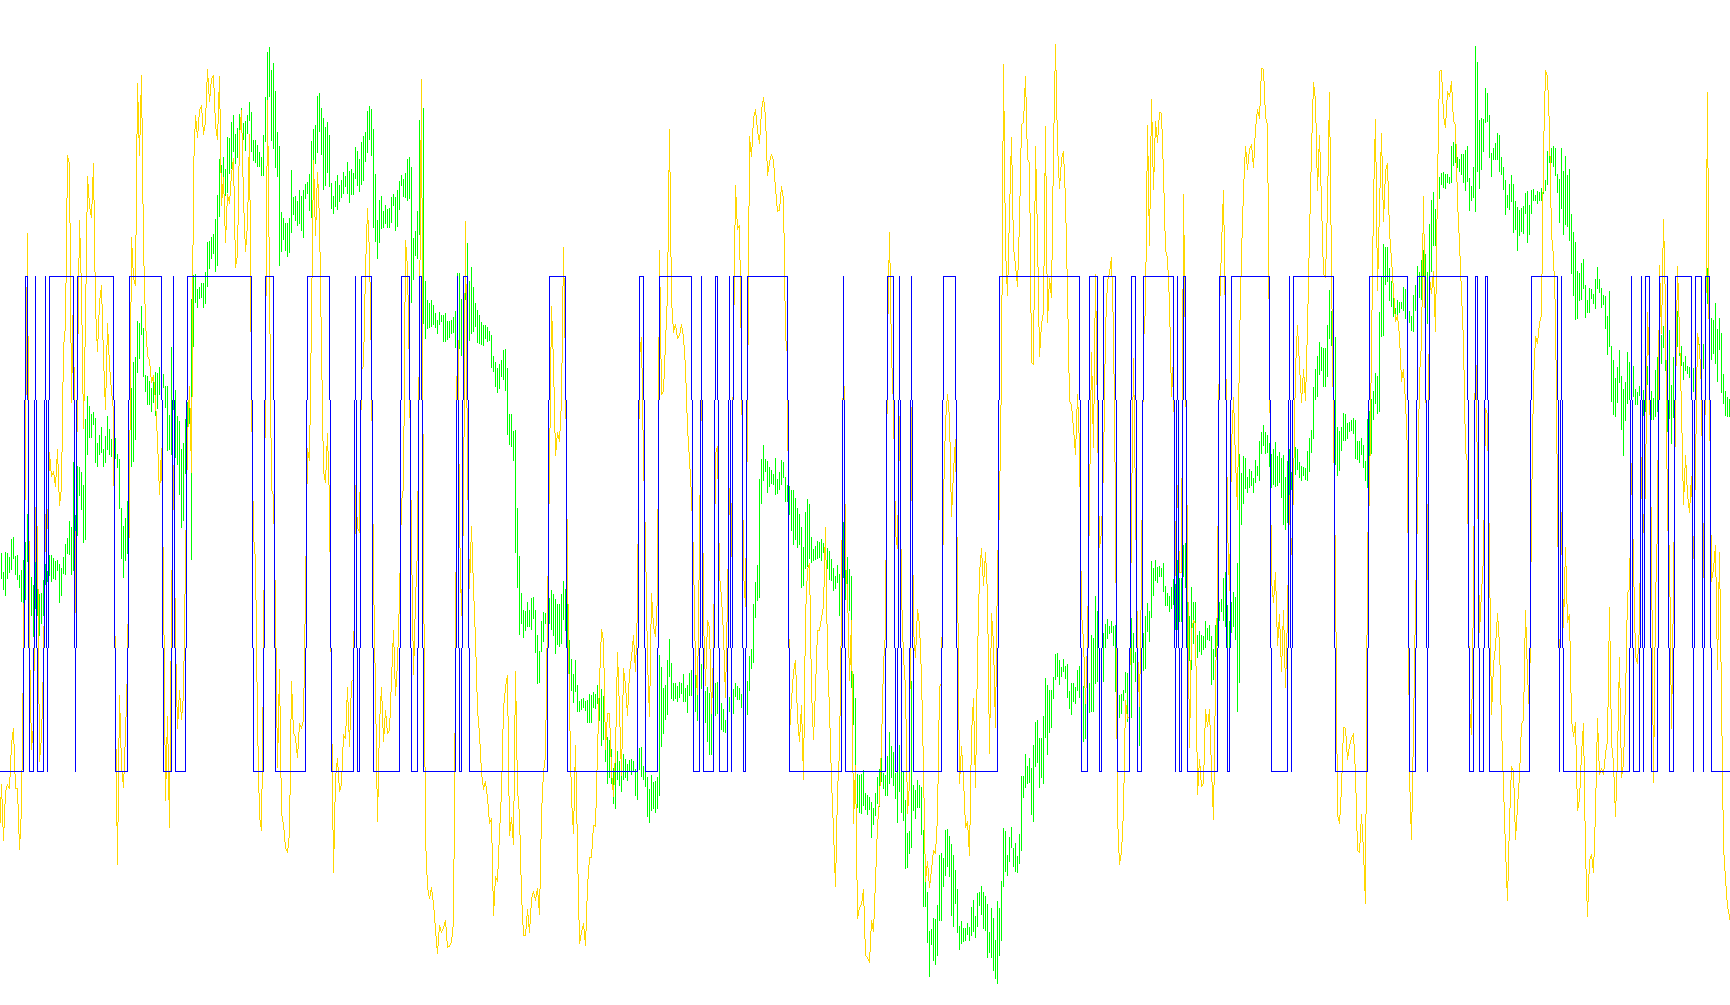
This tool is designed as a visual trend indicator that helps traders identify momentum and shifts in market direction. It works by analyzing the relationship between recent price action and historical highs and lows over a specific timeframe.
How it Works
The logic follows a three-step process to determine the strength of a trend:
1. Measuring Market Energy The script looks at two different "windows" of time simultaneously. It identifies:
- Recent Activity: The highest high and lowest low within the most immediate price action.
- Historical Context: The highest high and lowest low over a longer period (determined by the user-defined bar count).
By comparing these two areas, it calculates "Buy Power" and "Sell Power." Essentially, it measures how aggressively the price is pushing toward new extremes compared to where it was recently.
2. Calculating the Trend Score (TTF) The script then converts this raw energy into a percentage-based score. This score tells you which side of the market has more "weight":
- If the recent price action shows significantly more strength than the historical context, the score shifts upward.
- If the historical context remains stronger than the current immediate movement, the score stays lower.
3. Visual Signals The indicator provides two visual elements to help with decision-making:
- The Main Line: This represents the fluctuating trend score. It shows the continuous flow of market momentum.
- The Signal Line: This acts as a binary filter. Instead of showing a complex average, it simplifies the data into clear zones. When the trend score is positive, the signal reflects a "Top" state; when it falls below zero, it reflects a "Bottom" state.
Summary for the Trader
This script helps filter out market noise by focusing on relative strength. Rather than just looking at where the price is going, it looks at how fast and strongly it is moving relative to its recent past. It is intended to help users identify when a trend is gaining significant momentum or when the market energy is beginning to shift from one direction to another.
/*-----------------------------+
|			       |
| Shared by www.Aptrafx.com    |
|			       |
+------------------------------*/

//+------------------------------------------------------------------+
//|                                       Trendscalpindic.mq4        |
//|                        Based on Nick Bilak's TTF implementation  |
//|                                                                  |
//+------------------------------------------------------------------+
#property copyright "Copyright © 2005, Nick Bilak"
#property link      "beluck[at]gmail.com"

#property indicator_separate_window
#property indicator_buffers 2
#property indicator_color1 LightSeaGreen
#property indicator_color2 Red
//---- input parameters
extern int TTFbars=15;
//15=default number of bars for computation
//---- buffers
double MainBuffer[];
double SignalBuffer[];
//----
int TopLine=100;
int BottomLine=-100;
int t3_period=3;
double b=0.7;
int draw_begin1=0;
int draw_begin2=0;
double b2=0;
double b3=0;
double c1=0;
double c2=0;
double c3=0;
double c4=0;
double r=0;
double w1=0;
double w2=0;
double e1 = 0;
double e2 = 0;
double e3 = 0;
double e4 = 0;
double e5 = 0;
double e6 = 0;
double  HighestHighRecent=0;
double  HighestHighOlder =0;
double  LowestLowRecent =0;
double  LowestLowOlder =0;
double  BuyPower =0;
double  SellPower=0;
double  TTF=0;

//+------------------------------------------------------------------+
//| Custom indicator initialization function                         |
//+------------------------------------------------------------------+
int init()
  {
   string short_name;
//---- 2 additional buffers are used for counting.
   IndicatorBuffers(2);
//---- indicator lines
   SetIndexStyle(0,DRAW_LINE);
   SetIndexBuffer(0, MainBuffer);
   SetIndexStyle(1,DRAW_LINE);
   SetIndexBuffer(1, SignalBuffer);
//---- name for DataWindow and indicator subwindow label
   short_name="TrendscalpIndic("+TTFbars;
   IndicatorShortName(short_name);
   SetIndexLabel(0,short_name);
   SetIndexLabel(1,"Signal");
//----
   draw_begin1=TTFbars*2+1;
   draw_begin2=draw_begin1;
   SetIndexDrawBegin(0,draw_begin1);
   SetIndexDrawBegin(1,draw_begin2);

   /*b2=b*b;
   b3=b2*b;
   c1=-b3;
   c2=(3*(b2+b3));
   c3=-3*(2*b2+b+b3);
   c4=(1+3*b+b3+3*b2);

   r=t3_period;

   if (r<1) r=1;
   r = 1 + 0.5*(r-1);
   w1 = 2 / (r + 1);
   w2 = 1 - w1;
   */
//----
   return(0);
  }
//+------------------------------------------------------------------+
//| ttf                                            |
//+------------------------------------------------------------------+
int start()
  {
   int    i,k;
   int    counted_bars=IndicatorCounted();
   double price;
//----
   if(Bars<=draw_begin2) return(0);
//---- initial zero
   if(counted_bars<1)
     {
      for(i=1;i<=draw_begin1;i++) MainBuffer[Bars-i]=0;
      for(i=1;i<=draw_begin2;i++) SignalBuffer[Bars-i]=0;
     }
//---- %K line
   i=Bars-draw_begin1;
   if(counted_bars>draw_begin1) i=Bars-counted_bars-1;
   while(i>=0)
     {
   HighestHighRecent=High[Highest(NULL, 0, MODE_HIGH,1,i)];
   HighestHighOlder=High[Highest(NULL, 0, MODE_HIGH,TTFbars,i+1)];
   LowestLowRecent=Low [Lowest (NULL, 0, MODE_LOW,1,i)];
   LowestLowOlder=Low [Lowest (NULL, 0, MODE_LOW,TTFbars,i)];
   BuyPower=HighestHighRecent-LowestLowOlder;
   SellPower=HighestHighOlder-LowestLowRecent;
   TTF=(BuyPower-SellPower)/(0.5*(BuyPower+SellPower))*100;
/*
  e1 = w1*TTF + w2*e1;
  e2 = w1*e1 + w2*e2;
  e3 = w1*e2 + w2*e3;
  e4 = w1*e3 + w2*e4;
  e5 = w1*e4 + w2*e5;
  e6 = w1*e5 + w2*e6;

  TTF = c1*e6 + c2*e5 + c3*e4 + c4*e3;
*/

  MainBuffer[i]=TTF;
  i--;
 }
//---- last counted bar will be recounted
   if(counted_bars>0) counted_bars--;
   int limit=Bars-counted_bars;
//---- signal line is simple movimg average
   for(i=0; i<limit; i++) {
      if (MainBuffer[i]>=0)
         SignalBuffer[i]=TopLine;
      else
         SignalBuffer[i]=BottomLine;
   }
//----
   return(0);
  }
//+------------------------------------------------------------------+
Comments