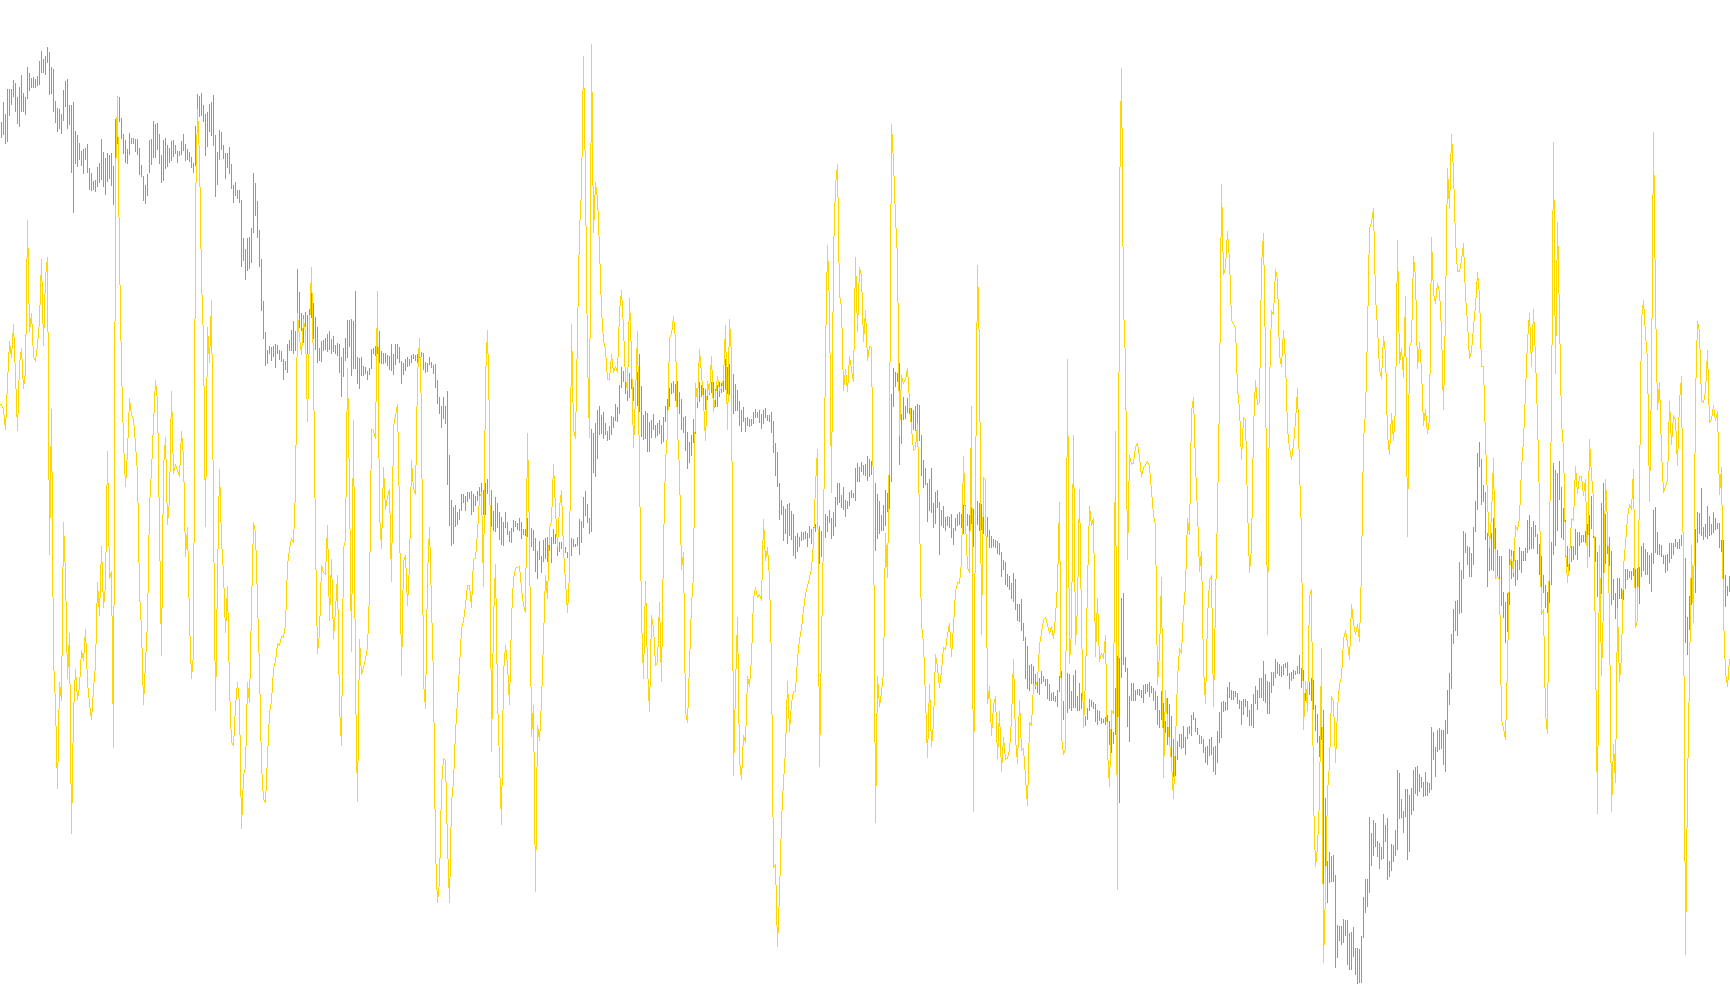
This technical tool is designed to provide traders with a visual measurement of where the current price sits in relation to established market boundaries. It specifically utilizes a mathematical concept known as Bollinger Bands to determine the "relative position" of the price, presenting this information as a distinct line on your trading platform.
Core Logic and Functionality
The script works by analyzing two key components of market volatility: the upper and lower boundaries of price action over a specific timeframe. Rather than just showing you the price itself, this tool calculates the distance between the current closing price and these boundaries to tell you how "extreme" the current movement is.
How it processes data:
- Boundary Identification: The tool looks back at a user-defined number of previous price bars (the Period) to calculate the typical range of price fluctuations. It establishes an upper limit and a lower limit based on standard market deviations.
- Relative Positioning: For every new price update, the script identifies where the closing price falls between those two limits.
- The Percentage Calculation: The final output is a normalized value. It essentially answers the question: "On a scale of 0 to 1, where does the current price sit within the established range?"
How to Interpret the Results
By transforming complex volatility data into a single continuous line, the tool helps traders identify market sentiment at a glance:
- High Values: When the line moves toward the top of its scale, it indicates that the price is pushing against the upper boundary, suggesting strong upward momentum or an overbought condition.
- Low Values: When the line moves toward the bottom of the scale, it suggests the price is hugging the lower boundary, indicating downward pressure or an oversold condition.
- Mid-Range Values: When the line stays near the center, it signals that the price is trading within its "normal" expected range, showing a lack of extreme trend direction.
In summary, this script serves as a momentum and positioning gauge, stripping away the noise of raw price movements to show you exactly how aggressively the market is moving relative to its recent history.
//+-------------------------------------------------------------------+
//|                                            Bollinger Bands %b.mq4 |
//|                       Copyright © 2004, MetaQuotes Software Corp. |
//|                                         http://www.metaquotes.net |
//|                                     Modified by Alejandro Galindo |
//|                                                                   |
//|                                            You are free to use it |
//|                                                                   |
//|       If you want and if this work/modification is helpful to you |
//|              you can send me a PayPal donation to ag@elcactus.com |
//+-------------------------------------------------------------------+
#property copyright "Copyright © 2004, MetaQuotes Software Corp."
#property link      "http://www.metaquotes.net/"

#property indicator_separate_window
#property indicator_buffers 1
#property indicator_color1 Yellow
//---- input parameters
extern int BBPeriod=20;
extern int StdDeviation=2;
//---- buffers
double BLGBuffer[];
//+------------------------------------------------------------------+
//| Custom indicator initialization function                         |
//+------------------------------------------------------------------+
int init()
  {
   string short_name;
//---- indicator line
   SetIndexStyle(0,DRAW_LINE);
   SetIndexBuffer(0,BLGBuffer);
//---- name for DataWindow and indicator subwindow label
   short_name="BBpB("+BBPeriod+","+StdDeviation+")";
   IndicatorShortName(short_name);
   SetIndexLabel(0,short_name);
//----
   SetIndexDrawBegin(0,BBPeriod);
//----
   return(0);
  }
//+------------------------------------------------------------------+
//| Momentum                                                         |
//+------------------------------------------------------------------+
int start()
  {
   int i,counted_bars=IndicatorCounted();
//----
   if(Bars<=BBPeriod) return(0);
//---- initial zero
   if(counted_bars<1)
      for(i=1;i<=BBPeriod;i++) BLGBuffer[Bars-i]=0.0;
//----
   i=Bars-BBPeriod-1;
   if(counted_bars>=BBPeriod) i=Bars-counted_bars-1;
   while(i>=0)
     {
      BLGBuffer[i]=(Close[i]-iBands(NULL,0,BBPeriod,StdDeviation,0,0,MODE_HIGH,i))/(iBands(NULL,0,BBPeriod,StdDeviation,0,0,MODE_LOW,i)-iBands(NULL,0,BBPeriod,StdDeviation,0,0,MODE_HIGH,i));
      i--;
     }
   return(0);
  }
//+------------------------------------------------------------------+
Comments