Bollinger Band Width
Download script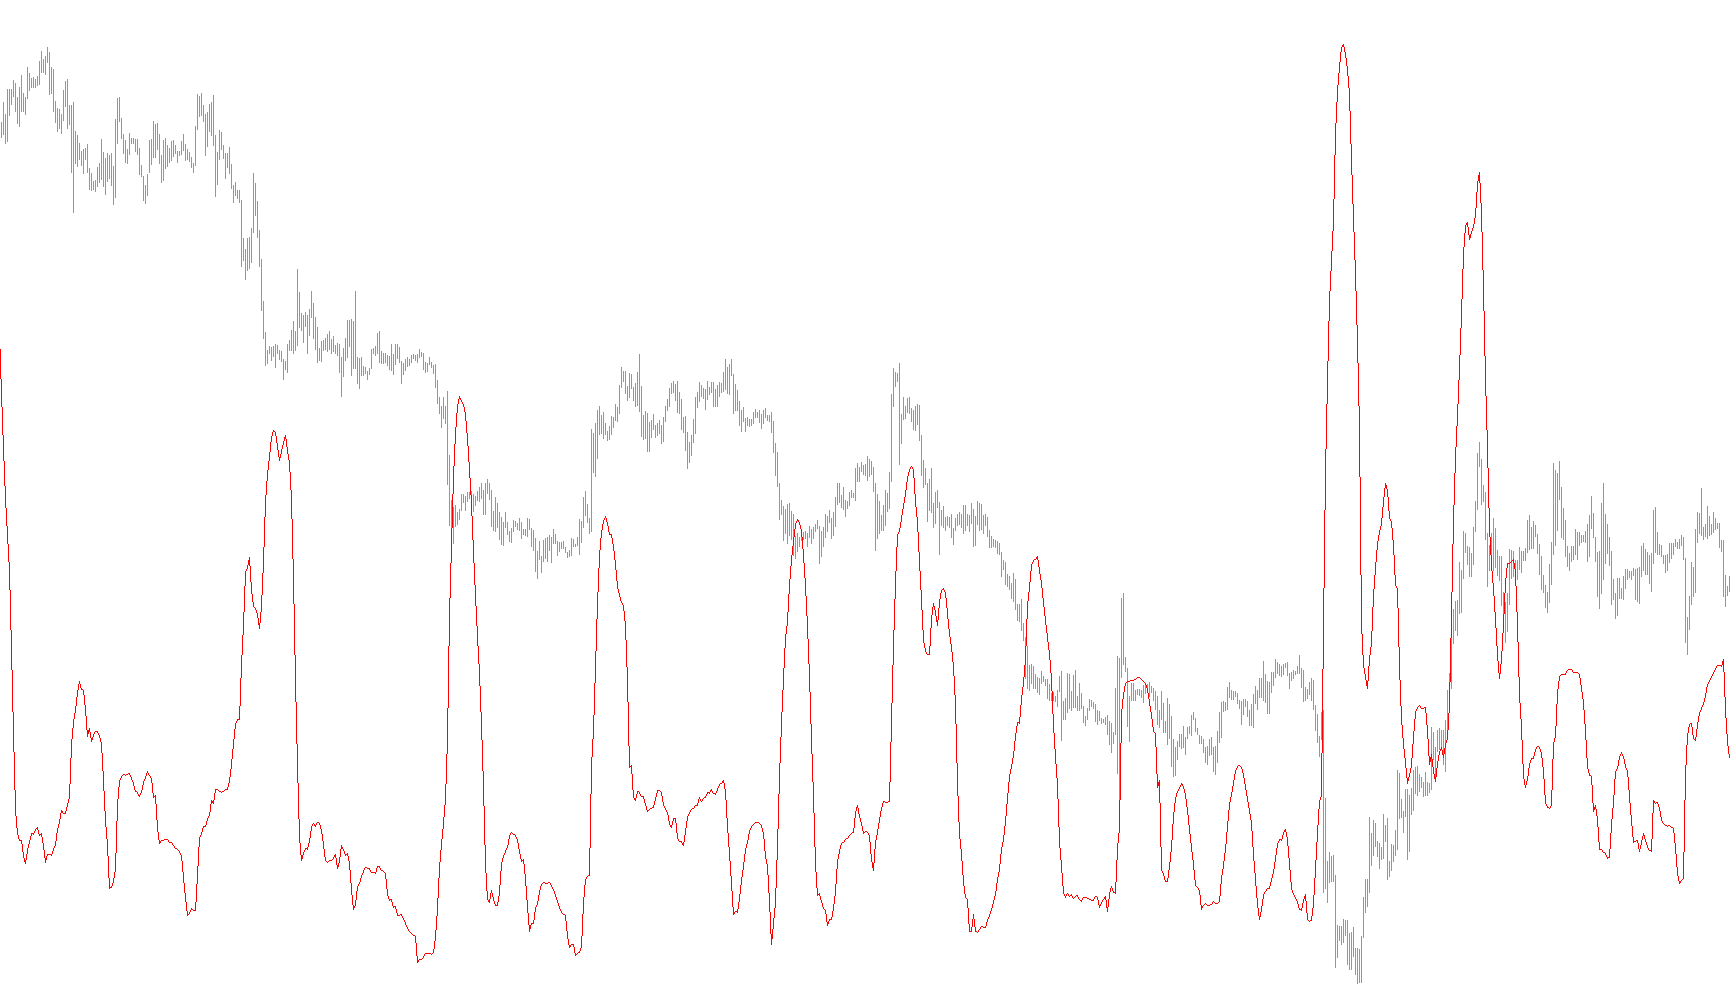
This tool is designed to provide traders with a clear visual representation of market volatility by calculating the distance between two key technical boundaries. Instead of looking at price action directly, this script focuses on the "spread" or the "gap" of the Bollinger Bands.
How it Works
The logic follows a three-step process to translate raw market data into a single, readable value:
1. Identifying the Boundaries The script looks at a specific number of past price candles (defined by the user) and calculates two moving boundaries: an Upper Band and a Lower Band. These bands typically represent the "normal" range where the price spends most of its time.
2. Calculating the Difference Rather than showing you these two lines as separate entities, the script subtracts the value of the lower band from the upper band. The result is a single numerical figure that represents the total width of the volatility corridor at any given moment.
3. Real-Time Visualization and Feedback The tool displays this information in two ways:
- A Visual Line: It draws a red line in a separate window on your chart, allowing you to see how the market's volatility expands and contracts over time.
- Live Text Summary: It provides a real-time text update on your screen. This summary shows the current difference as a raw decimal number and automatically converts it into "Pips," which is the standard unit of measurement used by traders to understand price movement easily.
What this means for the Trader
Essentially, this script simplifies complex market data into a single metric. When the resulting value is high, it indicates that the market is experiencing significant price swings (high volatility). When the value is low, it suggests the market is moving sideways or consolidating (low volatility). It allows you to monitor the "breathing room" of the market at a glance without having to manually calculate the distance between price indicators.
//+------------------------------------------------------------------+
//|                                                      BB_Diff.mq4 |
//|                                       Copyright © 2006, Akuma99. |
//|                                    http://www.beginnertrader.com |
//+------------------------------------------------------------------+
#property copyright "Copyright © 2006, Akuma99."
#property link      "http://www.beginnertrader.com"

#property indicator_separate_window
#property indicator_color1 Red

extern double bbPeriod=20;
extern double bbDev=2.0;
extern string displayText="Bollinger Band Difference:";

double bbw[];

int init() {

   SetIndexStyle(0,DRAW_LINE,EMPTY,1,Red);
   SetIndexBuffer(0,bbw);

   return(0);

}

int start() {

   int    counted_bars=IndicatorCounted();

   double upperBand,lowerBand,bandDifference;

   int   limit = Bars-counted_bars;
   int   i;

   for (i=limit; i>=0; i--) {

      upperBand = iBands(NULL,0,bbPeriod,bbDev,0,PRICE_CLOSE,MODE_UPPER,i);
      lowerBand = iBands(NULL,0,bbPeriod,bbDev,0,PRICE_CLOSE,MODE_LOWER,i);

      bandDifference = upperBand-lowerBand;

      bbw[i] = bandDifference;

   }

   Comment("\n",displayText," ", bandDifference, " (", bandDifference/Point," Pips)");

   return(0);

}
Comments