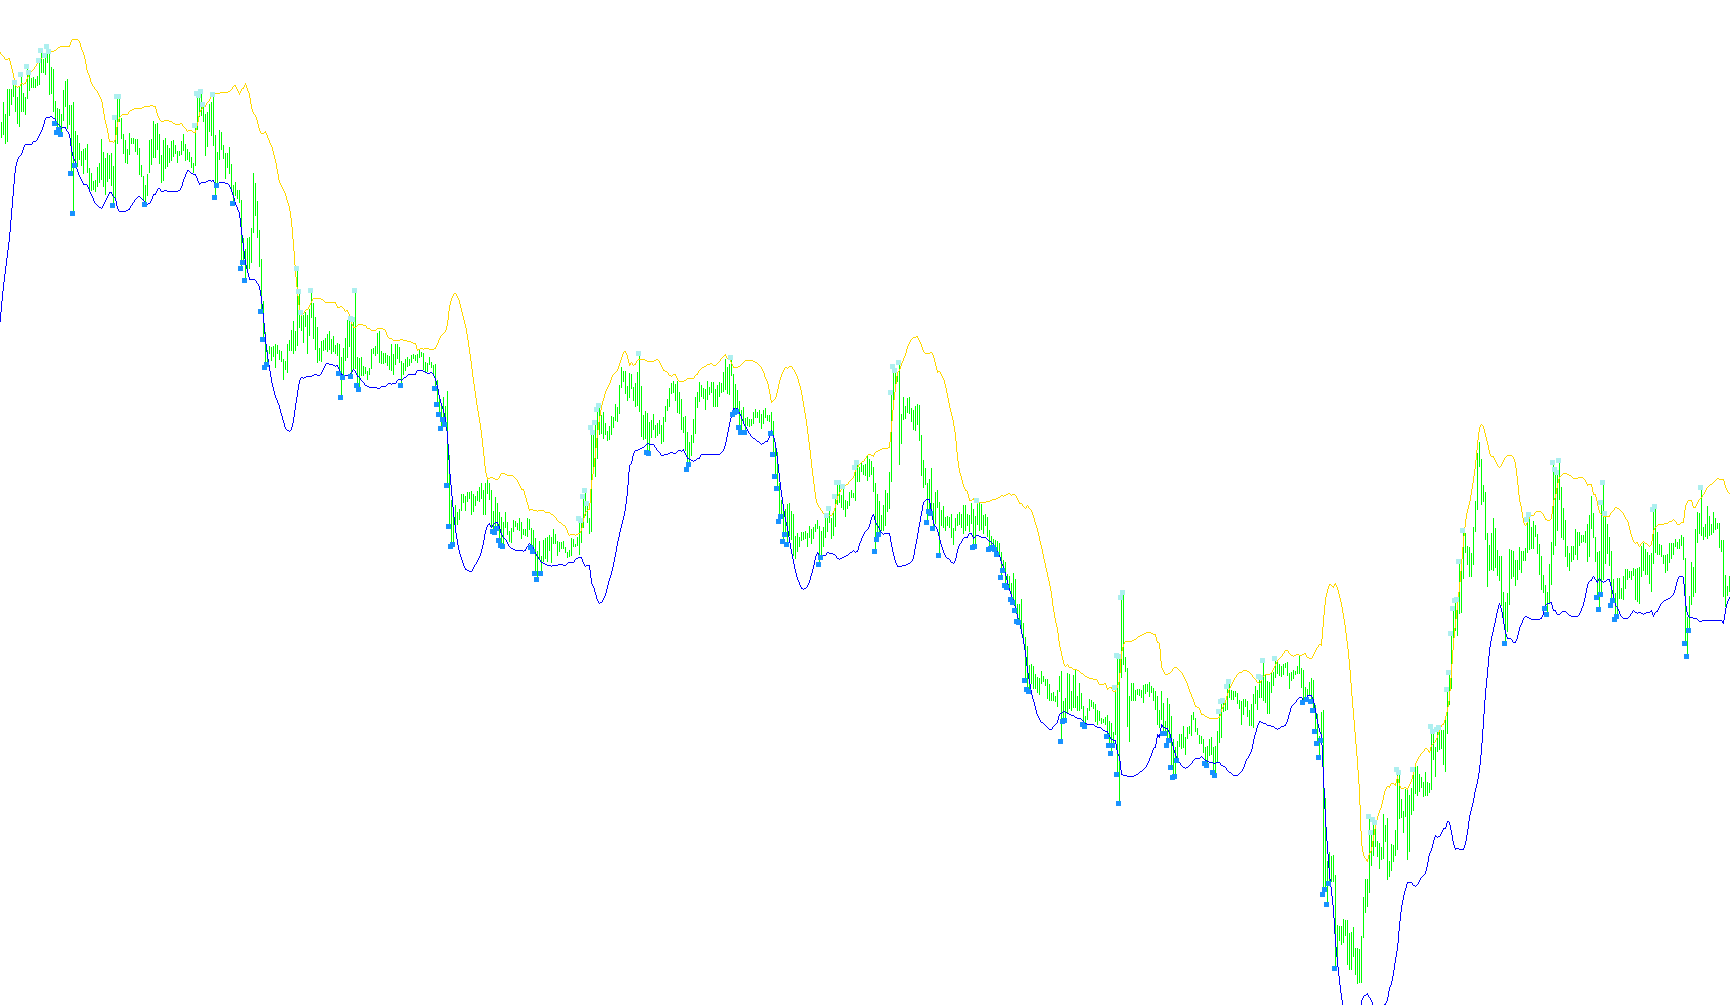
This trading tool is designed to identify specific price action patterns known as "Gimme-Bars" based on the principles outlined in the Joe Ross Trading Manual. It serves as a visual aid to help traders spot potential reversal points by monitoring the relationship between current market prices and set volatility boundaries.
Core Logic and Functionality
The script operates by calculating two dynamic boundary lines (Bollinger Bands) on your chart. These bands act as "ceiling" and "floor" markers that adjust based on a specific period of historical price movement and a defined level of deviation.
The indicator looks for the following specific behaviors:
-
Upper Boundary Interaction (Potential Sell Signals): The tool monitors when the market price moves upward and touches or exceeds the upper boundary line. When this occurs, it identifies a "Gimme-Bar." The script then places a visual marker on the chart to highlight that the price has reached a point of extreme tension, suggesting it may be overextended to the upside.
-
Lower Boundary Interaction (Potential Buy Signals): Similarly, the tool monitors when the market price moves downward and touches or exceeds the lower boundary line. It marks these instances with specific indicators on the chart, signaling that the price may have reached an extreme level on the downside, potentially making it a candidate for a move back upward.
Visual and Audible Feedback
To ensure the trader can react in real-time, the script provides several layers of feedback:
- Dynamic Plotting: It draws the two primary boundary lines continuously across your chart so you can see the "trading lane" clearly.
- Markers: Instead of just drawing lines, it places specific arrow-like markers directly on the bars where the price interacts with the boundaries. This allows you to quickly scan historical data to see where these setups occurred in the past.
- Real-Time Alerts: The script includes a notification system. When a new "Gimme-Bar" is identified on the current live candle, the tool can trigger an audible sound alert. It is programmed to ensure that these alerts only trigger once per bar to avoid repetitive noise, providing a clear signal when the price hits a significant threshold.
Summary for the Trader
Essentially, this script automates the "watching" process. Rather than you having to manually track every candle to see if it touches the Bollinger Bands, the tool highlights those specific moments of high-volatility interaction automatically, marking them on your screen and alerting you when they happen in live market conditions.
//+------------------------------------------------------------------+
//|                                                     Gimmebar.mq4 |
//| See Joe Ross Trading Manual on Gimme-Bars (e.g. from the         |
//| library on www.trading-naked.com)                                |
//|Bolllitouch - yet another perky mod                               |
//+------------------------------------------------------------------+
#property  copyright "by Shimodax, 2005"
#property  link      "http://www.strategybuilder.com"
//---- indicator settings
#property  indicator_chart_window
#property  indicator_buffers 6
#property  indicator_color1  SlateBlue
#property  indicator_color2  SlateBlue
#property  indicator_color3  Red
#property  indicator_color4  LightBlue
#property  indicator_color5  Red
#property  indicator_color6  LightBlue
//---- indicator parameters
extern int BobaPeriod= 20;
extern int BobaDeviations= 2;
extern bool Use_Sound=true;
//---- indicator buffers
double     BufferBand1[];
double     BufferBand2[];
double     BufferSell[];
double     BufferBuy[];
double     BufferSellEntry[];
double     BufferBuyEntry[];
string UD="";
//+------------------------------------------------------------------+
//|                                                                  |
//+------------------------------------------------------------------+
int init()
  {
//---- 2 additional buffers are used for counting.
   IndicatorDigits(MarketInfo(Symbol(),MODE_DIGITS)+2);
   // two bollies
   SetIndexBuffer(0,BufferBand1);
   SetIndexStyle(0,DRAW_LINE);
   SetIndexDrawBegin(0,BobaPeriod);
   //
   SetIndexBuffer(1,BufferBand2);
   SetIndexStyle(1,DRAW_LINE);
   SetIndexDrawBegin(1,BobaPeriod);
   //
   SetIndexBuffer(2,BufferSell);
   SetIndexStyle(2,DRAW_ARROW);
   SetIndexDrawBegin(2,BobaPeriod);
   SetIndexArrow(2, 167);
   SetIndexEmptyValue(2, 0);
   //
   SetIndexBuffer(3,BufferBuy);
   SetIndexStyle(3,DRAW_ARROW);
   SetIndexDrawBegin(3,BobaPeriod);
   SetIndexArrow(3, 167);
   SetIndexEmptyValue(3, 0);
   //
   SetIndexBuffer(4,BufferSellEntry);
   SetIndexStyle(4,DRAW_ARROW);
   SetIndexDrawBegin(4,BobaPeriod);
   SetIndexArrow(4, 238);
   SetIndexEmptyValue(4, 0);
   //
   SetIndexBuffer(5,BufferBuyEntry);
   SetIndexStyle(5,DRAW_ARROW);
   SetIndexDrawBegin(5,BobaPeriod);
   SetIndexArrow(5, 236);
   SetIndexEmptyValue(5, 0);
//---- name for DataWindow and indicator subwindow label
   // IndicatorShortName("GimmeBar ");
//---- initialization done
   return(0);
  }
//+------------------------------------------------------------------+
//| Custom indicator iteration function                              |
//+------------------------------------------------------------------+
int start()
  {
   int counted_bars= IndicatorCounted(),
   lastbar;
   if (counted_bars>0)
      counted_bars--;
   lastbar= Bars - counted_bars;
   GimmeeBar(0, lastbar, BufferSell, BufferBuy, BufferSellEntry, BufferBuyEntry, BufferBand1, BufferBand2, BobaPeriod, BobaDeviations);
   return(0);
  }
//+------------------------------------------------------------------+
//| Mark Gimmee-Bars and mark possible entries for deals             |
//+------------------------------------------------------------------+
double GimmeeBar(int offset, int lastbar, double &sellbuf[], double &buybuf[], double &sellbuf2[], double &buybuf2[],
                  double &band1buf[], double&band2buf[], int period, int deviation)
  {
   double band1, band2;
   int markerdist= 5;   // distance between bars and marker dots
   lastbar= MathMin(Bars-period, lastbar);
//---- main loop
     for(int i= lastbar; i>=offset; i--)
     {
      sellbuf[i]= 0;
      buybuf[i]=0;
      sellbuf2[i]= 0;
      buybuf2[i]=0;
      band1= iBands(NULL,0, period, deviation, 0, PRICE_CLOSE, MODE_UPPER, i);
      band2= iBands(NULL,0, period, deviation, 0, PRICE_CLOSE, MODE_LOWER, i);
      band1buf[i]= band1;
      band2buf[i]= band2;
      // 1. Prices were rising.
      // 2. Prices touched the upper band.
      // 3. The price bar closed lower than it
      // opened when prices were previously rising.
      // or vice versa
        if (High[i]>=band1)
        {
         sellbuf[i]= High[i] + markerdist*Point;
         if (i < 2 )
           {
            UD="m Down";
            DoAlert(UD);
           }
        }
        if (Low[i]<=band2)
        {
         buybuf[i]= Low[i] - markerdist*Point;
         if (i < 2 )

           {
            UD="m Up.";
            DoAlert(UD);
           }
        }
      // Should such a price bar occur, a sell short order is to be executed
      // one tick below the low of the Gimmee bar.
      // if (sellbuf[i+1]!=0 && Low[i]<Low[i+1]-1*Point)
      // {
      //   sellbuf2[i]= Low[i+1]-1*Point;
      // }
      // if (buybuf[i+1]!=0 && High[i]>High[i+1]+1*Point)
      // {
      //    buybuf2[i]= High[i+1]+1*Point;
      // }
     }
   /*
   if (DebugLogger)
      Print(TimeOffset(offset), "BG-GimmeBar ", "");
   */
   return(0);
  }
//+------------------------------------------------------------------+
void DoAlert(string UD)
  {
   if (!NewBar() || !Use_Sound)
      return;
   PlaySound ("Alert2");
  }
//+------------------------------------------------------------------+
//|                                                                  |
//+------------------------------------------------------------------+
  bool NewBar()
  {
   static datetime dt =0;
   if (dt!=Time[0])
     {
      dt=Time[0];
      return(true);
     }
  }
//+------------------------------------------------------------------+
Comments