Here's a breakdown of what this MetaTrader script does, explained in a way that's easy to understand for someone who doesn't code:
Overall Purpose:
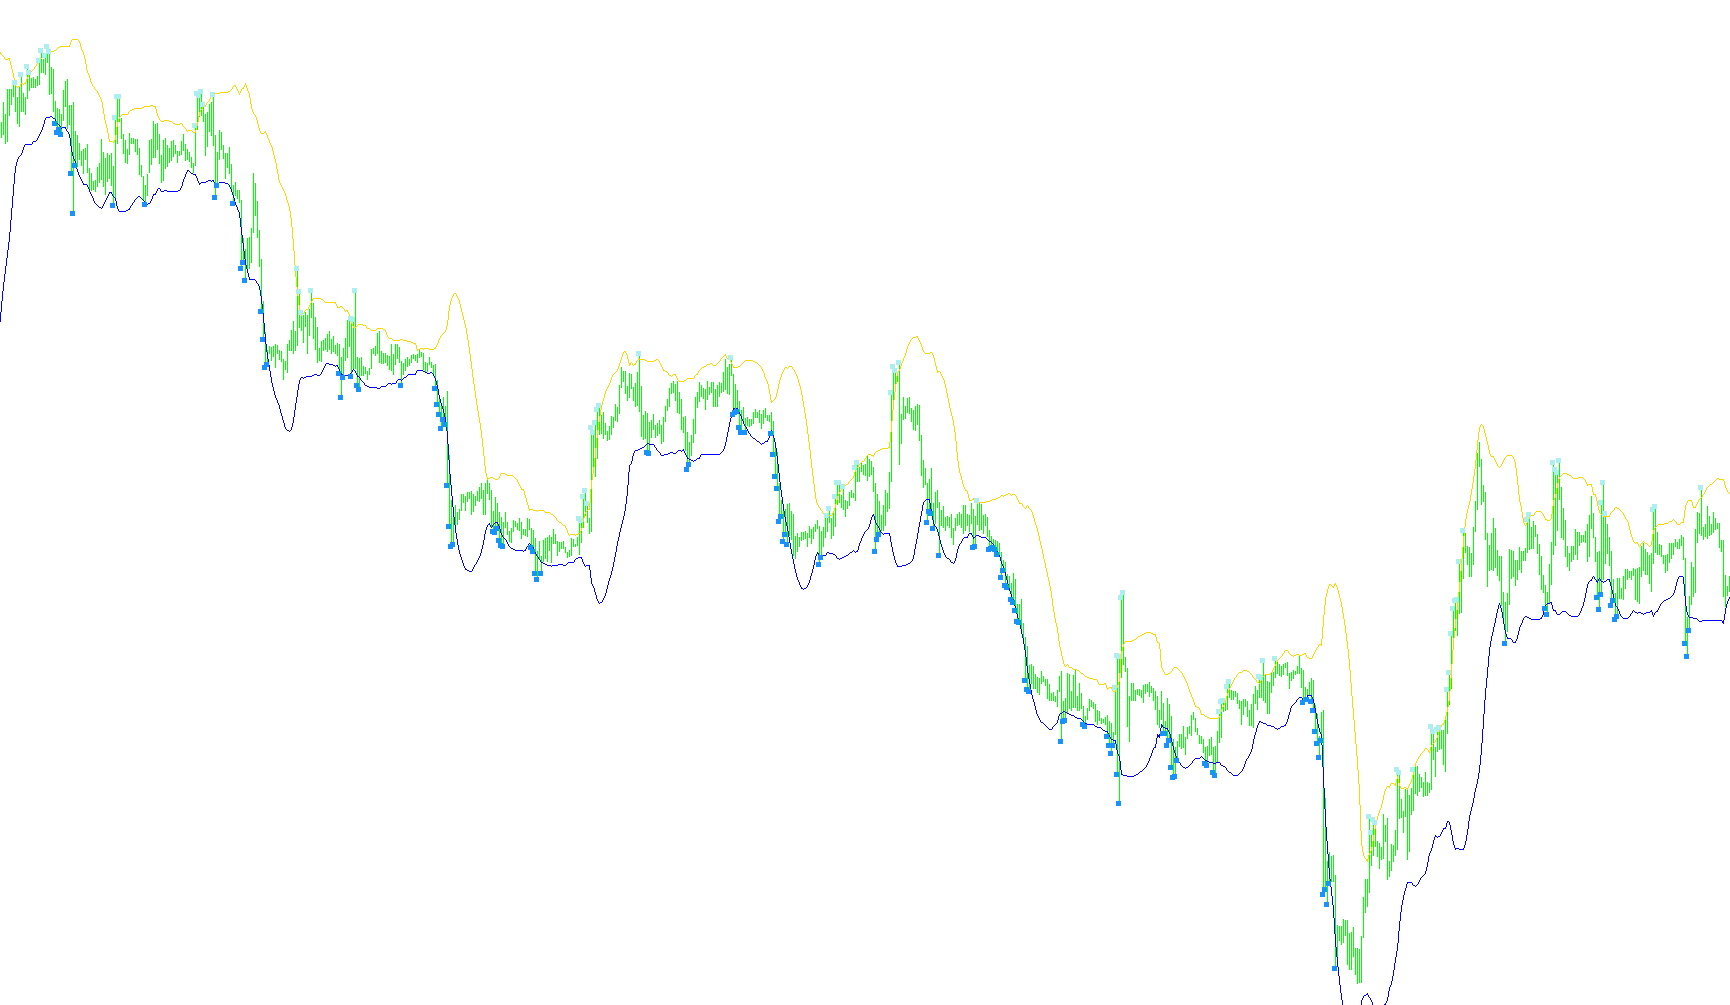
This script is designed to visually identify potential trading opportunities on a price chart based on a specific strategy called "Gimme Bars" and "BolliTouch" (likely a modification of Bollinger Bands). It looks for moments when the price of an asset interacts with specific price levels calculated by the script, and it marks these occurrences on the chart with arrows. It also alerts you to these events.
Core Concepts:
-
Bollinger Bands (BobaPeriod, BobaDeviations): The script uses a tool called Bollinger Bands, which are lines plotted on the price chart. These bands are calculated based on the average price over a certain period (specified by "BobaPeriod") and how much the price typically varies from that average (specified by "BobaDeviations"). Think of the bands as a range where the price usually moves. The script uses these bands to identify when the price might be getting "too high" or "too low."
-
Gimme Bars: This script is looking for what are called Gimme Bars. These are price bars (a visual representation of the price movement over a specific time period) that meet specific criteria. Essentially the price touches or exceeds the external bands of the Bollinger band.
How the Script Works:
-
Initialization (init()):
- This part sets up the script when it's first loaded onto the chart.
- It defines the different visual elements that will be drawn on the chart (the Bollinger Bands and the arrows).
- It specifies the colors and styles of these elements.
-
Main Loop (start() and GimmeeBar()):
- The script constantly loops through recent price data, bar by bar, going backwards in time from the most recent bar.
- For each bar, it calculates the upper and lower Bollinger Bands.
- It then checks if the price of that bar satisfies the Gimme Bar and "BolliTouch" conditions:
- Did the high of the bar reach or exceed the upper Bollinger Band?
- Did the low of the bar reach or go below the lower Bollinger Band?
- If either of those conditions are met, the script draws an arrow on the chart to highlight that specific bar. A blue upward pointing arrow if the price touched the lower band (potential buy opportunity), and a pink downward pointing arrow if the price touched the upper band (potential sell opportunity).
- The arrow's position is slightly above or below the high/low of the bar to make it visually clear.
-
Alerts (DoAlert()):
- If the script identifies a Gimme Bar (i.e., it places an arrow), it can also trigger an alert.
- The alert can be a visual notification on the screen and/or a sound.
- The alerts are intended to draw your attention to potential trading opportunities as they happen.
In Simple Terms:
Imagine a rubber band stretched around the average price. This script looks for moments when the price stretches too far and touches that rubber band. When it sees this, it marks the spot with an arrow and can notify you, suggesting a possible trade in the opposite direction of the price movement. Think of it as a potential signal that the price might snap back towards the average.
//+------------------------------------------------------------------+
//|                                                     Gimmebar.mq4 |
//| See Joe Ross Trading Manual on Gimme-Bars (e.g. from the         |
//| library on www.trading-naked.com)
//|Bolllitouch - yet another perky mod                                |
//+------------------------------------------------------------------+
#property  copyright "by Shimodax, 2005"
#property  link      "http://www.strategybuilder.com"


//---- indicator settings
#property  indicator_chart_window
#property  indicator_buffers 6
#property  indicator_color1  SlateBlue
#property  indicator_color2  SlateBlue
#property  indicator_color3  Pink
#property  indicator_color4  LightBlue
#property  indicator_color5  Pink
#property  indicator_color6  LightBlue


//---- indicator parameters
extern int BobaPeriod= 20;
extern int BobaDeviations= 2;
extern bool Alert_ON=true;
extern bool Use_Sound=true;

//---- indicator buffers
double     BufferBand1[];
double     BufferBand2[];
double     BufferSell[];
double     BufferBuy[];
double     BufferSellEntry[];
double     BufferBuyEntry[];
string UD="";


//+------------------------------------------------------------------+
//|                                                                  |
//+------------------------------------------------------------------+
int init()
{
   //---- 2 additional buffers are used for counting.

   IndicatorDigits(MarketInfo(Symbol(),MODE_DIGITS)+2);

   // two bollies
   SetIndexBuffer(0,BufferBand1);
   SetIndexStyle(0,DRAW_LINE);
   SetIndexDrawBegin(0,BobaPeriod);

   SetIndexBuffer(1,BufferBand2);
   SetIndexStyle(1,DRAW_LINE);
   SetIndexDrawBegin(1,BobaPeriod);

   // marks for gimmees
   SetIndexBuffer(2,BufferSell);
   SetIndexStyle(2,DRAW_ARROW);
   SetIndexDrawBegin(2,BobaPeriod);
   SetIndexArrow(2, 167);
   SetIndexEmptyValue(2, 0);

   SetIndexBuffer(3,BufferBuy);
   SetIndexStyle(3,DRAW_ARROW);
   SetIndexDrawBegin(3,BobaPeriod);
   SetIndexArrow(3, 167);
   SetIndexEmptyValue(3, 0);

   // marks for entries
   SetIndexBuffer(4,BufferSellEntry);
   SetIndexStyle(4,DRAW_ARROW);
   SetIndexDrawBegin(4,BobaPeriod);
   SetIndexArrow(4, 238);
   SetIndexEmptyValue(4, 0);

   SetIndexBuffer(5,BufferBuyEntry);
   SetIndexStyle(5,DRAW_ARROW);
   SetIndexDrawBegin(5,BobaPeriod);
   SetIndexArrow(5, 236);
   SetIndexEmptyValue(5, 0);


   //---- name for DataWindow and indicator subwindow label
   // IndicatorShortName("GimmeBar ");

   //---- initialization done
   return(0);
}


//+------------------------------------------------------------------+
//| Custom indicator iteration function                              |
//+------------------------------------------------------------------+
int start()
{
   int counted_bars= IndicatorCounted(),
         lastbar;

   if (counted_bars>0)
      counted_bars--;

   lastbar= Bars - counted_bars;

   GimmeeBar(0, lastbar, BufferSell, BufferBuy, BufferSellEntry, BufferBuyEntry, BufferBand1, BufferBand2, BobaPeriod, BobaDeviations);

   return (0);
}


//+------------------------------------------------------------------+
//| Mark Gimmee-Bars and mark possible entries for deals              |
//+------------------------------------------------------------------+
double GimmeeBar(int offset, int lastbar, double &sellbuf[], double &buybuf[], double &sellbuf2[], double &buybuf2[],
                  double &band1buf[], double&band2buf[], int period, int deviation)
{
   double band1, band2;
   int markerdist= 5;   // distance between bars and marker dots

   lastbar= MathMin(Bars-period, lastbar);

   //---- main loop
   for(int i= lastbar; i>=offset; i--){

      sellbuf[i]= 0;
      buybuf[i]=0;
      sellbuf2[i]= 0;
      buybuf2[i]=0;

      band1= iBands(NULL,0, period, deviation, 0, PRICE_CLOSE, MODE_UPPER, i);
      band2= iBands(NULL,0, period, deviation, 0, PRICE_CLOSE, MODE_LOWER, i);

      band1buf[i]= band1;
      band2buf[i]= band2;


      // 1. Prices were rising.
      // 2. Prices touched the upper band.
      // 3. The price bar closed lower than it
      // opened when prices were previously rising.
      // or vice versa

      if (High[i]>=band1)  {
         sellbuf[i]= High[i] + markerdist*Point;
         if (i < 2 )

	{
	   UD="m Down";
		DoAlert(UD);
	}
      }


      if (Low[i]<=band2)  {
         buybuf[i]= Low[i] - markerdist*Point;
         if (i < 2 )

	{
	   UD="m Up.";
		DoAlert(UD);
	}

      }


      // Should such a price bar occur, a sell short order is to be executed
      // one tick below the low of the Gimmee bar.

     // if (sellbuf[i+1]!=0 && Low[i]<Low[i+1]-1*Point) {
      //   sellbuf2[i]= Low[i+1]-1*Point;
     // }

     // if (buybuf[i+1]!=0 && High[i]>High[i+1]+1*Point) {
     //    buybuf2[i]= High[i+1]+1*Point;
     // }

   }

   /*
   if (DebugLogger)
      Print(TimeOffset(offset), "BG-GimmeBar ", "");
   */

   return (0);
}

//+------------------------------------------------------------------+
void DoAlert(string UD)
{
   if (!NewBar() || !Use_Sound)
      return;
     if(Alert_ON==true)Alert("Alert ! Line Touched "+Symbol()+" M"+Period()+" @ "+DoubleToStr(Bid,Digits)+"");
     PlaySound ("Alert2");
}


  bool NewBar()
{
   static datetime dt  = 0;
   if (dt != Time[0])
   {
      dt = Time[0];
      return(true);
   }
}
Comments