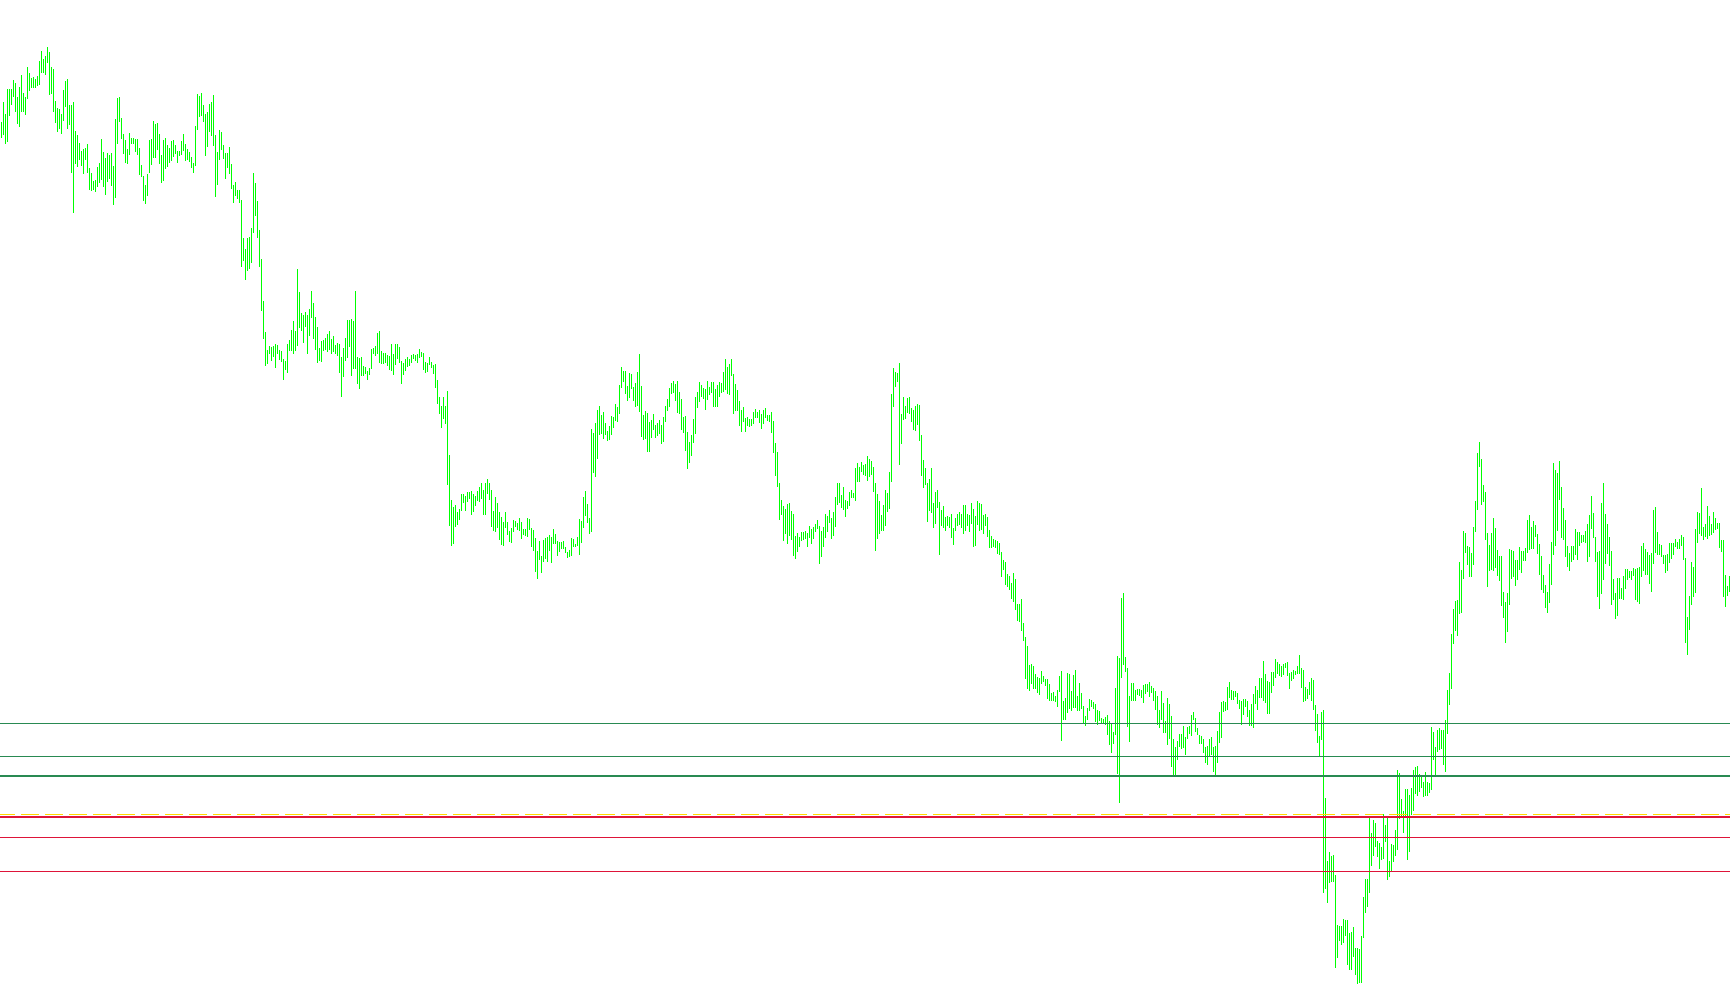
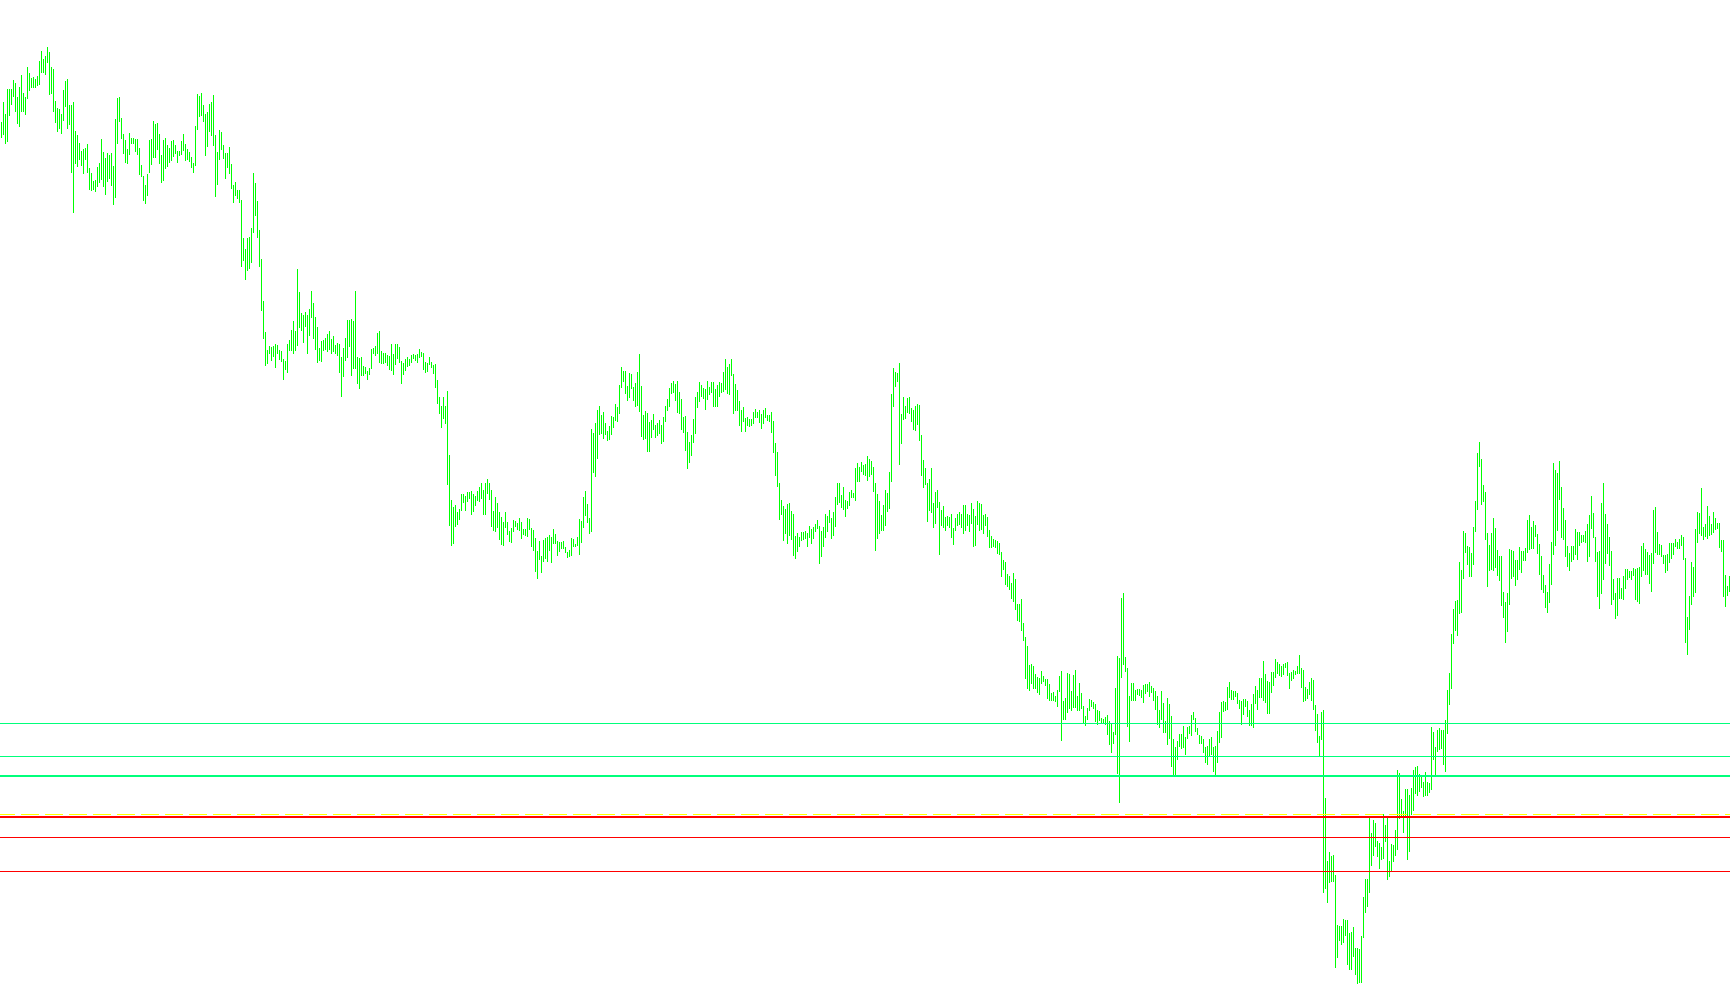
BW-wiseMan-1 Alert
Indicator

BW-wiseMan-1 Alert

iAlligator

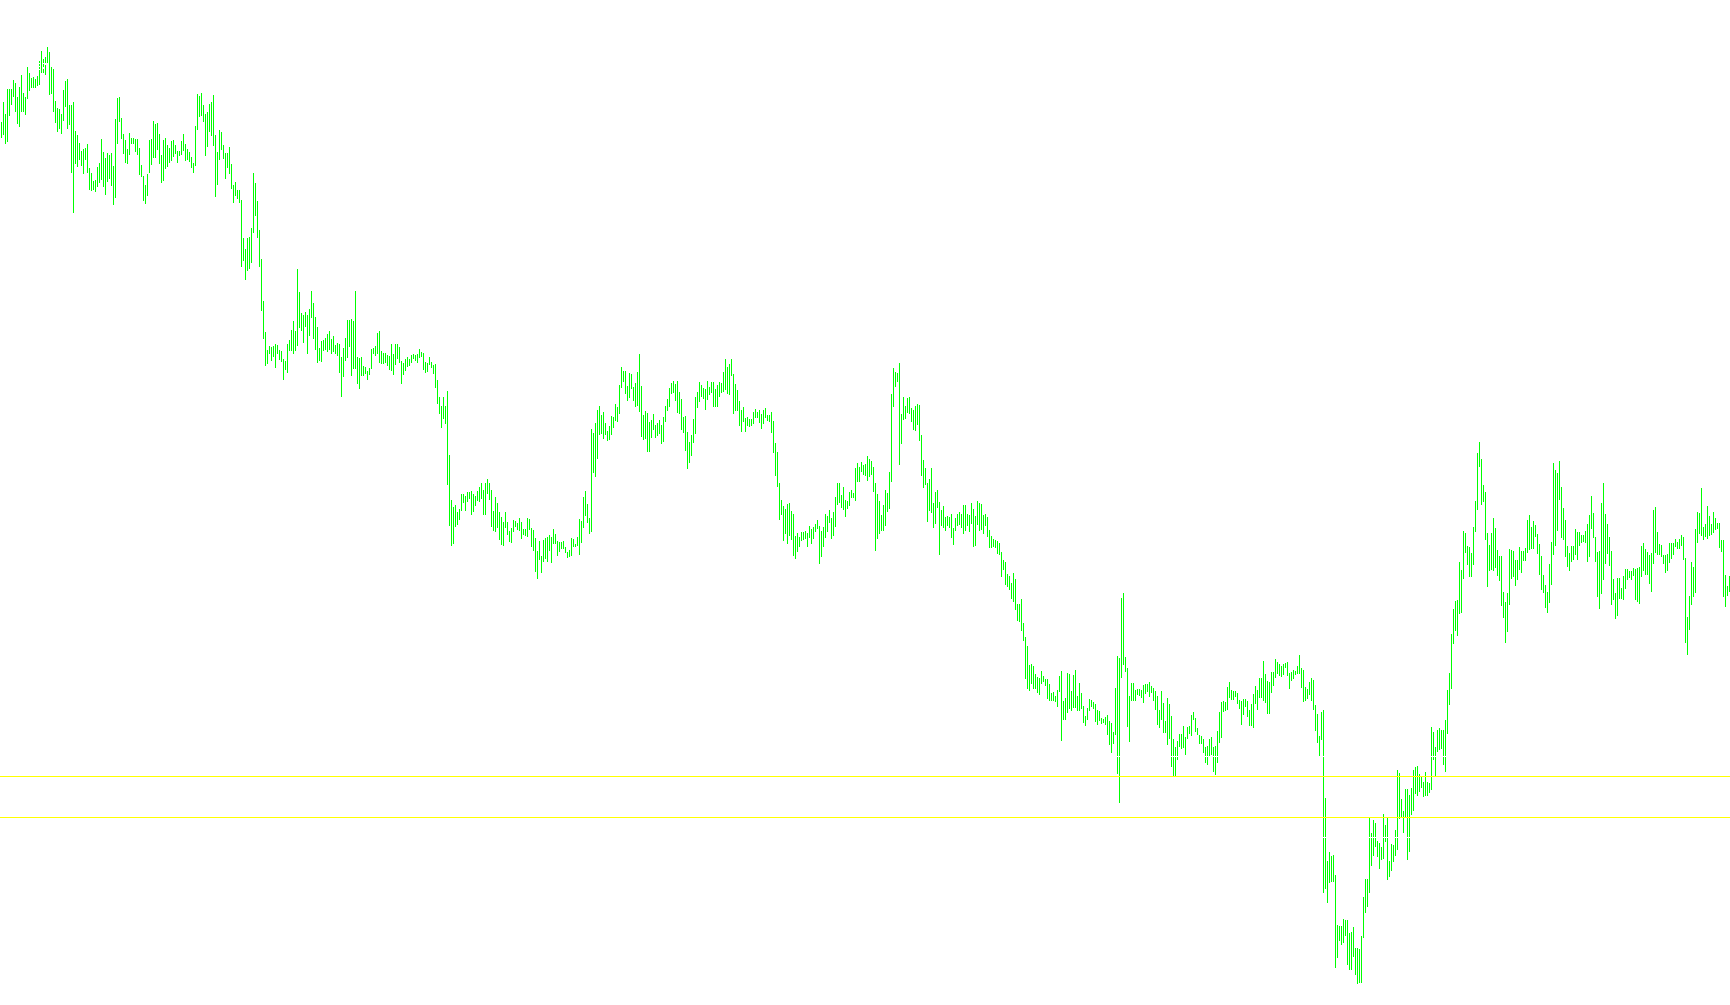
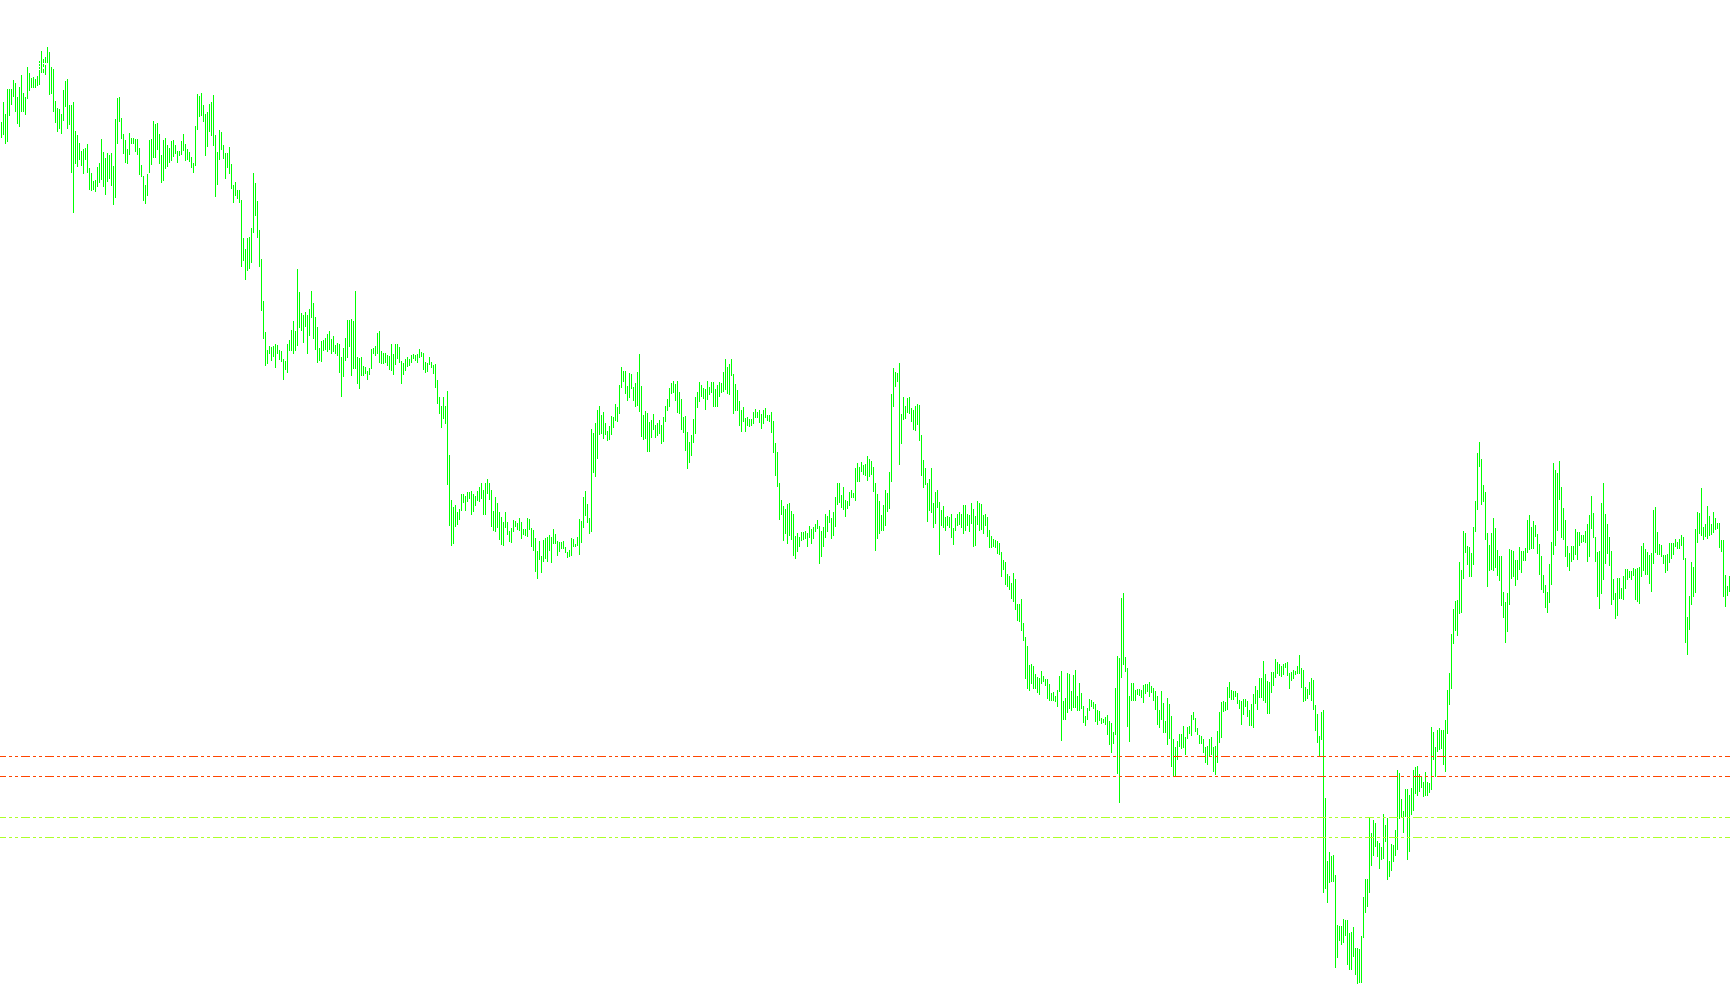
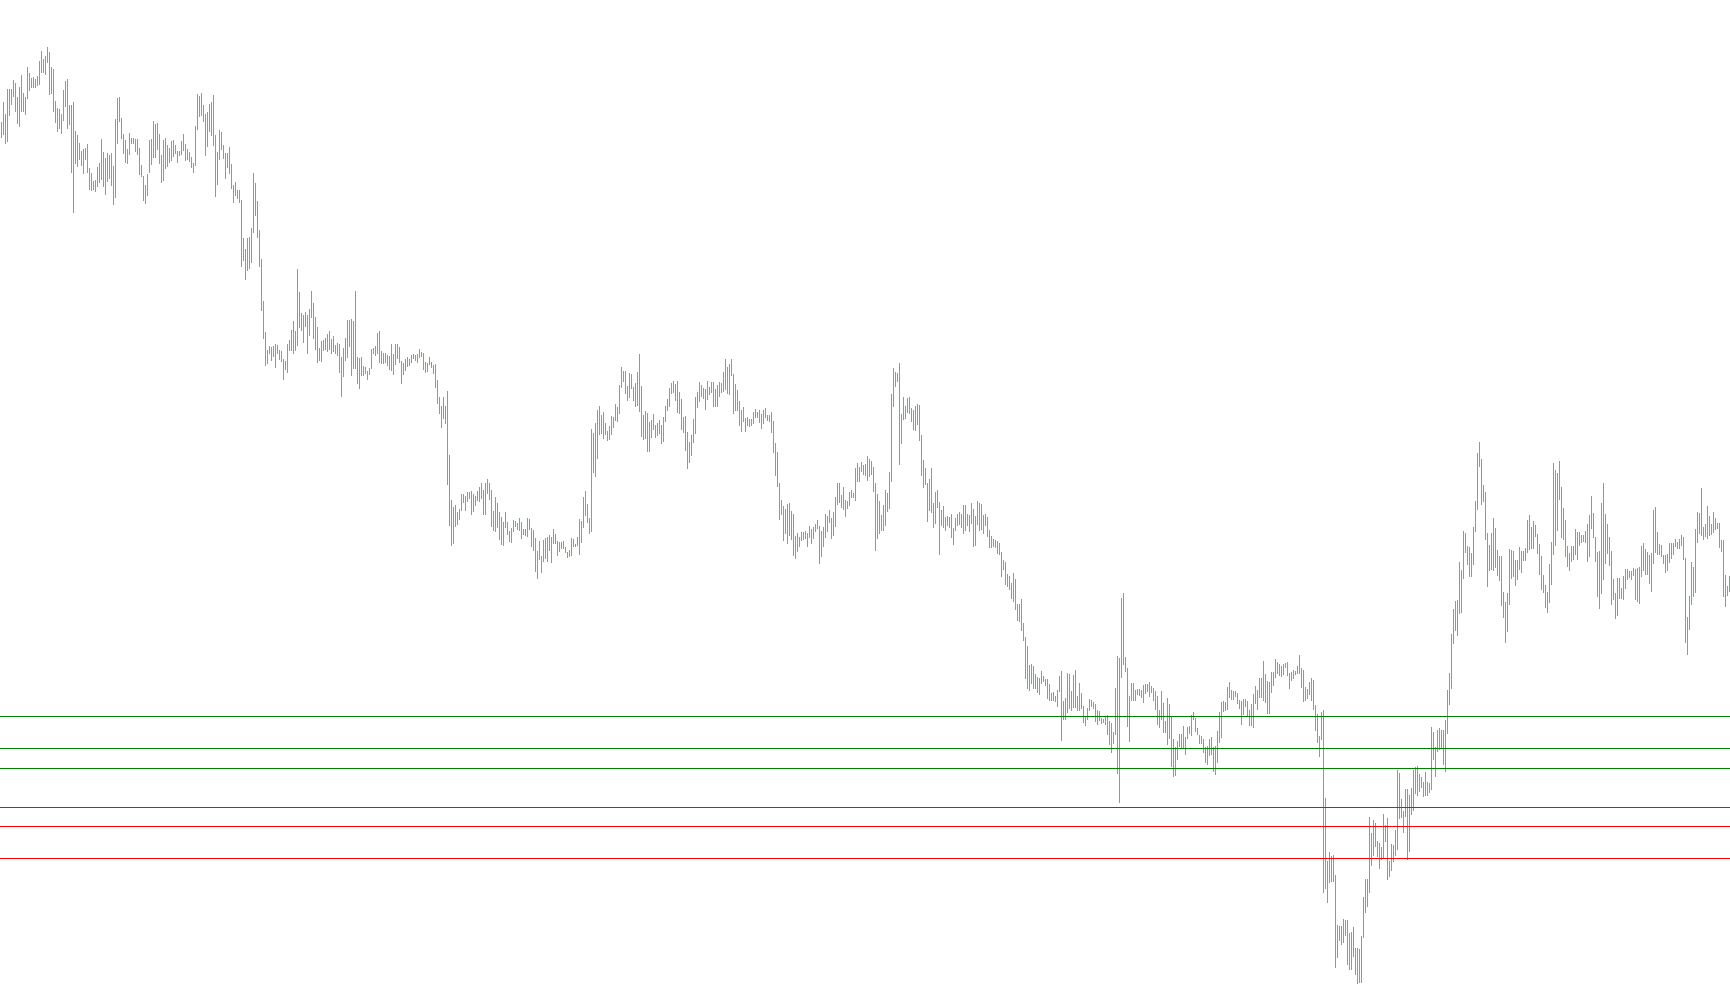
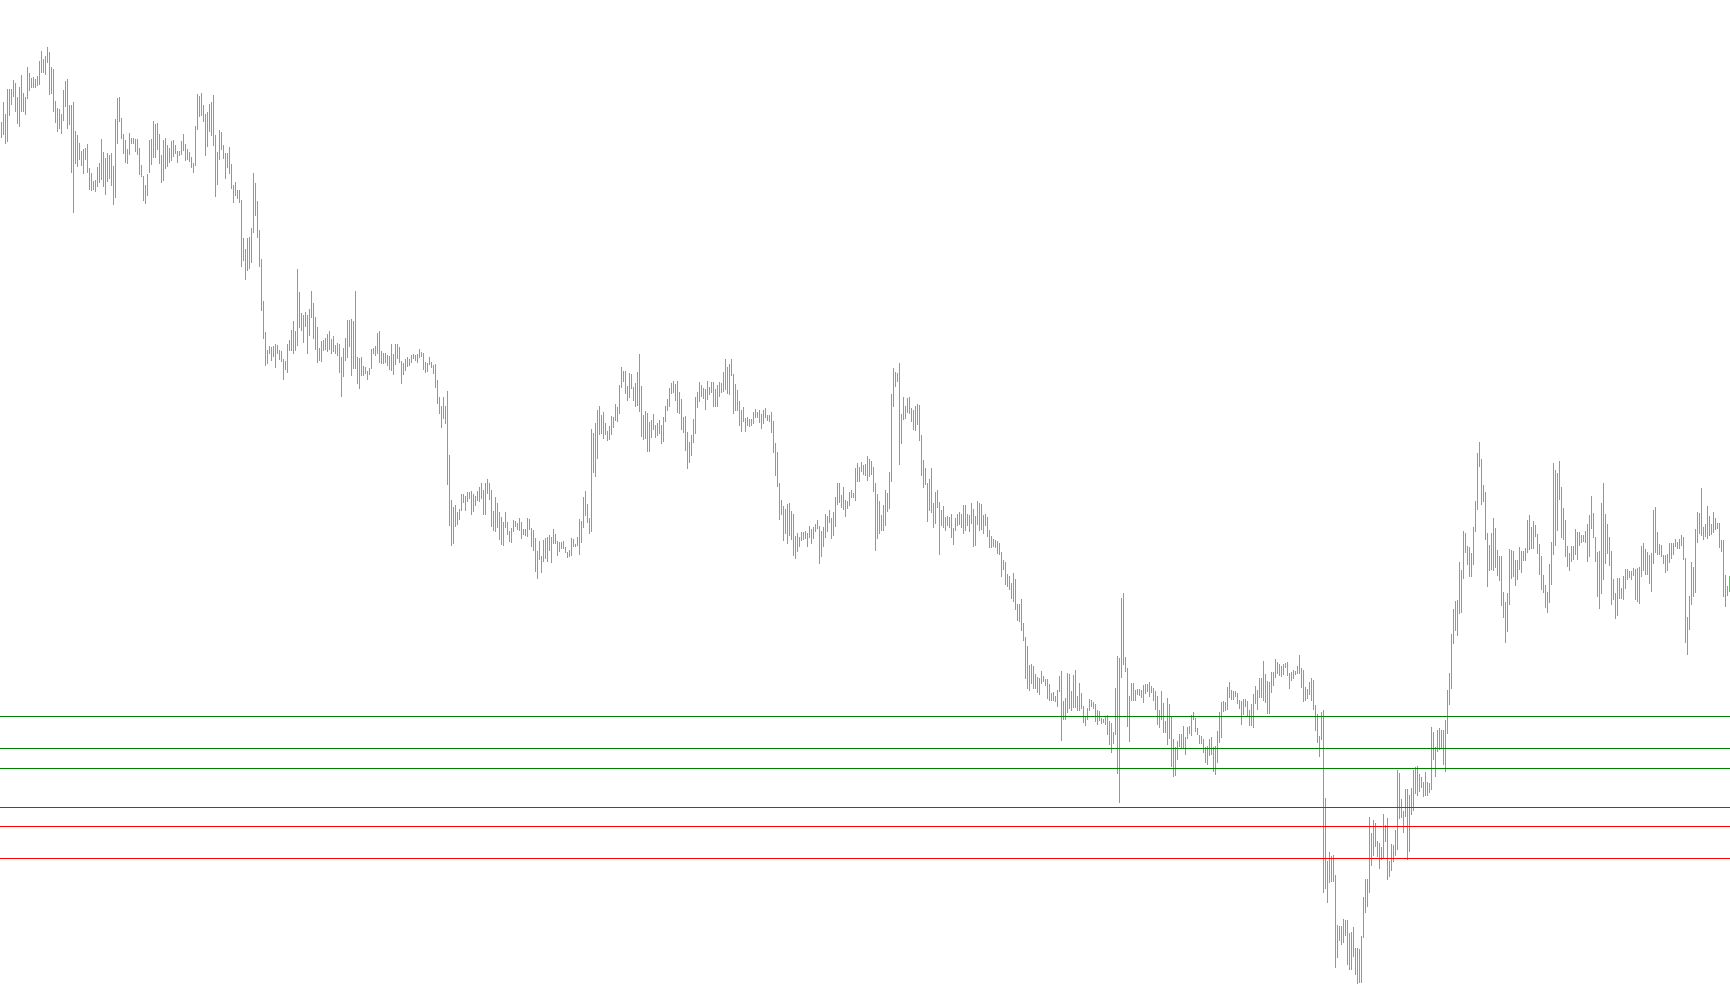
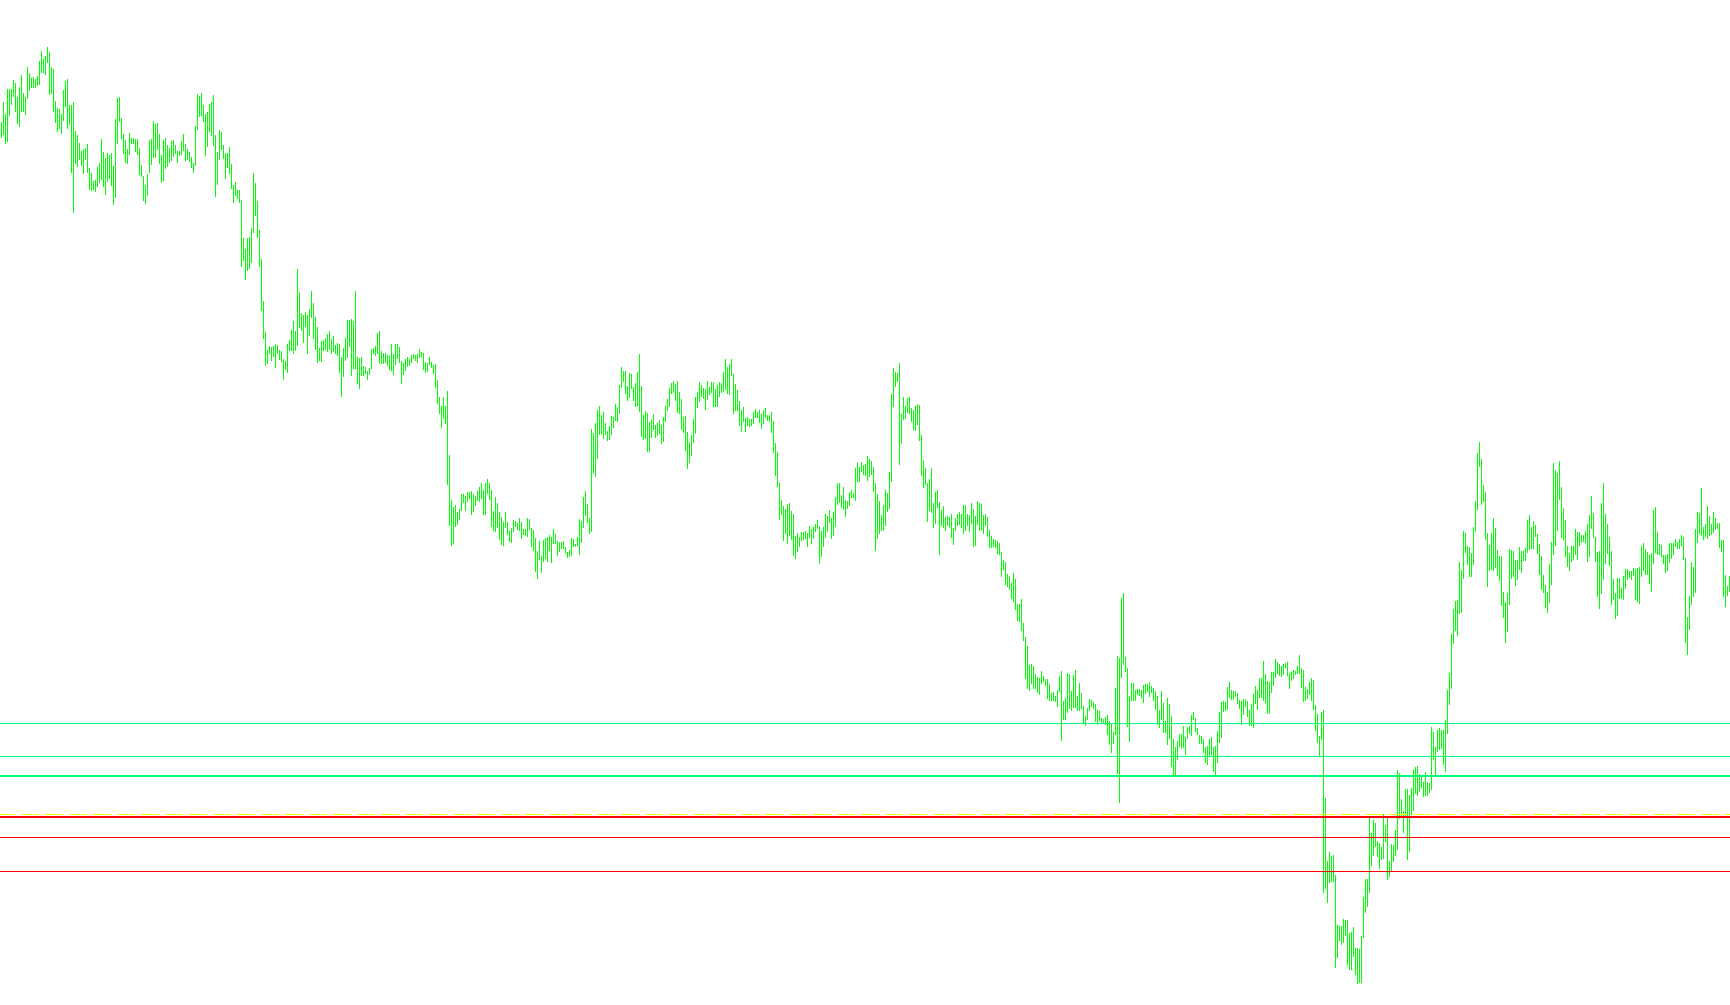
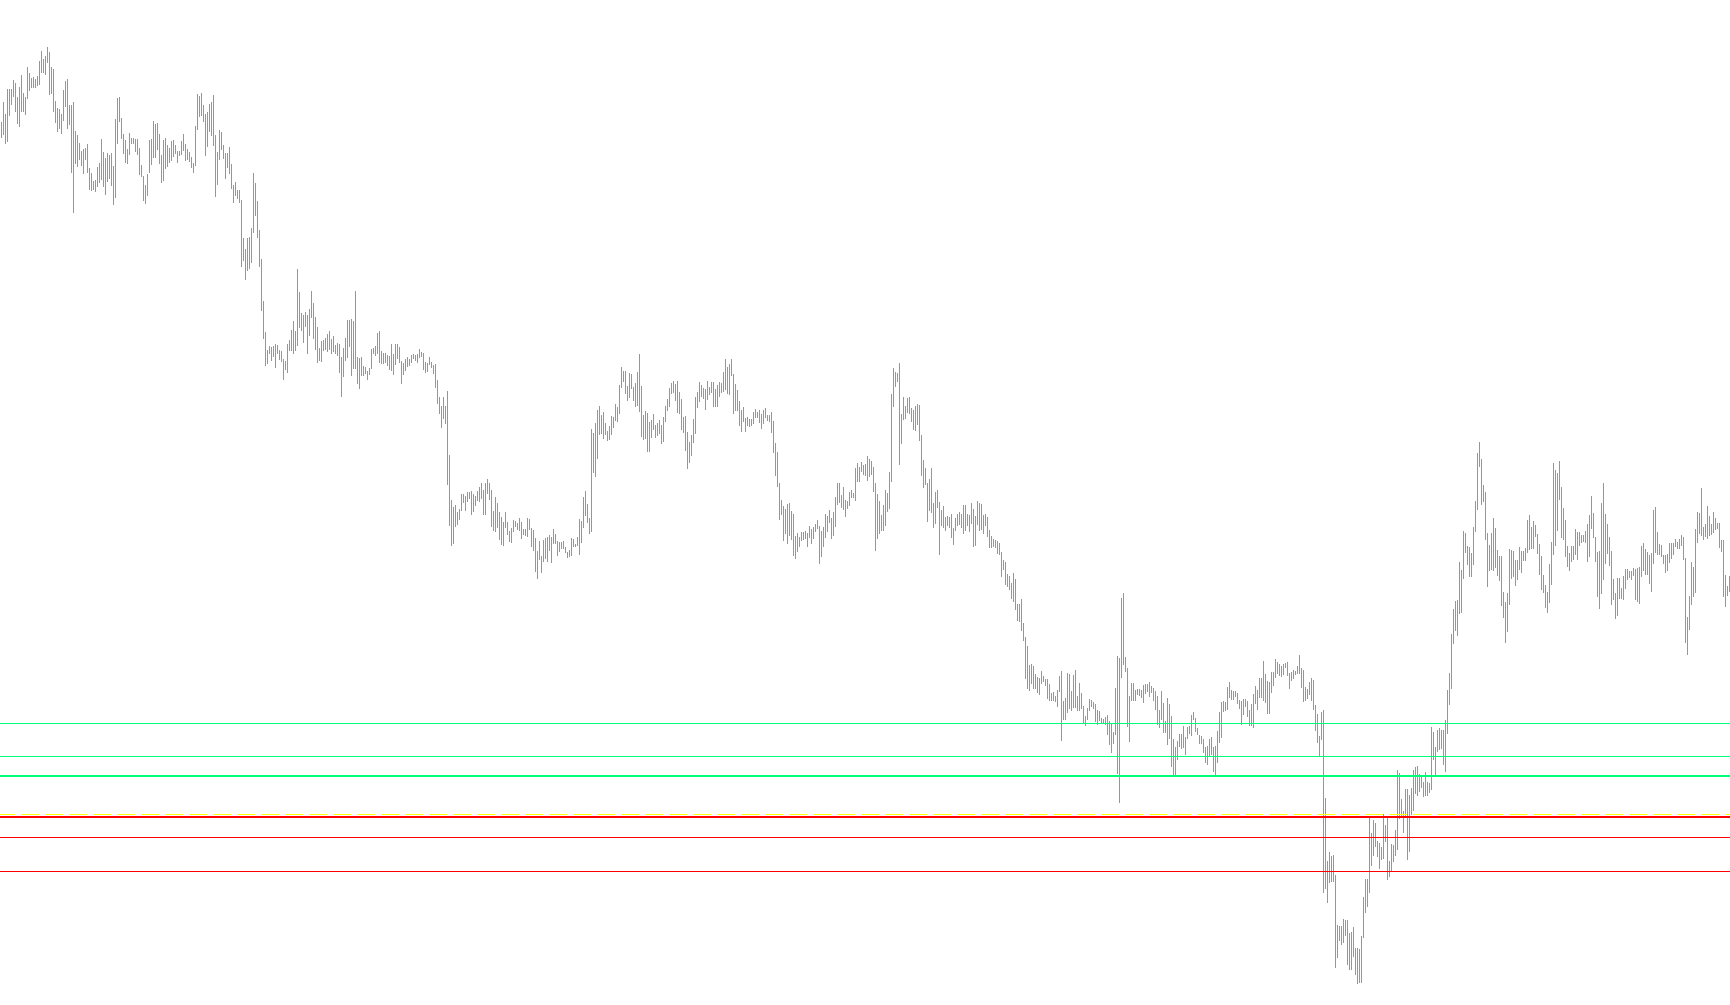
Identifies trend reversal signals by detecting price breaches of all three Alligator lines combined with specific candle body positions and local high/low structural peaks.
BW-wiseMan-1 Alert_001
Indicator

BW-wiseMan-1 Alert_001

iAlligator

This indicator identifies bullish and bearish reversal points by detecting price action breaks relative to the Alligator Moving Average components combined with specific candlestick midpoint orientation and historical high/low peak validation.

BW-wiseMan-1
Indicator

BW-wiseMan-1

iAlligator

Identifies bullish and bearish reversal points by filtering price action extremes against the concurrent positions of all three Alligator moving averages while confirming structural trend momentum.

BW-Zone
Indicator

BW-Zone

iACiAO

This indicator identifies trend shifts by monitoring synchronized directional movements between the Awesome Oscillator and the MACD histogram.

BW_MFI+Volumes
Indicator

BW_MFI+Volumes

This indicator categorizes market momentum by correlating price range expansion against trading volume to distinguish between aggressive, weak, and deceptive flow types.

BW_MFI
Indicator

BW_MFI

This indicator quantifies market activity by normalizing price range against trading volume to categorize trend persistence, exhaustion, and acceleration.

BykovTrend_Sig
Indicator

BykovTrend_Sig

iWPR
BykovTrend_Sig_byRENAAT_Alert
Indicator

BykovTrend_Sig_byRENAAT_Alert

iWPR
BykovTrend_Sig_v1
Indicator

BykovTrend_Sig_v1

iWPR
BykovTrend_Sig_v2
Indicator

BykovTrend_Sig_v2

iWPR
BykovTrend_Sig_v4
Indicator

BykovTrend_Sig_v4

iWPR
BZ_everyhour
Indicator

BZ_everyhour

This indicator dynamically plots the hourly opening price and constructs symmetrical buy and sell zones based on user-defined straddle widths and channel offsets.

B_WImp-T01
Indicator

B_WImp-T01

This indicator quantifies price momentum by aggregating the sum of bullish and bearish price movements over a rolling window, then smoothing the result through a triple-exponential moving average.

Indicator

calc

calculateLots
Indicator

calculateLots

This script iterates through the account history to compute the cumulative sum of traded lots within a user-defined temporal range.

Calculation_the_future_day
Indicator

Calculation_the_future_day

This indicator calculates high-probability support and resistance levels using the Weintraub Daytrader methodology, projecting extreme price targets based on previous daily volatility and average price components.

Calculator_Forex
Indicator

Calculator_Forex

This script calculates the optimal lot size based on a fixed stop-loss distance and percentage risk, or determines the maximum allowable stop-loss points for a specific lot volume across various currency pair types.

Indicator

calc_v1

Indicator

Camarilla Forex System-Daily

Camarilla Forex System-Daily1
Indicator

Camarilla Forex System-Daily1

This expert advisor calculates and plots daily Camarilla pivot levels by deriving specific price boundaries from the previous candle's range and closing price.

Indicator

camarilla(2)

Camarilla-MT04-Ind_MBB
Indicator

Camarilla-MT04-Ind_MBB

This indicator projects dynamic support and resistance boundaries by calculating specific 1.1 volatility multipliers based on the previous day's price range and closing value.

Camarilla-MT04-Ind_MBB_v1
Indicator

Camarilla-MT04-Ind_MBB_v1

This indicator calculates specific resistance and support price boundaries based on the previous day's volatility and closing range to identify potential reversal zones.

Camarilla-MT04-Ind_MBB_v2
Indicator

Camarilla-MT04-Ind_MBB_v2

Calculates and plots dynamic range expansion levels based on the previous day's high, low, and closing price to identify potential breakout boundaries.

Indicator

Camarilla

camarilladt1
Indicator

camarilladt1

This indicator dynamically plots Camarilla Breakout levels, standard Pivot Points, and Midpoint levels based on historical daily high, low, and close price data.

camarilladt1_v1
Indicator

camarilladt1_v1

This indicator projects daily price boundaries by synthesizing standard Pivot Points, Camarilla breakout levels, and sequential midpoint anchors onto a single visual interface.

camarilladt1_v2
Indicator

camarilladt1_v2

This indicator dynamically projects historical price boundaries and floor-level support/resistance zones using Camarilla range calculations and fractional midpoint subdivisions.

camarilladt4
Indicator

camarilladt4

This indicator maps Camarilla breakout levels and Fibonacci retracement zones using daily OHLC data to identify potential reversal points and trend targets.

camarilladt5
Indicator

camarilladt5

A comprehensive technical analysis tool that projects Camarilla breakout levels, standard pivots, Fibonacci retracements, and mid-range boundaries based on historical price volatility.

camarilladt5_v1
Indicator

camarilladt5_v1

This indicator synthesizes Camarilla breakout levels, Fibonacci retracements, and standard pivot points to identify high-probability support and resistance zones based on historical price ranges.

camarilladt7
Indicator

camarilladt7

This indicator projects multi-dimensional price levels by synthesizing Camarilla breakout targets, standard and mid-range pivots, and Fibonacci retracement ratios based on historical daily ranges.

camarilladt7v1
Indicator

camarilladt7v1

This indicator projects dynamic support and resistance levels by synthesizing standard pivot points, customized Camarilla breakout targets, and extensive Fibonacci retracement levels based on previous daily price action.

camarilladt7v11
Indicator

camarilladt7v11

This indicator synthesizes daily range analytics to project Fibonacci retracements, Standard Pivots, and Camarilla breakout levels with real-time proximity alerts.

camarilladt7v11_v1
Indicator

camarilladt7v11_v1

This indicator projects Camarilla breakout levels, standard Fibonacci retracements, and multiple pivot point systems to identify high-probability reversal zones and liquidity targets based on previous daily price action.

camarilladt7v1_v1
Indicator

camarilladt7v1_v1

This indicator visualizes dynamic Camarilla breakout levels, standard pivot points, and Fibonacci retracements based on previous daily price action.

camarilladt7v1_v2
Indicator

camarilladt7v1_v2

This indicator synthesizes Camarilla breakout levels, standard pivot points, and extended Fibonacci retracement zones to provide a comprehensive map of potential liquidity targets and price reversals.

camarilladt8
Indicator

camarilladt8

This indicator calculates and plots Camarilla breakout levels, Fibonacci retracements, and standard pivot points simultaneously to identify high-probability reversal zones and liquidity targets.

camarilladt8_001
Indicator

camarilladt8_001

This indicator dynamically projects high-precision institutional trading levels by calculating and visualizing Camarilla, Fibonacci, Standard Pivot, and Mid-Point values based on historical OHLC data.

camarilladt8_v2
Indicator

camarilladt8_v2

This indicator visualizes dynamic price levels by synthesizing Camarilla Breakout, Standard Pivot, Fibonacci Retracement, and Midpoint calculations into a unified technical overhead.

camarilladtHistorical_V2
Indicator

camarilladtHistorical_V2

This indicator projects historical daily price levels by calculating and plotting multiple Camarilla pivot points based on previous session's highs, lows, and closing prices.

camarilladtHistorical_V4
Indicator

camarilladtHistorical_V4

This indicator calculates and plots daily historical price levels using the Camarilla open-high-low formula to identify significant support and resistance zones.

camarilladtHistorical_V4_v1
Indicator

camarilladtHistorical_V4_v1

This indicator projects historical Camarilla range boundaries and central pivot levels by calculating specific price percentages based on the previous day's high, low, and closing values.

camarilladtHistorical_V4_v2
Indicator

camarilladtHistorical_V4_v2

This indicator calculates and projects daily Camarilla pivot levels based on the previous day's high, low, and closing price to identify potential breakout zones.

camarillav9-1by_lu
Indicator

camarillav9-1by_lu

This indicator synthesizes Camarilla breakouts, Fibonacci retracements, Standard and Mid Pivots, and historical price levels into a single unified support and resistance visual framework.

Camarilla_AlertwFibs
Indicator

Camarilla_AlertwFibs

This indicator projects Camarilla liquidity levels, Fibonacci retracements, and daily pivot points alongside real-time breach alerts for breakout trading.

Camarilla_AlertwFibs_003
Indicator

Camarilla_AlertwFibs_003

This indicator dynamically maps Camarilla pivot levels, Fibonacci retracements, and standard pivots based on previous daily ranges to identify breakout targets and reversal zones.

Camarilla_AlertwFibs_v1
Indicator

Camarilla_AlertwFibs_v1

This indicator synthesizes Camarilla price levels, daily pivots, and Fibonacci retracements with real-time proximity alerts to identify breakout targets and reversal zones.

Camarilla_AlertwFibs_v3
Indicator

Camarilla_AlertwFibs_v3

This technical indicator synthesizes Camarilla breakout levels, Fibonacci retracement ratios, and daily pivot points to identify high-probability reversal zones and expansion targets.

Indicator

Camarilla_v1