Bollinger Squeeze v3
Download script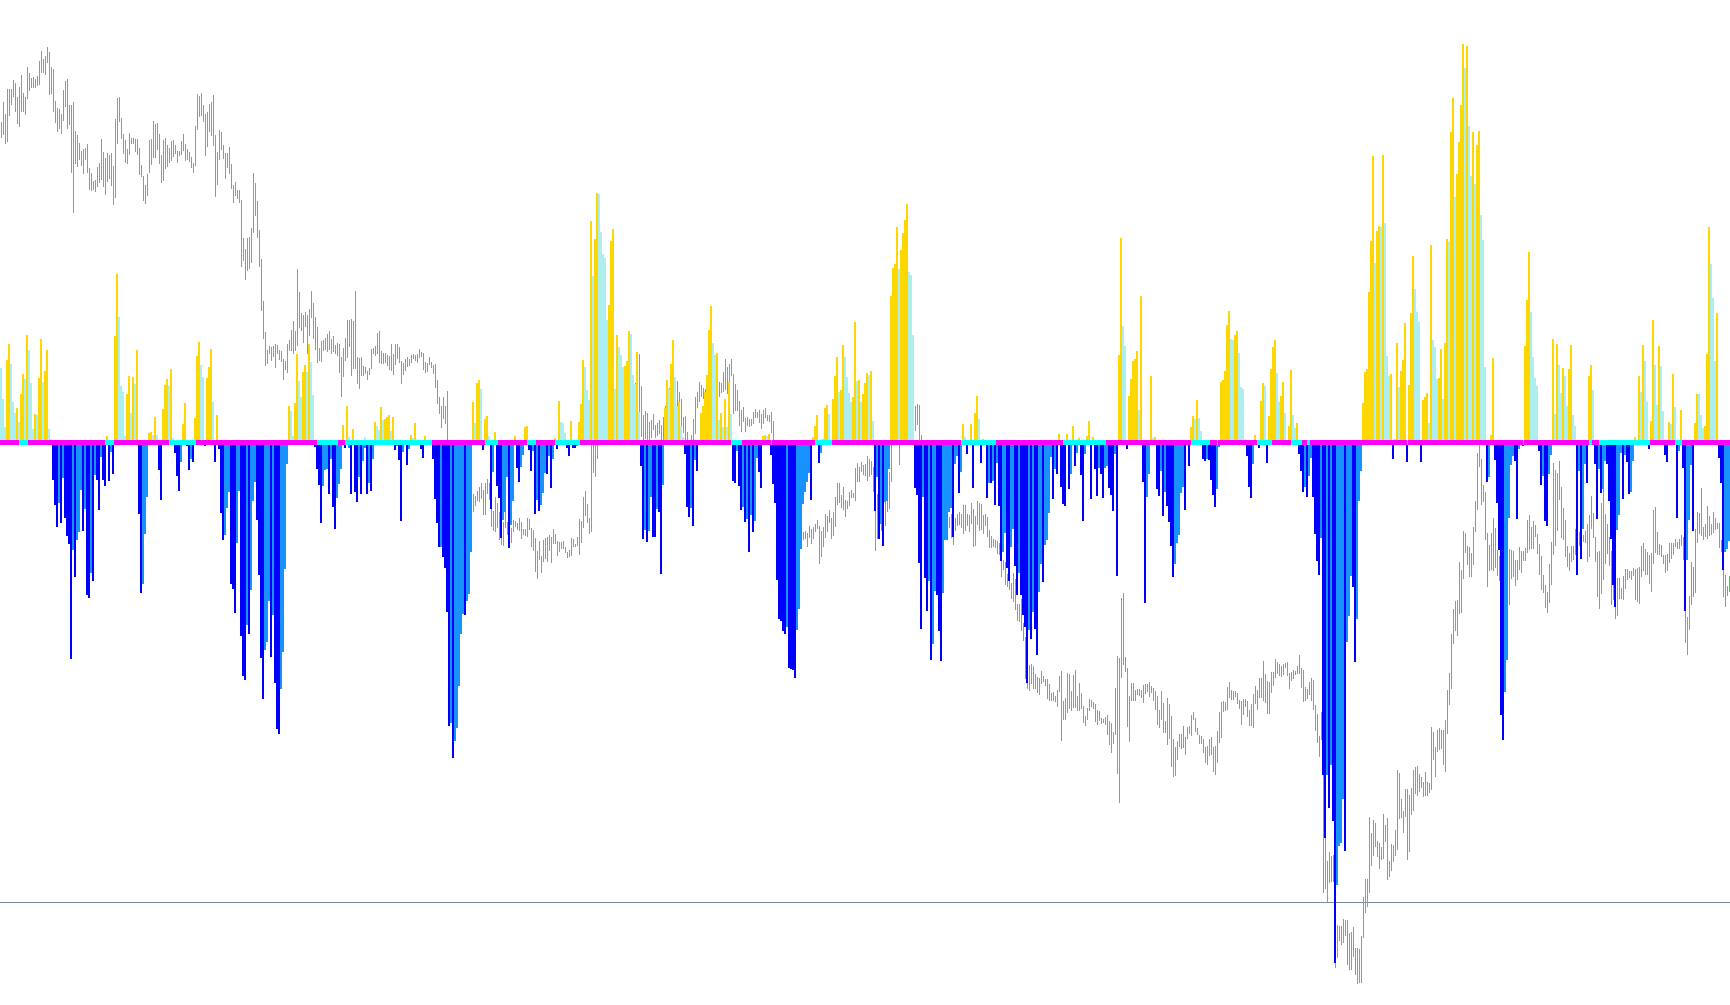
This script functions as a specialized technical analysis tool designed to identify specific market conditions, primarily focusing on detecting "squeezes" or periods of extreme volatility compression. It monitors the relationship between price momentum and relative market movement to provide visual signals to traders.
Core Logic and Functionality
The logic operates through three primary layers of data analysis:
1. Momentum Tracking The tool first calculates the "Momentum" of the asset—measuring how fast prices are moving in a specific direction over a set period. It classifies this momentum into bullish (upward) or bearish (downward) categories.
- Visual Representation: It uses a histogram to show the strength of these movements.
- Trend Identification: The script differentiates between "growing" and "receding" momentum. If the momentum is increasing, it highlights one color; if it begins to weaken or pull back, it switches to another. This allows users to see not just where the price is going, but whether that move is gaining or losing steam.
2. The Volatility Squeeze Calculation The most unique aspect of this script is its "Squeeze" logic. It compares two different types of volatility:
- Standard Deviation: This measures how much the price typically fluctuates from its average.
- Average True Range (ATR): This measures the actual distance between highs and lows over a recent period.
By dividing the Standard Deviation by the ATR, the tool calculates a ratio. When this ratio falls below a certain threshold (the "Squeeze" point), it indicates that the market is becoming unnaturally quiet or compressed. In trading terms, these "squeezes" often precede a large, explosive move in either direction.
3. Alert System The script is designed to notify the user when this compression occurs. If the market enters a "Squeeze" state, the tool can trigger:
- Visual Alerts: On-screen notifications or messages.
- Audio Alerts: Sound files to grab the trader's attention immediately.
Summary of Visual Cues
- Histograms: Provide a continuous look at current momentum and whether that momentum is expanding or contracting.
- Arrows/Signals: These act as the primary indicators for the "Squeeze." When the conditions for a volatility compression are met, these signals appear to warn the user that a significant price breakout may be imminent.
Essentially, this tool serves as an early warning system, helping traders identify periods of low-activity "coiling" before the market potentially breaks out into a high-activity trend.
//+------------------------------------------------------------------+
//|                                                    bbsqueeze.mq4 |
//|                Copyright © 2005, Nick Bilak, beluck[AT]gmail.com |
//+------------------------------------------------------------------+
#property copyright "Copyright © 2005, Nick Bilak"
#property link      "http://metatrader.50webs.com/"

#property indicator_separate_window
#property indicator_buffers 6
#property indicator_color1 LimeGreen
#property indicator_color2 IndianRed
#property indicator_color3 LightGreen
#property indicator_color4 LightPink
#property indicator_color5 Blue
#property indicator_color6 Red

//---- input parameters
extern int       totalBars=3000;
extern int       bolPrd=20;
extern double    bolDev=2.0;
extern int       keltPrd=20;
extern double    keltFactor=1.5;
extern int       momPrd=12;
extern bool    alertBox=false;
extern bool    audioAlert=false;

//---- buffers
double upB[];
double loB[];
double upK[];
double loK[];
double upB2[];
double loB2[];

int i,j,slippage=3;
double breakpoint=0.0;
double ema=0.0;
int peakf=0;
int peaks=0;
int valleyf=0;
int valleys=0, limit=0;
double ccis[61],ccif[61];
double delta=0;
double ugol=0;
//+------------------------------------------------------------------+
//| Custom indicator initialization function                         |
//+------------------------------------------------------------------+
int init()
  {
//---- indicators
   SetIndexStyle(0,DRAW_HISTOGRAM,0,2);
   SetIndexBuffer(0,upB);
   SetIndexEmptyValue(0,0);

   SetIndexStyle(1,DRAW_HISTOGRAM,0,2);
   SetIndexBuffer(1,loB);
   SetIndexEmptyValue(1,0);

   SetIndexStyle(4,DRAW_ARROW);
   SetIndexBuffer(4,upK);
   SetIndexEmptyValue(42,0);
   SetIndexArrow(4,167);

   SetIndexStyle(5,DRAW_ARROW);
   SetIndexBuffer(5,loK);
   SetIndexEmptyValue(5,EMPTY_VALUE);
   SetIndexArrow(5,167);

   SetIndexStyle(2,DRAW_HISTOGRAM,0,2);
   SetIndexBuffer(2,upB2);
   SetIndexEmptyValue(2,0);

   SetIndexStyle(3,DRAW_HISTOGRAM,0,2);
   SetIndexBuffer(3,loB2);
   SetIndexEmptyValue(3,0);
//----
   return(0);
  }


int start() {
   int counted_bars=IndicatorCounted();
   int shift,limit;
   double diff,d[],std,bbs;

  /* if (counted_bars<0) return(-1);
   if (counted_bars>0) counted_bars--;
   limit=Bars-31;
   if(counted_bars>=31) limit=Bars-counted_bars-1;*/

   if (counted_bars<0) return(-1);
   limit=totalBars; //Bars-31;

   ArrayResize(d,limit);

   for (shift=limit;shift>=0;shift--)   {

      /*upB[shift]=0;
      upB2[shift]=0;
      loB[shift]=0;
      loB2[shift]=0;*/

      d[shift]=iMomentum(NULL,0,momPrd,PRICE_CLOSE,shift)-100; // - iMomentum(NULL,0,momPrd,PRICE_CLOSE,shift+1));
      //d[shift]=LinearRegressionValue(momPrd,shift);
      //d[shift]=0;//FindDirection(shift);

      if(d[shift]>0) {
         if (d[shift] >= d[shift+1]) {
            upB[shift]=d[shift];
            upB2[shift]=0;
         } else {
            upB2[shift]=d[shift];
            upB[shift]=0;
         }

         loB[shift]=0;
         loB2[shift]=0;
      } else if (d[shift] < 0) {

         if (d[shift] <= d[shift+1]) {
            loB[shift]=d[shift];
            loB2[shift]=0;
         } else {
            loB2[shift]=d[shift];
            loB[shift]=0;
         }
         upB[shift]=0;
         upB2[shift]=0;
      } else {
         upB[shift]=0.01;
         upB2[shift]=0.01;
         loB[shift]=-0.01;
         loB2[shift]=-0.01;
      }

		diff = iATR(NULL,0,keltPrd,shift)*keltFactor;
		std = iStdDev(NULL,0,bolPrd,MODE_SMA,0,PRICE_CLOSE,shift);
		bbs = bolDev * std / diff;

      if(bbs<1) {
         upK[shift]=0;
         loK[shift]=EMPTY_VALUE;

         if (alertBox == true && shift == 0) Alert("Warning for ", Symbol(), " on ", Period(), " chart!");
         if (audioAlert == true && shift == 0) PlaySound("alert.wav");

      } else {
         loK[shift]=0;
         upK[shift]=EMPTY_VALUE;
      }
   }
   return(0);
  }
//+------------------------------------------------------------------+

double FindDirection (int i) {

   int j;
   double val;
   double bulls, bears;

   for (j=i+8; j>i; j--) {

      bulls += High[j]-Close[j];
      bears += Close[j]-Low[j];

      if (bulls > bears) {
         val = 0.5;
      } else if (bears > bulls) {
         val = -0.5;
      }

      //sum += (Close[j] - Open[j]);
      //val = sum/j;

   }

   return (val);

}

double LinearRegressionValue(int Len,int shift) {
   double SumBars = 0;
   double SumSqrBars = 0;
   double SumY = 0;
   double Sum1 = 0;
   double Sum2 = 0;
   double Slope = 0;

   SumBars = Len * (Len-1) * 0.5;
   SumSqrBars = (Len - 1) * Len * (2 * Len - 1)/6;

  for (int x=0; x<=Len-1;x++) {
   double HH = Low[x+shift];
   double LL = High[x+shift];
   for (int y=x; y<=(x+Len)-1; y++) {
     HH = MathMax(HH, High[y+shift]);
     LL = MathMin(LL, Low[y+shift]);
   }
    Sum1 += x* (Close[x+shift]-((HH+LL)/2 + iMA(NULL,0,Len,0,MODE_EMA,PRICE_CLOSE,x+shift))/2);
    SumY += (Close[x+shift]-((HH+LL)/2 + iMA(NULL,0,Len,0,MODE_EMA,PRICE_CLOSE,x+shift))/2);
  }
  Sum2 = SumBars * SumY;
  double Num1 = Len * Sum1 - Sum2;
  double Num2 = SumBars * SumBars-Len * SumSqrBars;

  if (Num2 != 0.0)  {
    Slope = Num1/Num2;
  } else {
    Slope = 0;
  }

  double Intercept = (SumY - Slope*SumBars) /Len;
  //debugPrintln(Intercept+" : "+Slope);
  double LinearRegValue = Intercept+Slope * (Len - 1);

  return (LinearRegValue);

}
Comments