Brother2
Indicator

Brother2

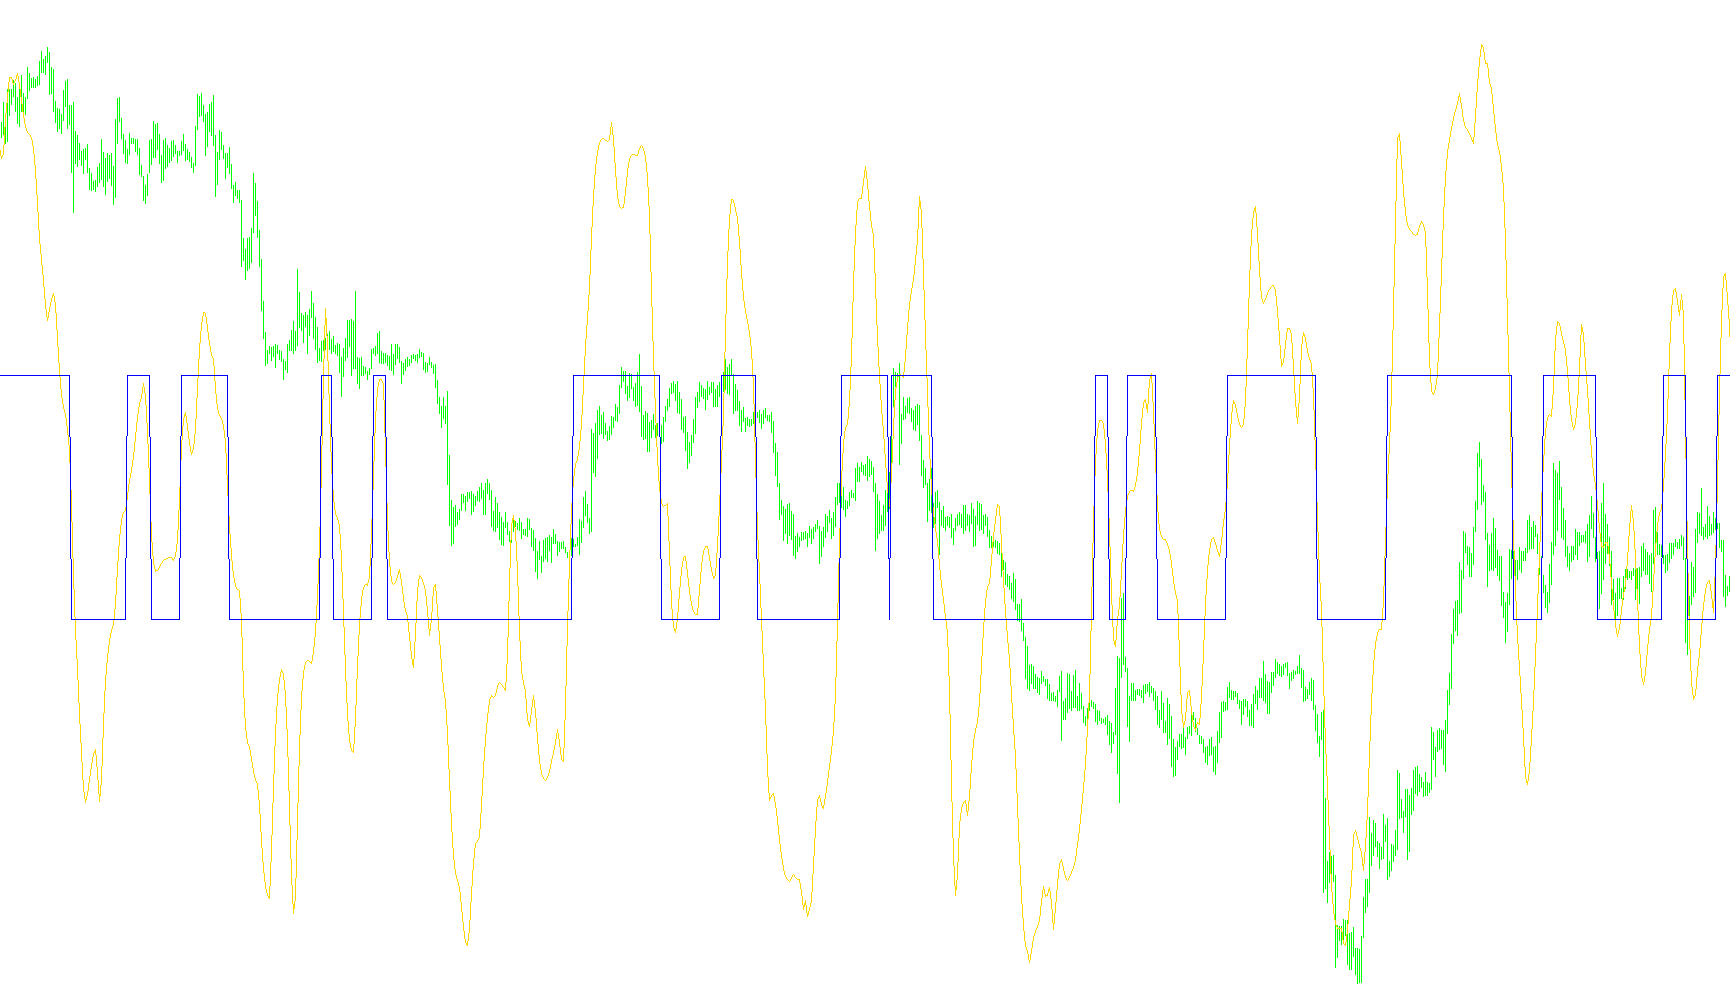
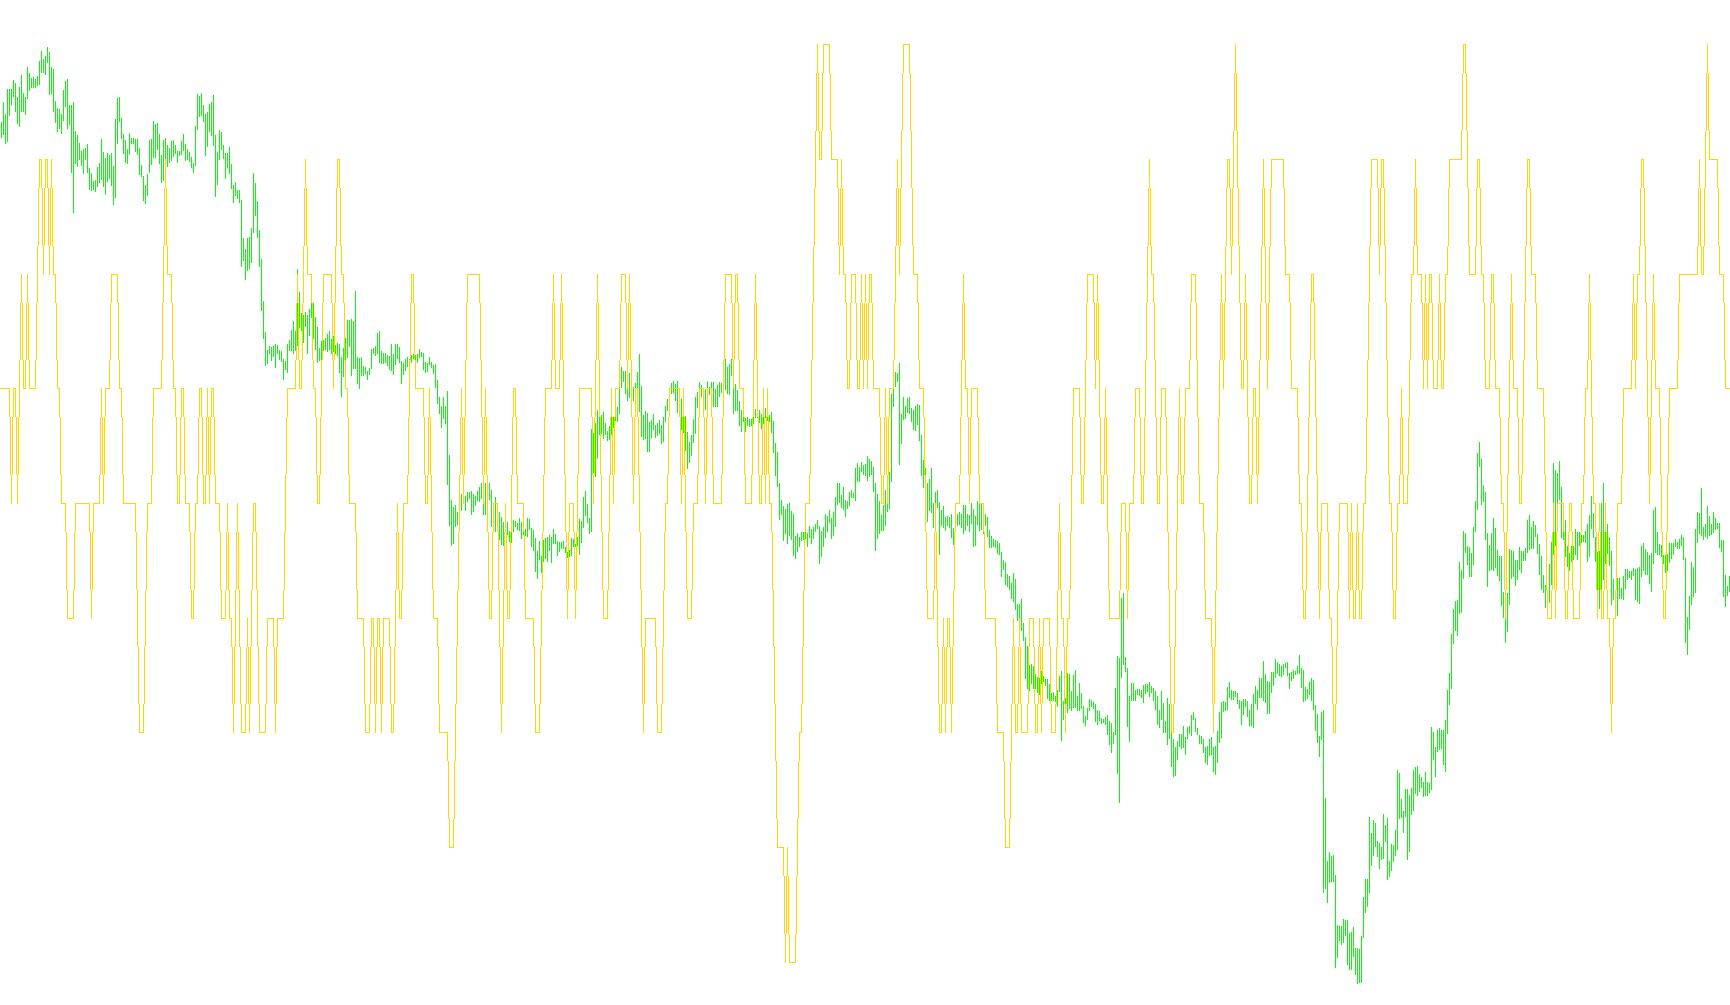
A comprehensive real-time analytics overlay that synchronizes multi-timezone market sessions, dynamic margin calculations, and automated lot-size optimization based on equity risk.

BSI
Indicator

BSI

This indicator aggregates Relative Strength Index (RSX) values from three specific currency pairs to generate synchronized buy and sell signals based on collective momentum thresholds.

BSI1
Indicator

BSI1

This indicator synthesizes momentum signals from three specific currency pairs to identify high-probability confluence entries based on divergent threshold breaches.

BS_#MarketPrice
Indicator

BS_#MarketPrice

iMA

This indicator provides a real-time visual dashboard aggregating multi-timeframe trend dynamics, daily volatility averages, and live spread metrics to offer an immediate snapshot of market sentiment.
BS_RSI
Indicator

BS_RSI

iRSI

This indicator segments Relative Strength Index values into distinct visual zones based on a 50-level equilibrium threshold to identify immediate bullish or bearish bias.

BS__MarketPrice
Indicator

BS__MarketPrice

iMA

A comprehensive visual dashboard that synchronizes real-time price action, multi-timeframe moving average trends, daily volatility averages, and spread dynamics into a single unified display.

BT1
Indicator

BT1

iWPR
BT1_v1
Indicator

BT1_v1

iWPR
BT1_v2
Indicator

BT1_v2

iWPR
BT2Sig
Indicator

BT2Sig

This indicator identifies trend reversals by detecting state transitions in the BrainTrend2Stop sub-system to pinpoint structural price shifts.

BT2Sig_v1
Indicator

BT2Sig_v1

This indicator identifies trend reversals by detecting state transitions in external BrainTrend2Stop data streams.

BT2Stop
Indicator

BT2Stop

This indicator identifies trend reversals by calculating a weighted volatility-based price threshold that shifts dynamically with market momentum.

BT2Stop_v1
Indicator

BT2Stop_v1

This indicator identifies trend reversals by calculating a weighted average true range to project price boundaries and flipping direction when candles breach the volatility-adjusted thresholds.

BT2Stop_v2
Indicator

BT2Stop_v2

This indicator identifies trend reversals by tracking price action extremes and projecting dynamic buffer zones based on a weighted average true range.

BTtrend Trigger
Indicator

BTtrend Trigger

This indicator calculates a momentum ratio between recent and historical price extremes, applying a multi-stage smoothing filter to identify structural shifts in buying and selling pressure.

BTtrend Trigger_v1
Indicator

BTtrend Trigger_v1

This indicator quantifies the relative strength between recent high-low ranges and historical price extremes to identify prevailing bullish or bearish dominance through multi-stage smoothing.

BtTrendSignal
Indicator

BtTrendSignal

This indicator identifies directional shifts by detecting breaches of relative price extremes and momentum thresholds across localized bar distributions.

BtTrendTrigger-T-S
Indicator

BtTrendTrigger-T-S

This indicator quantifies market bias by calculating the ratio between recent high-low extremes and historical ranges, applying a smoothed cubic polynomial filter to identify trend exhaustion and reversals.

BtTrendTrigger-T-Signal
Indicator

BtTrendTrigger-T-Signal

This indicator quantifies market sentiment by calculating the ratio of recent high-low range expansion against historical volatility, applying a multi-stage smoothing filter to identify reversal signals and momentum shifts.

BtTrendTrigger-T
Indicator

BtTrendTrigger-T

This indicator quantifies relative market strength by calculating the divergence between recent highs and historical lows against opposed extremes, applying a weighted smoothing filter to identify trend momentum.

BtTT-S
Indicator

BtTT-S

This indicator quantifies market momentum by calculating the ratio of recent price extremes against historical range boundaries to identify exhaustion points and directional shifts.

bullbreath
Indicator

bullbreath

This indicator quantifies market sentiment by calculating the frequency of positive price closures over a rolling ten-bar window to identify structural shifts.

Bulls Bears Power
Indicator

Bulls Bears Power

iMA

This indicator quantifies market imbalance by measuring the variance between the current price range and its long-term moving average mean.

Indicator

BULLS-BEARS-4XTRAFFIC

iBearsPoweriBullsPoweriMA
Indicator

BULLS-BEARS-4XTRAFFIC2

iBearsPoweriBullsPoweriMAiSAR
Indicator

BULLS-BEARS-4XTRAFFIC2_v1

iBearsPoweriBullsPoweriMAiSAR
Indicator

BULLS-BEARS-4XTRAFFIC2_v2

iBearsPoweriBullsPoweriMAiSAR
Indicator

BULLS-BEARS-4XTRAFFIC2_v3

iBearsPoweriBullsPoweriMAiSAR
Bulls
Indicator

Bulls

iMA

This indicator calculates the vertical distance between the current candle's high price and its corresponding Exponential Moving Average to quantify bullish expansion.

BullsBearsEyes(28AUG05)
Indicator

BullsBearsEyes(28AUG05)

iBearsPoweriBullsPower
BullsBearsEyes
Indicator

BullsBearsEyes

iBearsPoweriBullsPower
BullsBearsEyes_v1
Indicator

BullsBearsEyes_v1

iBearsPoweriBullsPower
BullsBears_ma_sigma
Indicator

BullsBears_ma_sigma

iMAiMAOnArray

This indicator quantifies market sentiment by calculating the differential between high and low exponential moving averages relative to a primary trend baseline.

Bulls_mod_rickW
Indicator

Bulls_mod_rickW

iMAiMAOnArray

The indicator quantifies price strength by calculating the absolute distance between the current high and a smoothed exponential moving average, then applies a secondary simple moving average to filter trend signals.

Bull_Bears_alerts_1a
Indicator

Bull_Bears_alerts_1a

iMA

The indicator calculates the sum of price deviations from a moving average to identify bullish and bearish momentum shifts via histogram peaks.

Bunnygirl Cross and Daily Open 10
Indicator

Bunnygirl Cross and Daily Open 10

iMA

This indicator identifies bullish and bearish trend shifts by detecting momentum crossovers between two moving averages, incorporating a price bounce threshold and specific session time filters.

Bunnygirl Cross and Daily Open 10_v1
Indicator

Bunnygirl Cross and Daily Open 10_v1

iMA

This indicator detects moving average crossovers and price bounces while integrating daily open levels and time-restricted volatility filters.

Bunnygirl Cross and Daily Open
Indicator

Bunnygirl Cross and Daily Open

iMA

This indicator identifies trend reversals and momentum shifts by detecting the crossover or 'bounce' of a short-term moving average against a long-term baseline, validated against daily open levels and specific temporal filters.

Bunnygirl Cross and Daily Open_v1
Indicator

Bunnygirl Cross and Daily Open_v1

iMA

This indicator identifies trend reversals by calculating the intersection of moving averages and specific price bounces, while simultaneously tracking daily opening prices to establish structural boundaries.

Bunnygirl Cross and Daily Open_v2
Indicator

Bunnygirl Cross and Daily Open_v2

iMA

This indicator identifies bullish and bearish trend shifts by detecting moving average crossovers and price bounces, applying specific time-based filters and dynamic buffer zones for trade entry signals.

Bunnygirl_Cross_and_Daily_Open_10
Indicator

Bunnygirl_Cross_and_Daily_Open_10

iMA

This indicator identifies trend reversals by detecting moving average crossovers and price bounces while filtering signals against the daily open and specific time windows.

Burger MACD
Indicator

Burger MACD

iMACD

This indicator captures higher timeframe momentum by mapping and projecting MACD main line fluctuations onto the current chart for trend synchronization.

Butterfly
Indicator

Butterfly

This indicator identifies significant structural swing points by recursively filtering local extrema through a depth-based lookback and consecutive peak suppression algorithm.

buy zone fibs
Indicator

buy zone fibs

iMA

This indicator projects parallel price bands based on varying Fibonacci multipliers relative to a dynamically calculated moving average of the high prices.

BuySellIndicators
Indicator

BuySellIndicators

iMACDiRVI

This indicator identifies high-probability entry points by detecting simultaneous bullish or bearish crossovers between the Relative Volatility Index (RVI) and Moving Average Convergence Divergence (MACD).

BuySell_Filter
Indicator

BuySell_Filter

iMA

This indicator categorizes market sentiment into four distinct states by evaluating the relative positioning of two short-term moving averages against two longer-term averages.

BuySell_v2
Indicator

BuySell_v2

iMA

This indicator maps the relative positioning of three Simple Moving Averages to visualize trend strength and directional bias through a four-state histogram.

Indicator

Buy_nonQuery

buy_sell
Indicator

buy_sell

iATRiMA

The indicator identifies trend direction by comparing consecutive moving average shifts and projecting signals based on ATR volatility thresholds.

Indicator

Buy_v2