Bollinger Squeeze v4
Download script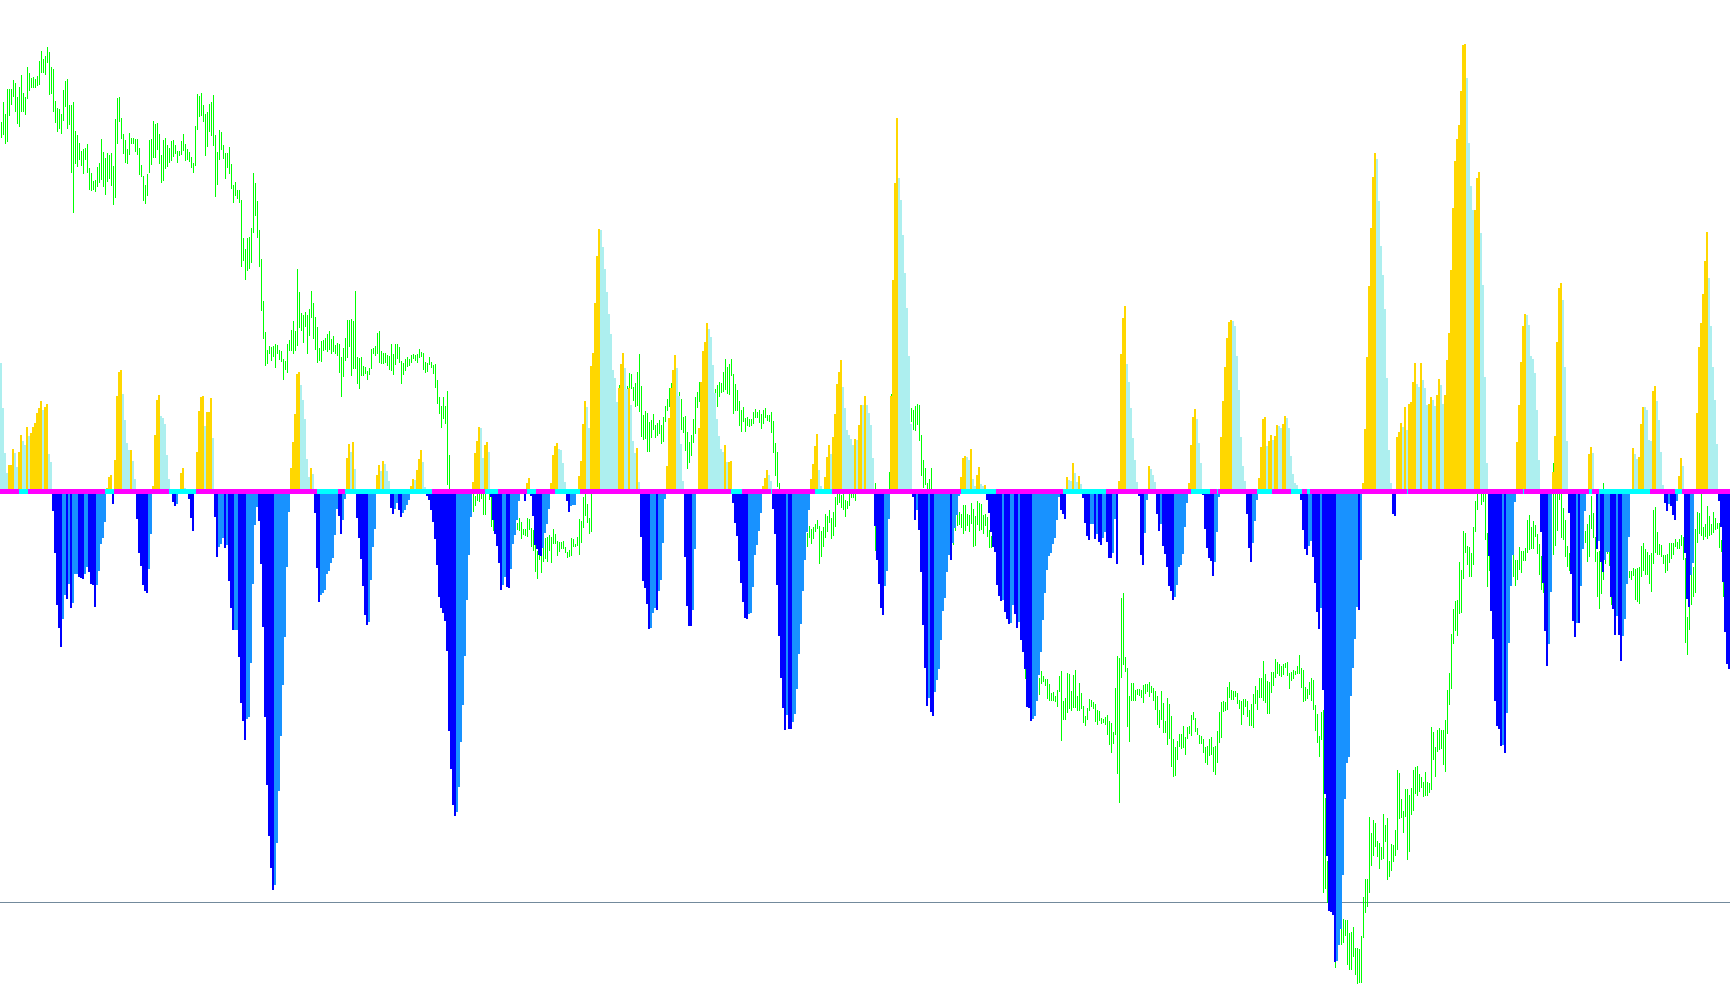
This script is designed to function as a visual technical indicator for MetaTrader, providing traders with a way to identify specific market conditions—primarily focusing on the relationship between price momentum and market volatility. It operates by analyzing historical price data to determine when the market is moving with strength and when it is entering a "squeeze" or period of low volatility.
Core Logic Overview
The tool processes data through three primary analytical layers:
1. Momentum Tracking (Linear Regression) At its foundation, the script uses a specialized version of linear regression to calculate momentum. Rather than just looking at simple price changes, it calculates a trend line based on the relationship between the closing prices and a weighted average of the market's highs and lows. This allows the tool to determine the "velocity" of the price movement in a smoothed manner.
2. Trend Visualization (The Histogram) Based on the momentum calculation above, the indicator generates a multi-colored histogram:
- Positive Momentum: When the trend is moving upward, the script tracks whether that momentum is increasing or decreasing. It assigns different colors to distinguish between accelerating upward moves and decelerating ones.
- Negative Momentum: Conversely, when the trend is moving downward, it differentiates between intensifying downward pressure and weakening moves.
- This visual feedback helps a user see not just the direction of the market, but the "heartbeat" or strength behind that direction.
3. Volatility Squeeze Detection (The Arrows) The most unique feature of this script is its ability to detect market "squeezes." It compares two different types of volatility:
- It looks at the Average True Range (ATR), which measures recent price movement.
- It looks at the Standard Deviation, which measures how much the price is deviating from its average.
By dividing these two values against a specific user-defined threshold (the Bollinger Band deviation), the script identifies periods where volatility has collapsed significantly. When this "squeeze" occurs, the indicator places specific markers (arrows) on the chart. These act as signals that the market is becoming extremely compressed and may be preparing for a breakout in either direction.
Summary of Use
For a trader, this tool provides a dual-layered perspective: the histogram gives a constant look at current trend strength and momentum shifts, while the squeeze detection highlights specific moments where the market is "coiling" like a spring, potentially indicating a major move is imminent.
//+------------------------------------------------------------------+
//|                                                    bbsqueeze.mq4 |
//|                Copyright © 2005, Nick Bilak, beluck[AT]gmail.com |
//+------------------------------------------------------------------+
#property copyright "Copyright © 2005, Nick Bilak"
#property link      "http://metatrader.50webs.com/"

#property indicator_separate_window
#property indicator_buffers 6
#property indicator_color1 Green
#property indicator_color2 IndianRed
#property indicator_color3 LimeGreen
#property indicator_color4 LightPink
#property indicator_color5 Blue
#property indicator_color6 Red
//---- input parameters
extern int       bolPrd=20;
extern double    bolDev=2.0;
extern int       keltPrd=20;
extern double    keltFactor=1.5;
extern int       momPrd=12;
//---- buffers
double upB[];
double loB[];
double upK[];
double loK[];
double upB2[];
double loB2[];
double mm[];

int i,j,slippage=3;
double breakpoint=0.0;
double ema=0.0;
int peakf=0;
int peaks=0;
int valleyf=0;
int valleys=0, limit=0;
double ccis[61],ccif[61];
double delta=0;
double ugol=0;

int init()
  {
//---- indicators
   IndicatorBuffers(7);
   SetIndexStyle(0,DRAW_HISTOGRAM,STYLE_SOLID,2);
   SetIndexBuffer(0,upB);
   SetIndexEmptyValue(0,EMPTY_VALUE);
   SetIndexStyle(1,DRAW_HISTOGRAM,STYLE_SOLID,2);
   SetIndexBuffer(1,loB);
   SetIndexEmptyValue(1,EMPTY_VALUE);

   SetIndexStyle(2,DRAW_HISTOGRAM,STYLE_SOLID,2);
   SetIndexBuffer(2,upB2);
   SetIndexEmptyValue(2,EMPTY_VALUE);
   SetIndexStyle(3,DRAW_HISTOGRAM,STYLE_SOLID,2);
   SetIndexBuffer(3,loB2);
   SetIndexEmptyValue(3,EMPTY_VALUE);
   SetIndexBuffer(6,mm);

   SetIndexStyle(4,DRAW_ARROW);
   SetIndexBuffer(4,upK);
   SetIndexEmptyValue(4,EMPTY_VALUE);
   SetIndexArrow(4,167);
   SetIndexStyle(5,DRAW_ARROW);
   SetIndexBuffer(5,loK);
   SetIndexEmptyValue(5,EMPTY_VALUE);
   SetIndexArrow(5,167);
   return(0);
  }
int start()
  {
   int counted_bars=IndicatorCounted();
   int shift,limit;
   double diff,d,std,bbs;

   if (counted_bars<0) return(-1);
   if (counted_bars>0) counted_bars--;
   limit=Bars-31;
   if(counted_bars>=31) limit=Bars-counted_bars-1;

   for (shift=limit;shift>=0;shift--)   {
      //d=iMomentum(NULL,0,momPrd,PRICE_CLOSE,shift);
      d=LinearRegressionValue(momPrd,shift);
  mm[shift]=d;
      if(d>0) {
         if (mm[shift]>mm[shift+1]) {
            upB[shift]=d;
            upB2[shift]=0;
            loB[shift]=0;
            loB2[shift]=0;
         } else {
            upB[shift]=0;
            upB2[shift]=d;
            loB[shift]=0;
            loB2[shift]=0;
         }
      } else {
         if (mm[shift]<mm[shift+1]) {
            loB[shift]=d;
            loB2[shift]=0;
            upB[shift]=0;
            upB2[shift]=0;
         } else {
            loB[shift]=0;
            loB2[shift]=d;
            upB[shift]=0;
            upB2[shift]=0;
         }
      }
  diff = iATR(NULL,0,keltPrd,shift)*keltFactor;
  std = iStdDev(NULL,0,bolPrd,MODE_SMA,0,PRICE_CLOSE,shift);
  bbs = bolDev * std / diff;
      if(bbs<1) {
         upK[shift]=0;
         loK[shift]=EMPTY_VALUE;
      } else {
         loK[shift]=0;
         upK[shift]=EMPTY_VALUE;
      }
   }
   return(0);
  }
//+------------------------------------------------------------------+


double LinearRegressionValue(int Len,int shift) {
   double SumBars = 0;
   double SumSqrBars = 0;
   double SumY = 0;
   double Sum1 = 0;
   double Sum2 = 0;
   double Slope = 0;

   SumBars = Len * (Len-1) * 0.5;
   SumSqrBars = (Len - 1) * Len * (2 * Len - 1)/6;

  for (int x=0; x<=Len-1;x++) {
   double HH = Low[x+shift];
   double LL = High[x+shift];
   for (int y=x; y<=(x+Len)-1; y++) {
     HH = MathMax(HH, High[y+shift]);
     LL = MathMin(LL, Low[y+shift]);
   }
    Sum1 += x* (Close[x+shift]-((HH+LL)/2 + iMA(NULL,0,Len,0,MODE_EMA,PRICE_CLOSE,x+shift))/2);
    SumY += (Close[x+shift]-((HH+LL)/2 + iMA(NULL,0,Len,0,MODE_EMA,PRICE_CLOSE,x+shift))/2);
  }
  Sum2 = SumBars * SumY;
  double Num1 = Len * Sum1 - Sum2;
  double Num2 = SumBars * SumBars-Len * SumSqrBars;

  if (Num2 != 0.0)  {
    Slope = Num1/Num2;
  } else {
    Slope = 0;
  }

  double Intercept = (SumY - Slope*SumBars) /Len;
  //debugPrintln(Intercept+" : "+Slope);
  double LinearRegValue = Intercept+Slope * (Len - 1);

  return (LinearRegValue);

}
Comments