Bollinger Squeeze
Download script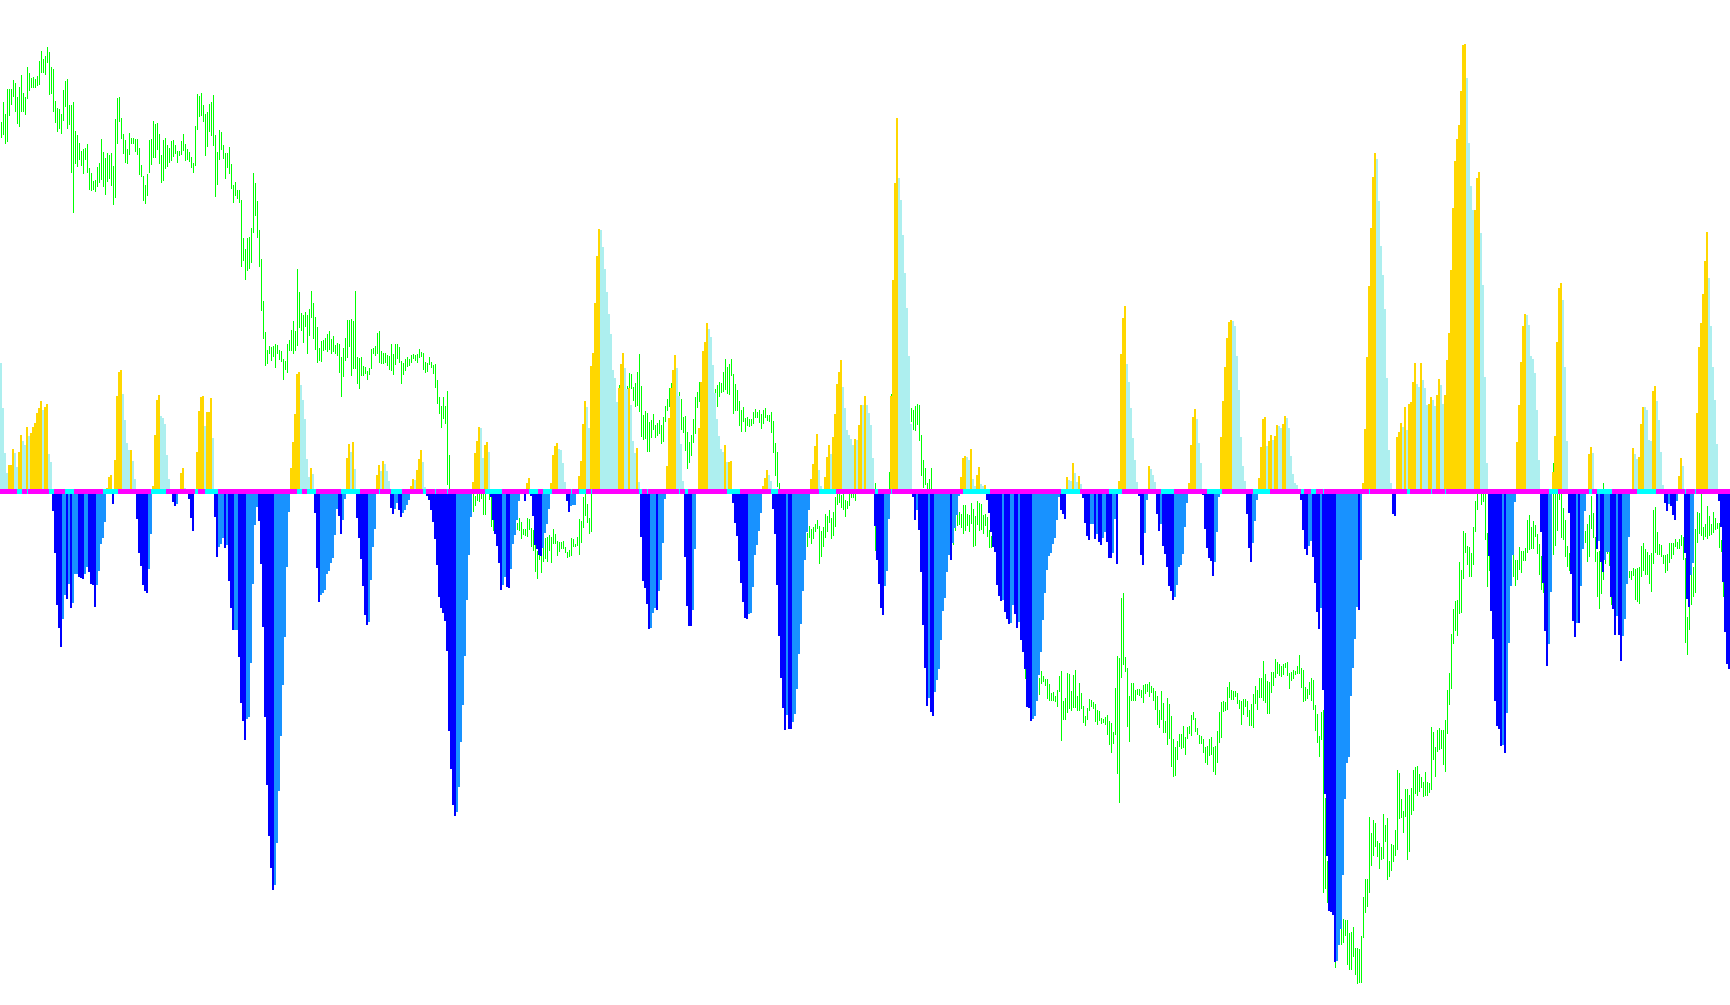
The Bollinger Squeeze indicator is designed to provide traders with a visual representation of market momentum and volatility. By analyzing the relationship between price trends and historical fluctuations, it helps identify periods where the market is "squeezing" (accumulating energy) versus when it is actively moving.
Core Logic Overview
The script operates by combining three distinct types of mathematical analysis to give a comprehensive view of market behavior:
1. Momentum Tracking (Trend Direction)
The foundation of this indicator is based on linear regression values. Unlike simple moving averages that follow the price, this logic calculates the "slope" or trajectory of the price movement over a specific period.
- Visual Representation: This produces a histogram that changes color and direction based on whether momentum is increasing or decreasing. It distinguishes between positive momentum (rising strength) and negative momentum (falling strength), allowing users to see the underlying trend regardless of minor price noise.
2. Volatility Filtering (The "Squeeze")
To determine if the market is in a state of low volatility—often a precursor to a significant price breakout—the script performs a specialized calculation involving:
- Standard Deviation: Measuring how much the price fluctuates from its average.
- Average True Range (ATR): Measuring the actual distance of price movement. By comparing the ratio between these two metrics against user-defined thresholds, the indicator identifies "squeezes."
3. Dynamic Signal Generation
The logic uses the relationship between current volatility and the historical "spread" to place visual markers on the chart:
- Market Stability: When volatility is unusually low relative to the trend, the script recognizes a potential buildup of energy.
- Breakout Indicators: The script generates specific arrows to alert the user when the conditions for a price expansion are met. These act as visual cues, indicating that the "squeeze" may be releasing and a new directional move is likely beginning.
How it assists the trader
Instead of just showing you where the price is, this script explains what the price is doing. It highlights:
- Strength: Is the current move gaining or losing speed?
- Compression: Is the market becoming too quiet (squeezed) before a potential explosion in movement?
- Confluence: By showing both momentum and volatility on one screen, it helps traders avoid entering "fake" moves and instead focus on high-probability breakouts where trend strength meets a volatility release.
//+------------------------------------------------------------------+
//|                                                    bbsqueeze.mq4 |
//|                Copyright © 2005, Nick Bilak, beluck[AT]gmail.com |
//+------------------------------------------------------------------+
#property copyright "Copyright © 2005, Nick Bilak"
#property link      "http://metatrader.50webs.com/"

#property indicator_separate_window
#property indicator_buffers 6
#property indicator_color1 Green
#property indicator_color2 IndianRed
#property indicator_color3 LimeGreen
#property indicator_color4 LightPink
#property indicator_color5 Red
#property indicator_color6 Lime
//---- input parameters
extern int       bolPrd=20;//12
extern double    bolDev=2.0;
extern int       keltPrd=2;//20;6;10
extern double    keltFactor=1.5;
extern int       momPrd=12;
//---- buffers
double upB[];
double loB[];
double upK[];
double loK[];
double upB2[];
double loB2[];
double mm[];

int i,j,slippage=3;
double breakpoint=0.0;
double ema=0.0;
int peakf=0;
int peaks=0;
int valleyf=0;
int valleys=0, limit=0;
double ccis[61],ccif[61];
double delta=0;
double ugol=0;

int init()
  {
//---- indicators
   IndicatorBuffers(7);
   SetIndexStyle(0,DRAW_HISTOGRAM,STYLE_SOLID,2);
   SetIndexBuffer(0,upB);
   SetIndexEmptyValue(0,EMPTY_VALUE);
   SetIndexStyle(1,DRAW_HISTOGRAM,STYLE_SOLID,2);
   SetIndexBuffer(1,loB);
   SetIndexEmptyValue(1,EMPTY_VALUE);

   SetIndexStyle(2,DRAW_HISTOGRAM,STYLE_SOLID,2);
   SetIndexBuffer(2,upB2);
   SetIndexEmptyValue(2,EMPTY_VALUE);
   SetIndexStyle(3,DRAW_HISTOGRAM,STYLE_SOLID,2);
   SetIndexBuffer(3,loB2);
   SetIndexEmptyValue(3,EMPTY_VALUE);
   SetIndexBuffer(6,mm);

   SetIndexStyle(4,DRAW_ARROW);
   SetIndexBuffer(4,upK);
   SetIndexEmptyValue(4,EMPTY_VALUE);
   SetIndexArrow(4,167);
   SetIndexStyle(5,DRAW_ARROW);
   SetIndexBuffer(5,loK);
   SetIndexEmptyValue(5,EMPTY_VALUE);
   SetIndexArrow(5,167);
   return(0);
  }
int start()
  {
   int counted_bars=IndicatorCounted();
   int shift,limit;
   double diff,d,std,bbs;

   if (counted_bars<0) return(-1);
   if (counted_bars>0) counted_bars--;
   limit=Bars-31;
   if(counted_bars>=31) limit=Bars-counted_bars-1;

   for (shift=limit;shift>=0;shift--)   {
      //d=iMomentum(NULL,0,momPrd,PRICE_CLOSE,shift);
      d=LinearRegressionValue(momPrd,shift);
  mm[shift]=d;
      if(d>0) {
         if (mm[shift]>mm[shift+1]) {
            upB[shift]=d;
            upB2[shift]=0;
            loB[shift]=0;
            loB2[shift]=0;
         } else {
            upB[shift]=0;
            upB2[shift]=d;
            loB[shift]=0;
            loB2[shift]=0;
         }
      } else {
         if (mm[shift]<mm[shift+1]) {
            loB[shift]=d;
            loB2[shift]=0;
            upB[shift]=0;
            upB2[shift]=0;
         } else {
            loB[shift]=0;
            loB2[shift]=d;
            upB[shift]=0;
            upB2[shift]=0;
         }
      }
  diff = iATR(NULL,0,keltPrd,shift)*keltFactor;
  std = iStdDev(NULL,0,bolPrd,MODE_SMA,0,PRICE_CLOSE,shift);
  bbs = bolDev * std / diff;
      if(bbs<1) {
         upK[shift]=0;
         loK[shift]=EMPTY_VALUE;
      } else {
         loK[shift]=0;
         upK[shift]=EMPTY_VALUE;
      }
   }
   return(0);
  }
//+------------------------------------------------------------------+


double LinearRegressionValue(int Len,int shift) {
   double SumBars = 0;
   double SumSqrBars = 0;
   double SumY = 0;
   double Sum1 = 0;
   double Sum2 = 0;
   double Slope = 0;

   SumBars = Len * (Len-1) * 0.5;
   SumSqrBars = (Len - 1) * Len * (2 * Len - 1)/6;

  for (int x=0; x<=Len-1;x++) {
   double HH = Low[x+shift];
   double LL = High[x+shift];
   for (int y=x; y<=(x+Len)-1; y++) {
     HH = MathMax(HH, High[y+shift]);
     LL = MathMin(LL, Low[y+shift]);
   }
    Sum1 += x* (Close[x+shift]-((HH+LL)/2 + iMA(NULL,0,Len,0,MODE_EMA,PRICE_CLOSE,x+shift))/2);
    SumY += (Close[x+shift]-((HH+LL)/2 + iMA(NULL,0,Len,0,MODE_EMA,PRICE_CLOSE,x+shift))/2);
  }
  Sum2 = SumBars * SumY;
  double Num1 = Len * Sum1 - Sum2;
  double Num2 = SumBars * SumBars-Len * SumSqrBars;

  if (Num2 != 0.0)  {
    Slope = Num1/Num2;
  } else {
    Slope = 0;
  }

  double Intercept = (SumY - Slope*SumBars) /Len;
  //debugPrintln(Intercept+" : "+Slope);
  double LinearRegValue = Intercept+Slope * (Len - 1);

  return (LinearRegValue);

}
Comments