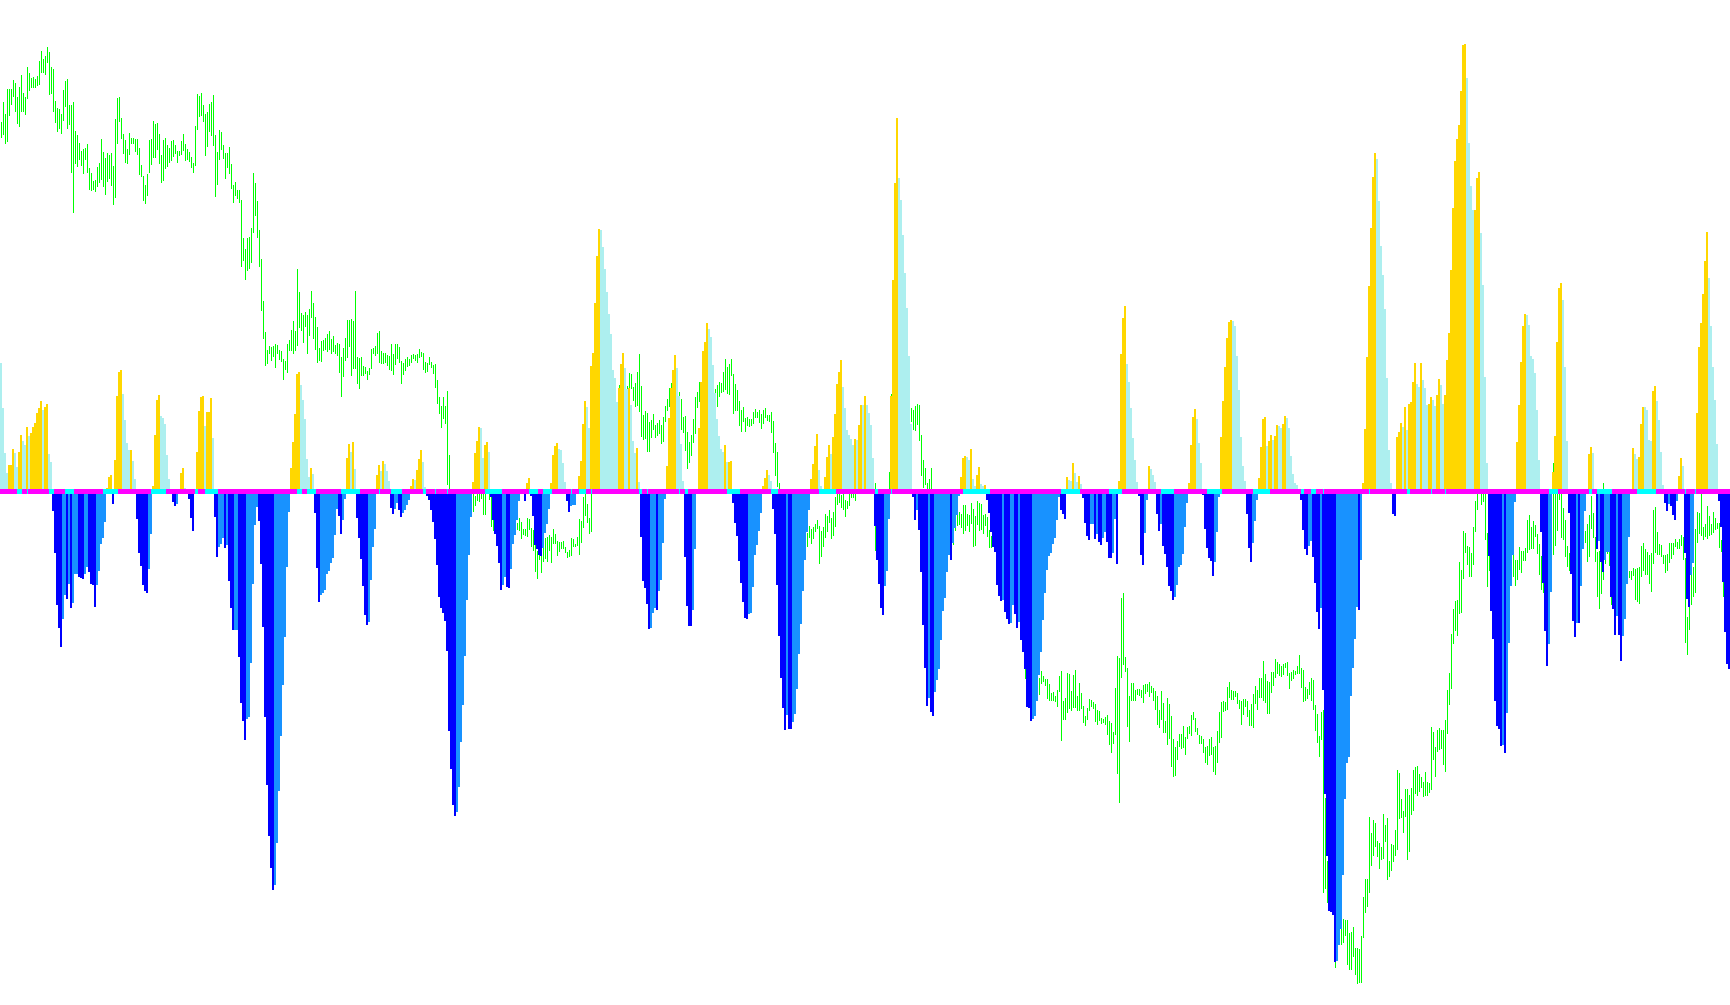
This indicator is designed to help traders visualize market momentum and identify specific periods of volatility contraction, often referred to as "squeezes." It achieves this by combining three distinct analytical methods: linear regression, standard deviation, and average true range.
Core Logic Components
1. Momentum Analysis via Linear Regression The foundation of the script is a custom calculation that determines the direction and strength of the market's movement. Unlike a simple moving average, this logic uses a linear regression model to project the current price trend based on historical highs, lows, and moving averages.
- Directional Tracking: The tool tracks whether this momentum is increasing or decreasing.
- Visual Representation: It uses different colored bars (histograms) to show whether the market is trending upward or downward. By comparing the current calculation to the previous one, it highlights whether the "speed" of the trend is accelerating or slowing down.
2. Volatility Scaling To understand the "squeeze," the script compares two different types of price variability:
- Standard Deviation: This measures how much the price typically fluctuates from its average over a set period.
- Average True Range (ATR): This measures the actual range of price movement (the distance between highs and lows) over a shorter, more immediate period.
3. The Squeeze Identification The primary objective of the script is to calculate a ratio between these two types of volatility.
- When the standard deviation is significantly lower than the average price range, it indicates that the market is becoming "tight" or compressed.
- The script translates this compression into visual signals (arrows) on your chart. These signals act as alerts for potential breakouts; essentially, they highlight moments when the market is building energy in a narrow range, which often precedes a sharp move in either direction.
Summary of Visual Output
For the end user, the indicator provides a multi-layered view of the market:
- Trend Histograms: Show the current momentum and whether it is strengthening or weakening.
- Squeeze Signals: Use specific icons to notify you when price volatility has contracted significantly, indicating a high-probability zone for a potential trend expansion.
//+------------------------------------------------------------------+
//|                                                    bbsqueeze.mq4 |
//|                Copyright © 2005, Nick Bilak, beluck[AT]gmail.com |
//+------------------------------------------------------------------+
#property copyright "Copyright © 2005, Nick Bilak"
#property link      "http://metatrader.50webs.com/"

#property indicator_separate_window
#property indicator_buffers 6
#property indicator_color1 Green
#property indicator_color2 IndianRed
#property indicator_color3 LimeGreen
#property indicator_color4 LightPink
#property indicator_color5 Red
#property indicator_color6 Lime
//---- input parameters
extern int       bolPrd=20;//12
extern double    bolDev=2.0;
extern int       keltPrd=2;//20;6;10
extern double    keltFactor=1.5;
extern int       momPrd=12;
extern bool      DataDisplayOff  = true;
//---- buffers
double upB[];
double loB[];
double upK[];
double loK[];
double upB2[];
double loB2[];
double mm[];

int i,j,slippage=3;
double breakpoint=0.0;
double ema=0.0;
int peakf=0;
int peaks=0;
int valleyf=0;
int valleys=0, limit=0;
double ccis[61],ccif[61];
double delta=0;
double ugol=0;

int init()
  {
//---- indicators
   IndicatorBuffers(7);
   SetIndexStyle(0,DRAW_HISTOGRAM,STYLE_SOLID,2);
   SetIndexBuffer(0,upB);
   SetIndexEmptyValue(0,EMPTY_VALUE);
   SetIndexStyle(1,DRAW_HISTOGRAM,STYLE_SOLID,2);
   SetIndexBuffer(1,loB);
   SetIndexEmptyValue(1,EMPTY_VALUE);

   SetIndexStyle(2,DRAW_HISTOGRAM,STYLE_SOLID,2);
   SetIndexBuffer(2,upB2);
   SetIndexEmptyValue(2,EMPTY_VALUE);
   SetIndexStyle(3,DRAW_HISTOGRAM,STYLE_SOLID,2);
   SetIndexBuffer(3,loB2);
   SetIndexEmptyValue(3,EMPTY_VALUE);
   SetIndexBuffer(6,mm);

   SetIndexStyle(4,DRAW_ARROW);
   SetIndexBuffer(4,upK);
   SetIndexEmptyValue(4,EMPTY_VALUE);
   SetIndexArrow(4,167);
   SetIndexStyle(5,DRAW_ARROW);
   SetIndexBuffer(5,loK);
   SetIndexEmptyValue(5,EMPTY_VALUE);
   SetIndexArrow(5,167);

   SetIndexLabel(0,"upB");
   SetIndexLabel(1,"loB");
   SetIndexLabel(2,"upK");
   SetIndexLabel(3,"loK");
   SetIndexLabel(4,"upB2");
   SetIndexLabel(5,"loB2");
   SetIndexLabel(6,"mm");

if (DataDisplayOff)
  {
   SetIndexLabel(0,"");
   SetIndexLabel(1,"");
   SetIndexLabel(2,"");
   SetIndexLabel(3,"");
   SetIndexLabel(4,"");
   SetIndexLabel(5,"");
   SetIndexLabel(6,"");
  }

   return(0);
  }
int start()
  {
   int counted_bars=IndicatorCounted();
   int shift,limit;
   double diff,d,std,bbs;

   if (counted_bars<0) return(-1);
   if (counted_bars>0) counted_bars--;
   limit=Bars-31;
   if(counted_bars>=31) limit=Bars-counted_bars-1;

   for (shift=limit;shift>=0;shift--)   {
      //d=iMomentum(NULL,0,momPrd,PRICE_CLOSE,shift);
      d=LinearRegressionValue(momPrd,shift);
  mm[shift]=d;
      if(d>0) {
         if (mm[shift]>mm[shift+1]) {
            upB[shift]=d;
            upB2[shift]=0;
            loB[shift]=0;
            loB2[shift]=0;
         } else {
            upB[shift]=0;
            upB2[shift]=d;
            loB[shift]=0;
            loB2[shift]=0;
         }
      } else {
         if (mm[shift]<mm[shift+1]) {
            loB[shift]=d;
            loB2[shift]=0;
            upB[shift]=0;
            upB2[shift]=0;
         } else {
            loB[shift]=0;
            loB2[shift]=d;
            upB[shift]=0;
            upB2[shift]=0;
         }
      }
  diff = iATR(NULL,0,keltPrd,shift)*keltFactor;
  std = iStdDev(NULL,0,bolPrd,MODE_SMA,0,PRICE_CLOSE,shift);
  bbs = bolDev * std / diff;
      if(bbs<1) {
         upK[shift]=0;
         loK[shift]=EMPTY_VALUE;
      } else {
         loK[shift]=0;
         upK[shift]=EMPTY_VALUE;
      }
   }
   return(0);
  }
//+------------------------------------------------------------------+


double LinearRegressionValue(int Len,int shift) {
   double SumBars = 0;
   double SumSqrBars = 0;
   double SumY = 0;
   double Sum1 = 0;
   double Sum2 = 0;
   double Slope = 0;

   SumBars = Len * (Len-1) * 0.5;
   SumSqrBars = (Len - 1) * Len * (2 * Len - 1)/6;

  for (int x=0; x<=Len-1;x++) {
   double HH = Low[x+shift];
   double LL = High[x+shift];
   for (int y=x; y<=(x+Len)-1; y++) {
     HH = MathMax(HH, High[y+shift]);
     LL = MathMin(LL, Low[y+shift]);
   }
    Sum1 += x* (Close[x+shift]-((HH+LL)/2 + iMA(NULL,0,Len,0,MODE_EMA,PRICE_CLOSE,x+shift))/2);
    SumY += (Close[x+shift]-((HH+LL)/2 + iMA(NULL,0,Len,0,MODE_EMA,PRICE_CLOSE,x+shift))/2);
  }
  Sum2 = SumBars * SumY;
  double Num1 = Len * Sum1 - Sum2;
  double Num2 = SumBars * SumBars-Len * SumSqrBars;

  if (Num2 != 0.0)  {
    Slope = Num1/Num2;
  } else {
    Slope = 0;
  }

  double Intercept = (SumY - Slope*SumBars) /Len;
  //debugPrintln(Intercept+" : "+Slope);
  double LinearRegValue = Intercept+Slope * (Len - 1);

  return (LinearRegValue);

}
Comments