Here's an explanation of what the MetaTrader script does, suitable for someone who doesn't know how to program:
Overall Purpose
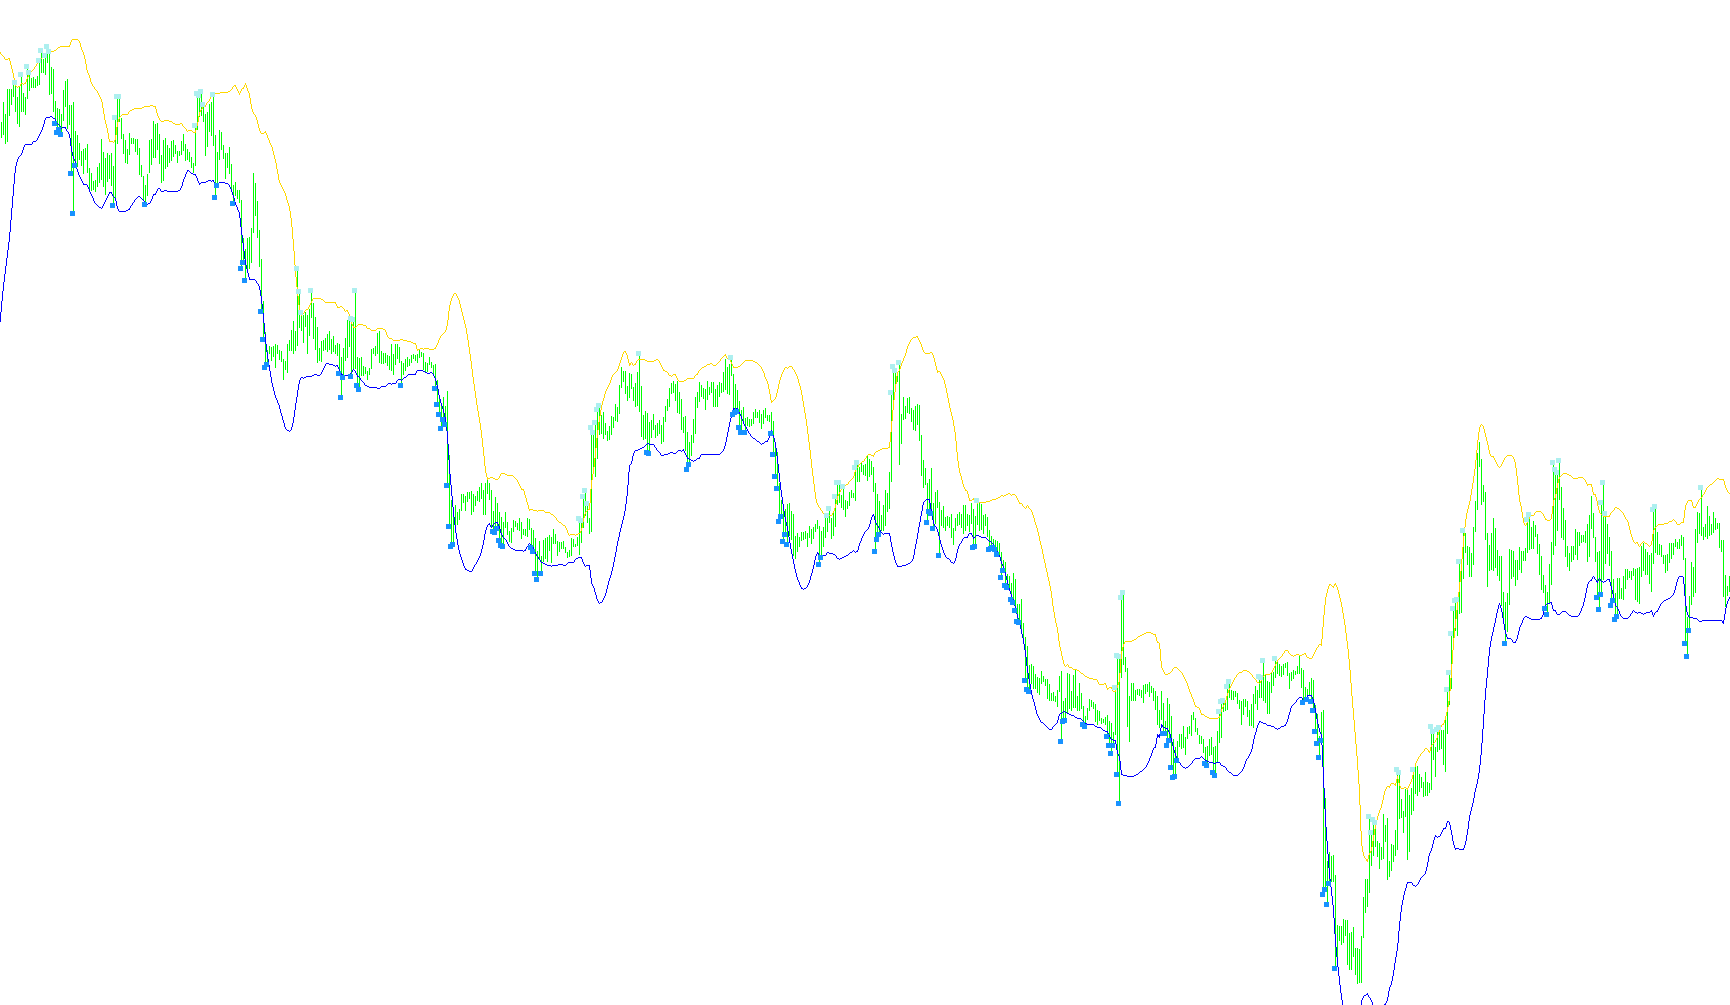
This script is designed to help traders identify potential trading opportunities called "Gimme Bars" on a price chart. Gimme Bars are a specific pattern that some traders believe indicates a possible change in the direction of the price. The script also tries to identify possible entry points for trades based on those patterns.
How it Works
-
Bollinger Bands: The script starts by calculating something called "Bollinger Bands." Imagine a moving average line drawn through the middle of the price data. Now, picture two more lines drawn above and below that central line. These are the Bollinger Bands. They're calculated using the average price over a certain period (set by you as
BobaPeriod) and how much the price typically varies from that average (controlled byBobaDeviations). The bands essentially show how "normal" or "extreme" the current price is. -
Finding Potential Gimme Bars (Sell Signals):
- The script looks at each price bar (candlestick) on the chart.
- It checks if the price reached the upper Bollinger Band (meaning the price was relatively high).
- It also checks if the bar closed lower than it opened, indicating a possible downward turn.
- If both of those things are true, the script marks that bar as a potential "sell" Gimme Bar by drawing a small arrow above the bar.
-
Finding Potential Gimme Bars (Buy Signals):
- It does almost the opposite of the sell signal.
- It checks if the price touched the lower Bollinger Band (meaning the price was relatively low).
- It also checks if the bar closed higher than it opened, indicating a possible upward turn.
- If both are true, the script marks that bar as a potential "buy" Gimme Bar by drawing a small arrow below the bar.
-
Alerts: When a new Gimme Bar is found the script creates an alert that triggers an on screen message and sound.
In Simple Terms:
The script watches the price chart, looking for times when the price has moved unusually high or low (according to the Bollinger Bands) and the price movement within that bar hints at a possible reversal. It then flags those moments so a trader can investigate further. Think of it like a detective searching for clues ? the script highlights possible clues, but the trader has to decide if it's a real opportunity.
//+------------------------------------------------------------------+
//|                                                     Gimmebar.mq4 |
//| See Joe Ross Trading Manual on Gimme-Bars (e.g. from the         |
//| library on www.trading-naked.com)
//|Bolllitouch - yet another perky mod                                |
//+------------------------------------------------------------------+
#property  copyright "by Shimodax, 2005"
#property  link      "http://www.strategybuilder.com"


//---- indicator settings
#property  indicator_chart_window
#property  indicator_buffers 6
#property  indicator_color1  SlateBlue
#property  indicator_color2  SlateBlue
#property  indicator_color3  Pink
#property  indicator_color4  LightBlue
#property  indicator_color5  Pink
#property  indicator_color6  LightBlue


//---- indicator parameters
extern int    BobaPeriod= 20;
extern double BobaDeviations= 2.0;
extern bool   Alert_ON=true;
extern bool   Use_Sound=true;

//---- indicator buffers
double     BufferBand1[];
double     BufferBand2[];
double     BufferSell[];
double     BufferBuy[];
double     BufferSellEntry[];
double     BufferBuyEntry[];
string UD="";


//+------------------------------------------------------------------+
//|                                                                  |
//+------------------------------------------------------------------+
int init()
{
   //---- 2 additional buffers are used for counting.

   IndicatorDigits(MarketInfo(Symbol(),MODE_DIGITS)+2);

   // two bollies
   SetIndexBuffer(0,BufferBand1);
   SetIndexStyle(0,DRAW_LINE);
   SetIndexDrawBegin(0,BobaPeriod);

   SetIndexBuffer(1,BufferBand2);
   SetIndexStyle(1,DRAW_LINE);
   SetIndexDrawBegin(1,BobaPeriod);

   // marks for gimmees
   SetIndexBuffer(2,BufferSell);
   SetIndexStyle(2,DRAW_ARROW);
   SetIndexDrawBegin(2,BobaPeriod);
   SetIndexArrow(2, 167);
   SetIndexEmptyValue(2, 0);

   SetIndexBuffer(3,BufferBuy);
   SetIndexStyle(3,DRAW_ARROW);
   SetIndexDrawBegin(3,BobaPeriod);
   SetIndexArrow(3, 167);
   SetIndexEmptyValue(3, 0);

   // marks for entries
   SetIndexBuffer(4,BufferSellEntry);
   SetIndexStyle(4,DRAW_ARROW);
   SetIndexDrawBegin(4,BobaPeriod);
   SetIndexArrow(4, 238);
   SetIndexEmptyValue(4, 0);

   SetIndexBuffer(5,BufferBuyEntry);
   SetIndexStyle(5,DRAW_ARROW);
   SetIndexDrawBegin(5,BobaPeriod);
   SetIndexArrow(5, 236);
   SetIndexEmptyValue(5, 0);


   //---- name for DataWindow and indicator subwindow label
   // IndicatorShortName("GimmeBar ");

   //---- initialization done
   return(0);
}


//+------------------------------------------------------------------+
//| Custom indicator iteration function                              |
//+------------------------------------------------------------------+
int start()
{
   int counted_bars= IndicatorCounted(),
         lastbar;

   if (counted_bars>0)
      counted_bars--;

   lastbar= Bars - counted_bars;

   GimmeeBar(0, lastbar, BufferSell, BufferBuy, BufferSellEntry, BufferBuyEntry, BufferBand1, BufferBand2, BobaPeriod, BobaDeviations);

   return (0);
}


//+------------------------------------------------------------------+
//| Mark Gimmee-Bars and mark possible entries for deals              |
//+------------------------------------------------------------------+
double GimmeeBar(int offset, int lastbar, double &sellbuf[], double &buybuf[], double &sellbuf2[], double &buybuf2[],
                  double &band1buf[], double&band2buf[], int period, double deviation)
{
   double band1, band2;
   int markerdist= 5;   // distance between bars and marker dots

   lastbar= MathMin(Bars-period, lastbar);

   //---- main loop
   for(int i= lastbar; i>=offset; i--){

      sellbuf[i]= 0;
      buybuf[i]=0;
      sellbuf2[i]= 0;
      buybuf2[i]=0;

      double ma     =     iMA(NULL,0,period,0,MODE_SMA,PRICE_CLOSE,i);
      double stdDev = iStdDev(NULL,0,period,0,MODE_SMA,PRICE_CLOSE,i);

      band1= ma+stdDev*deviation;
      band2= ma-stdDev*deviation;

      band1buf[i]= band1;
      band2buf[i]= band2;


      // 1. Prices were rising.
      // 2. Prices touched the upper band.
      // 3. The price bar closed lower than it
      // opened when prices were previously rising.
      // or vice versa

      if (High[i]>=band1)  {
         sellbuf[i]= High[i] + markerdist*Point;
         if (i < 2 )

	{
	   UD="m Down";
		DoAlert(UD);
	}
      }


      if (Low[i]<=band2)  {
         buybuf[i]= Low[i] - markerdist*Point;
         if (i < 2 )

	{
	   UD="m Up.";
		DoAlert(UD);
	}

      }


      // Should such a price bar occur, a sell short order is to be executed
      // one tick below the low of the Gimmee bar.

     // if (sellbuf[i+1]!=0 && Low[i]<Low[i+1]-1*Point) {
      //   sellbuf2[i]= Low[i+1]-1*Point;
     // }

     // if (buybuf[i+1]!=0 && High[i]>High[i+1]+1*Point) {
     //    buybuf2[i]= High[i+1]+1*Point;
     // }

   }

   /*
   if (DebugLogger)
      Print(TimeOffset(offset), "BG-GimmeBar ", "");
   */

   return (0);
}

//+------------------------------------------------------------------+
void DoAlert(string UD)
{
   if (!NewBar() || !Use_Sound)
      return;
     if(Alert_ON==true)Alert("Alert ! Line Touched "+Symbol()+" M"+Period()+" @ "+DoubleToStr(Bid,Digits)+"");
     PlaySound ("Alert2");
}


  bool NewBar()
{
   static datetime dt  = 0;
   if (dt != Time[0])
   {
      dt = Time[0];
      return(true);
   }
}
Comments