WisemanAO
Indicator

WisemanAO

iAO

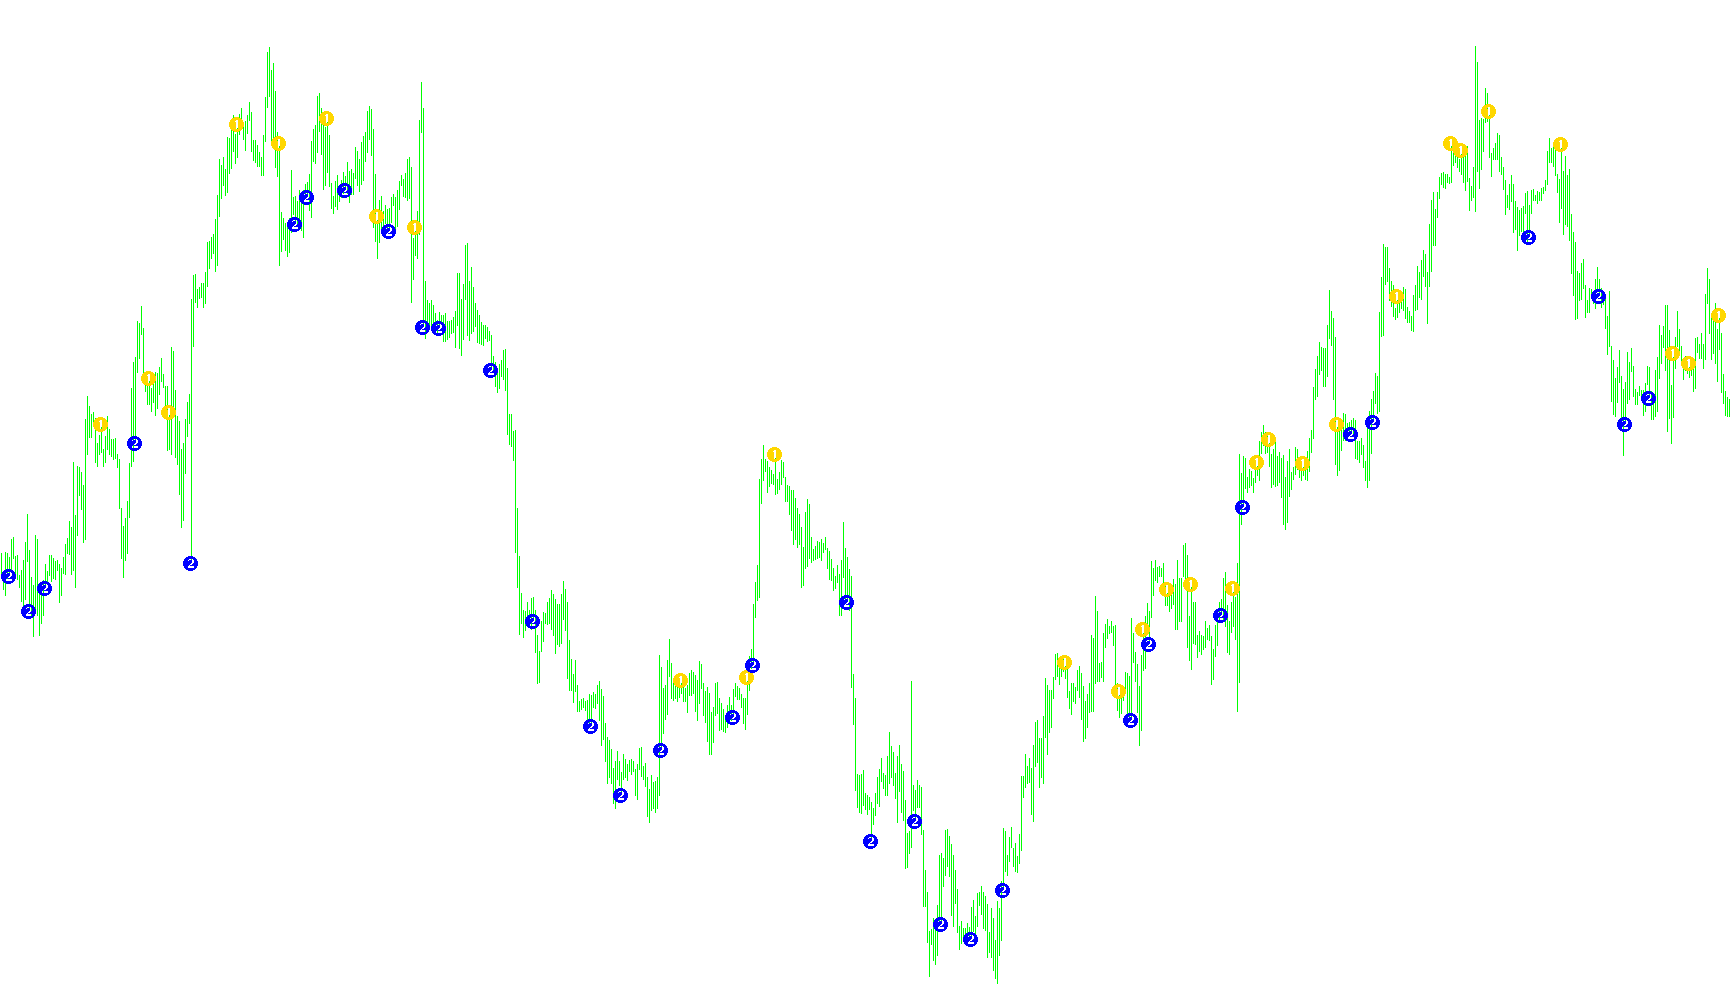
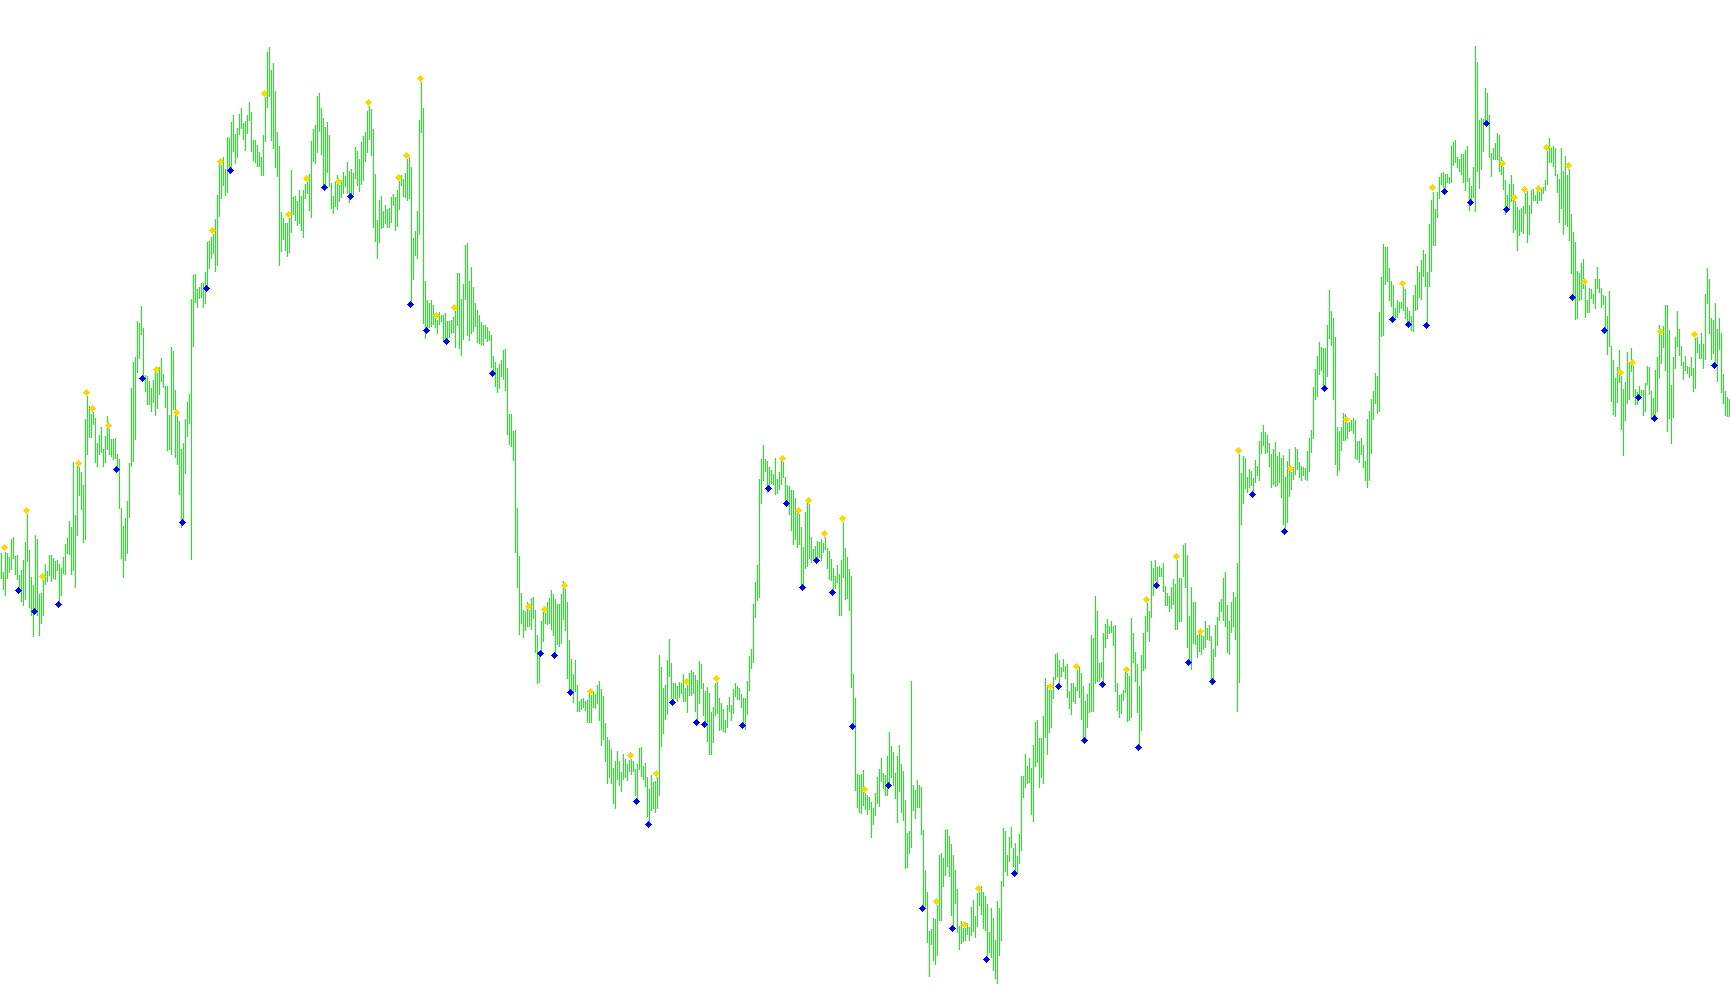
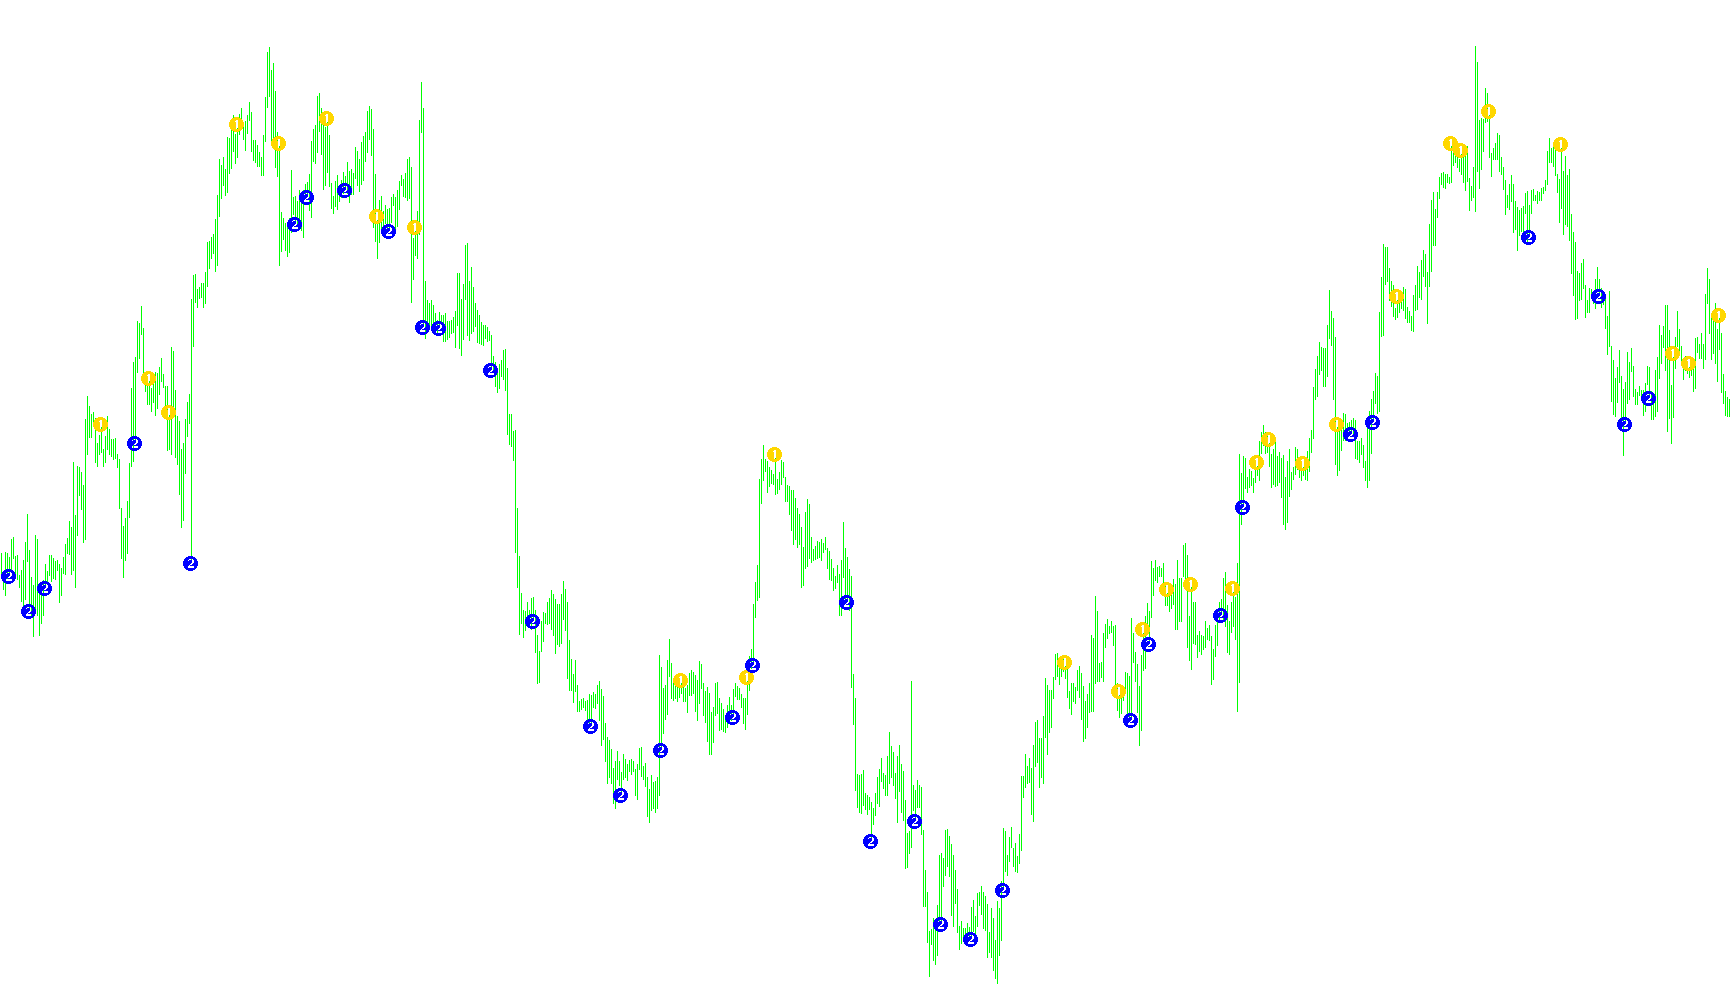
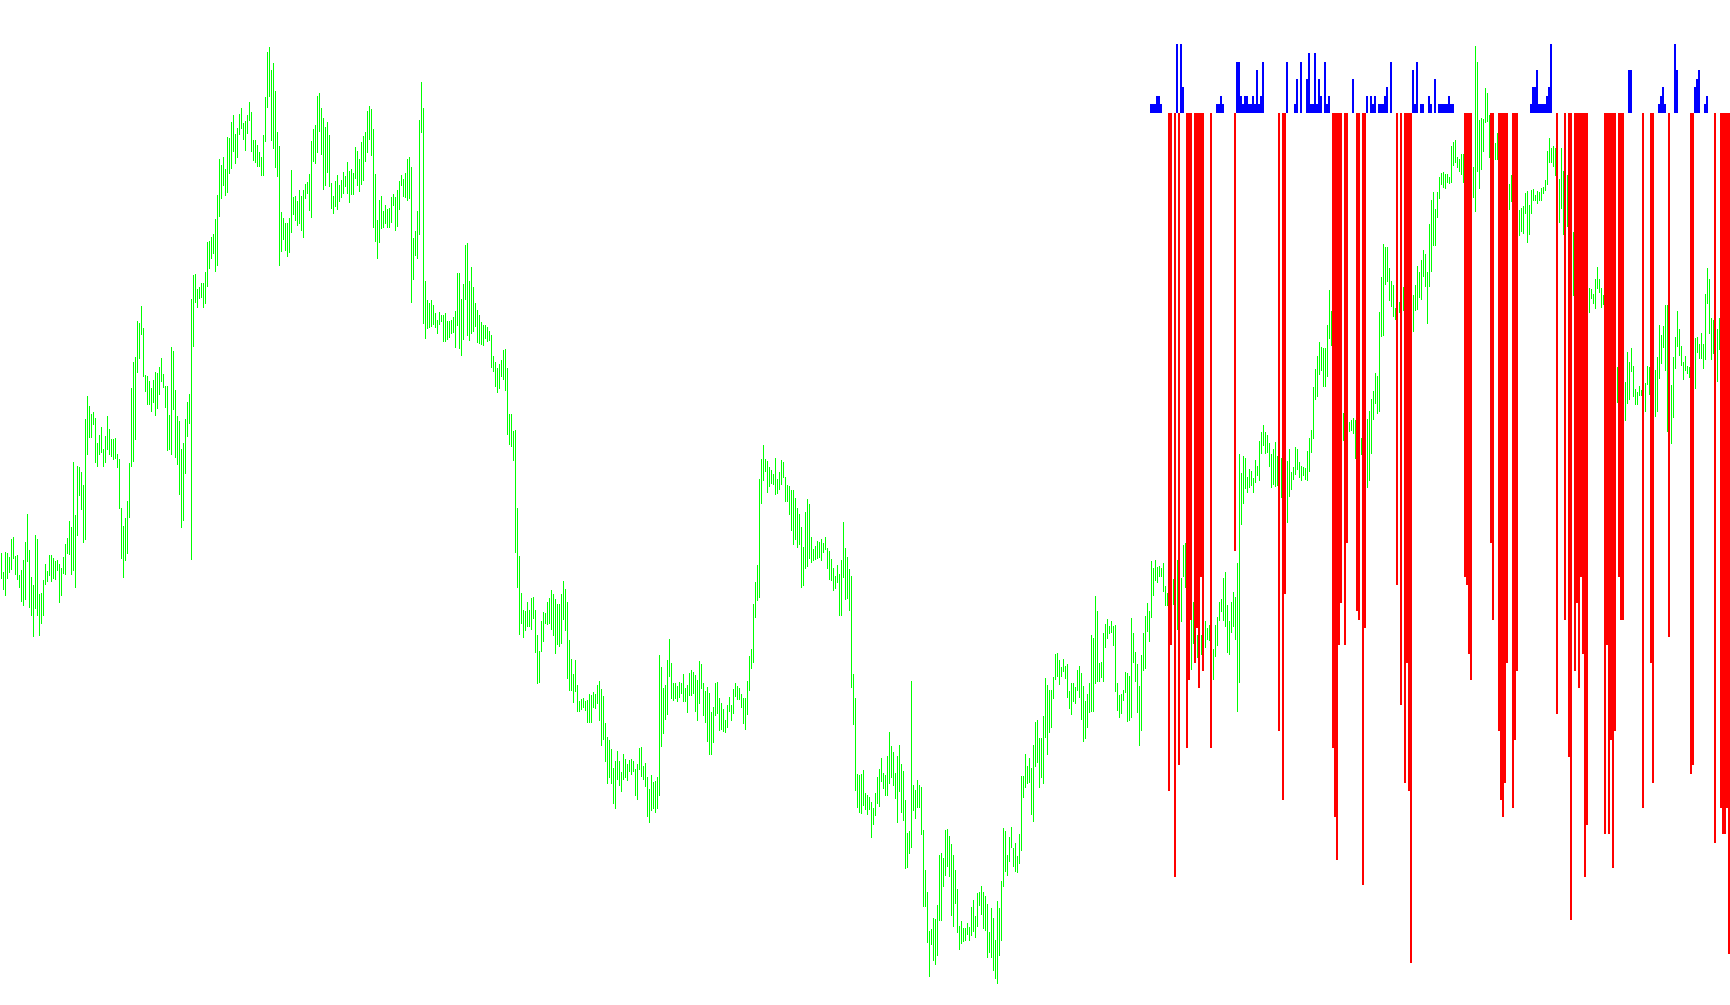
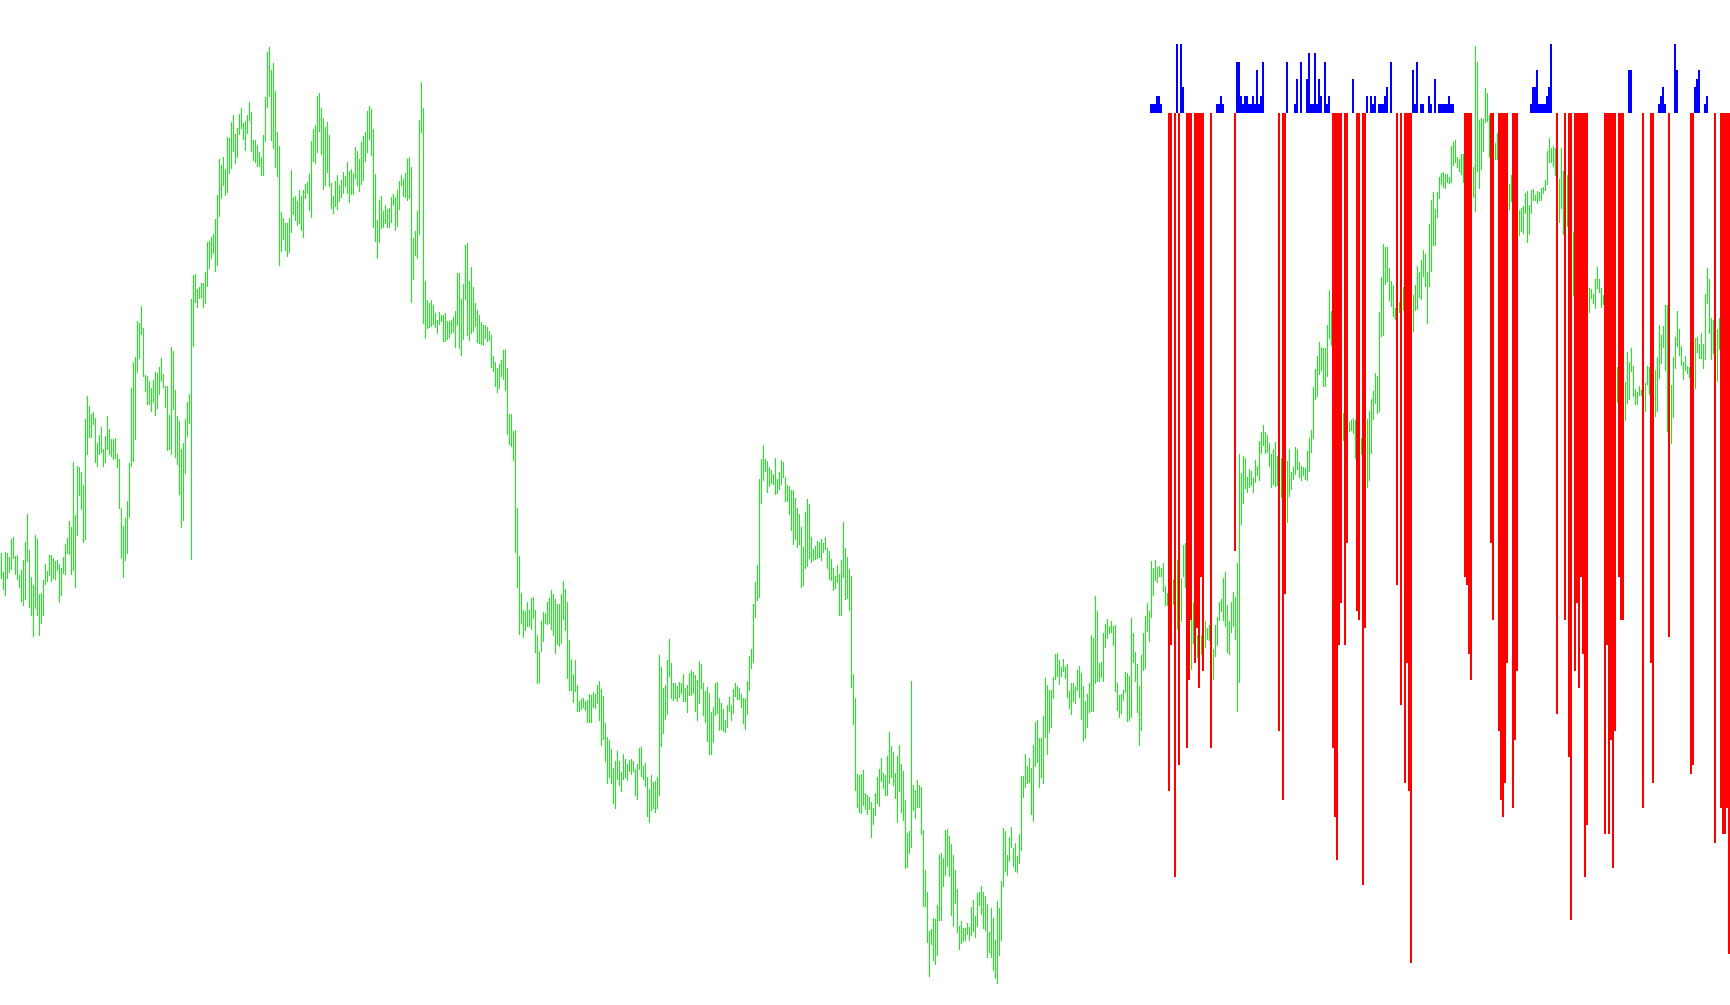
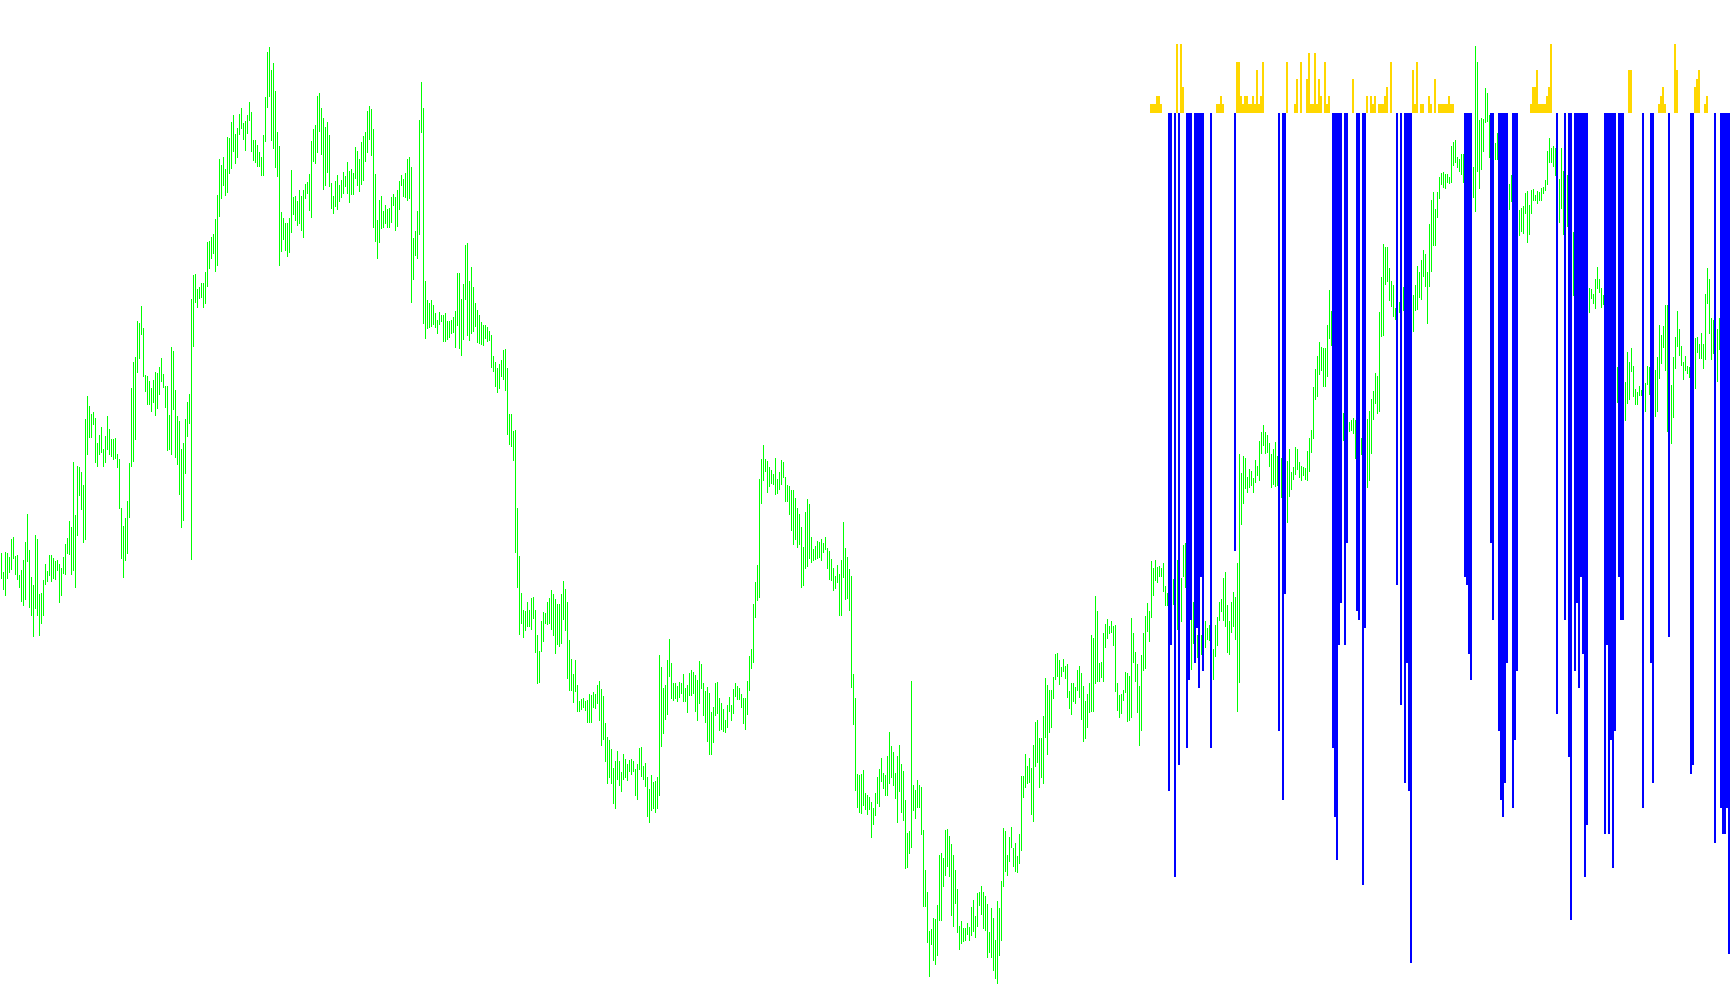
Identifies trend reversal points by detecting specific directional pivot patterns in the Awesome Oscillator's momentum curve.

WisemanAO_v1
Indicator

WisemanAO_v1

iAO

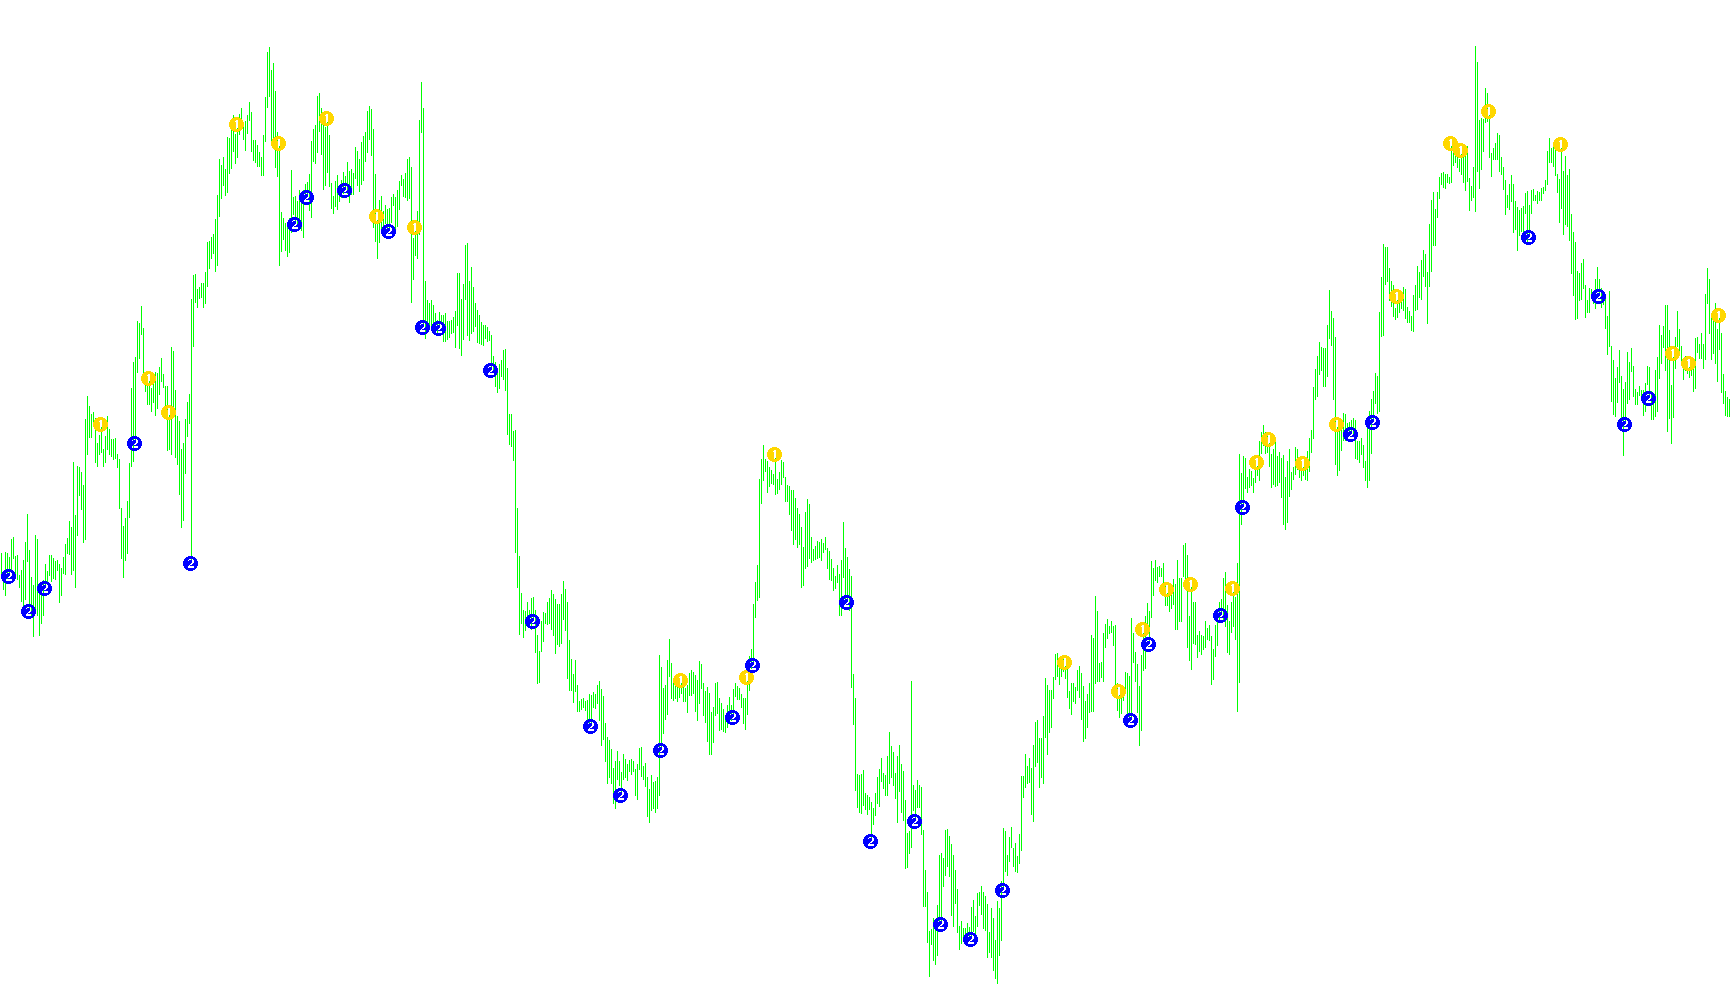
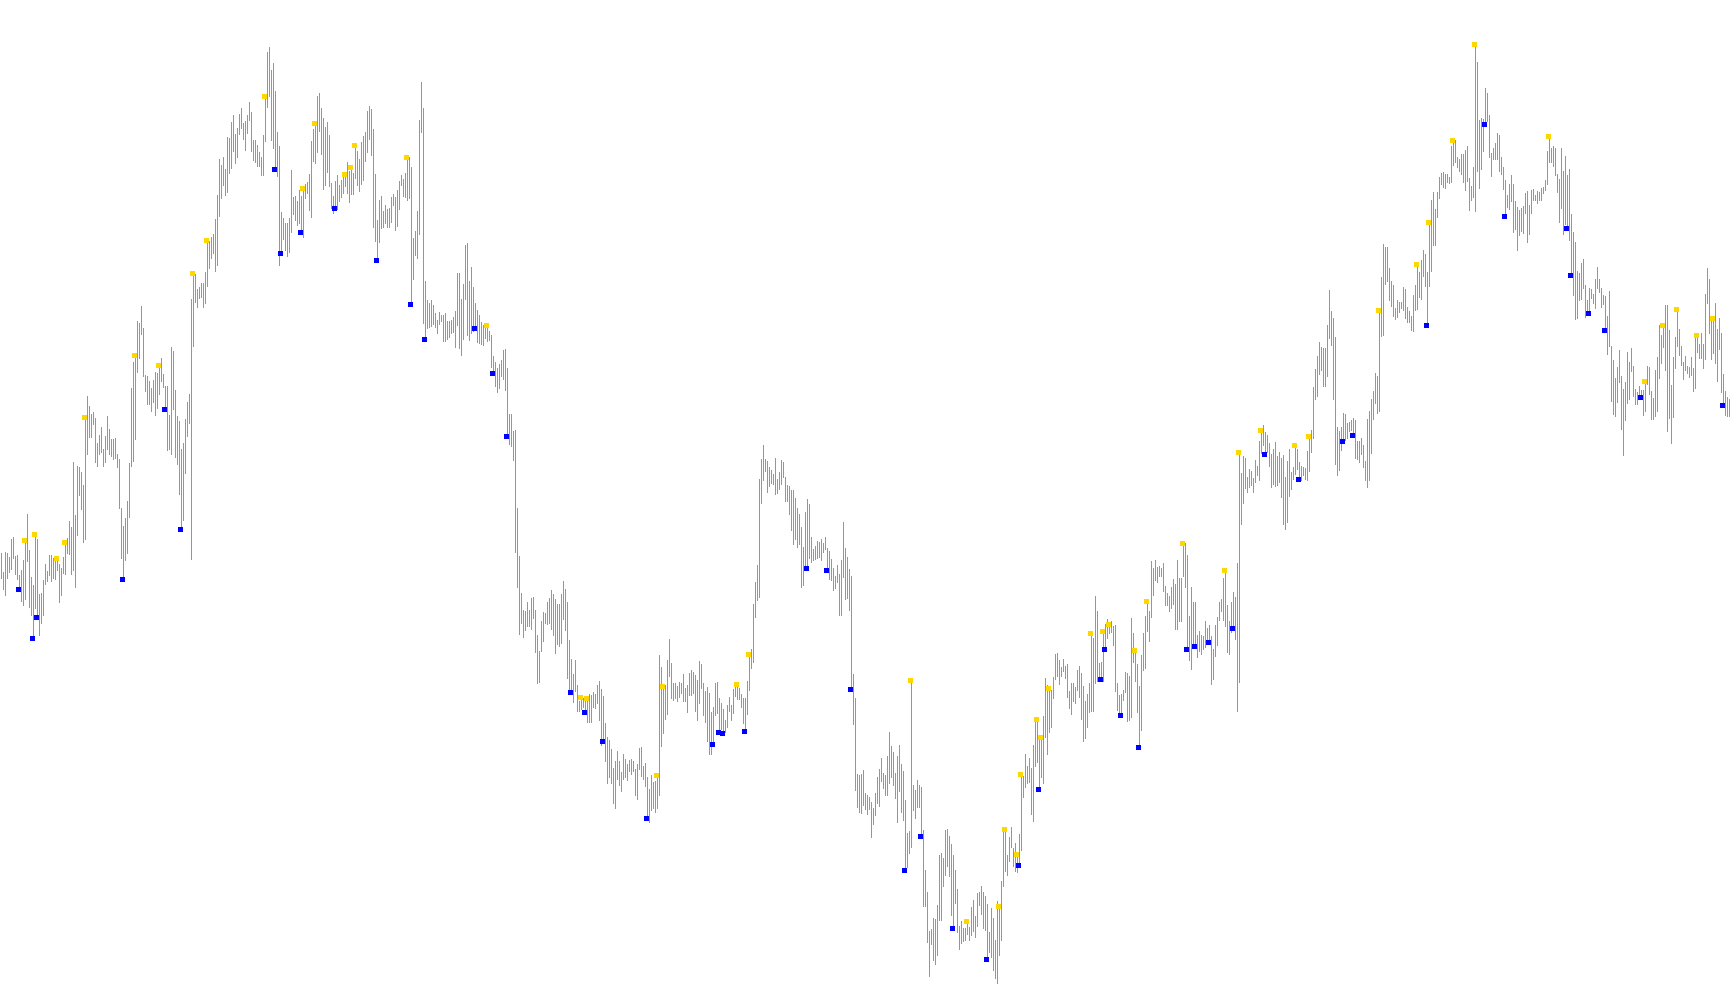
Identifies bullish and bearish reversals by detecting specific structural sequence shifts in the Awesome Oscillator's directional flow.

Wiseman_1
Indicator

Wiseman_1

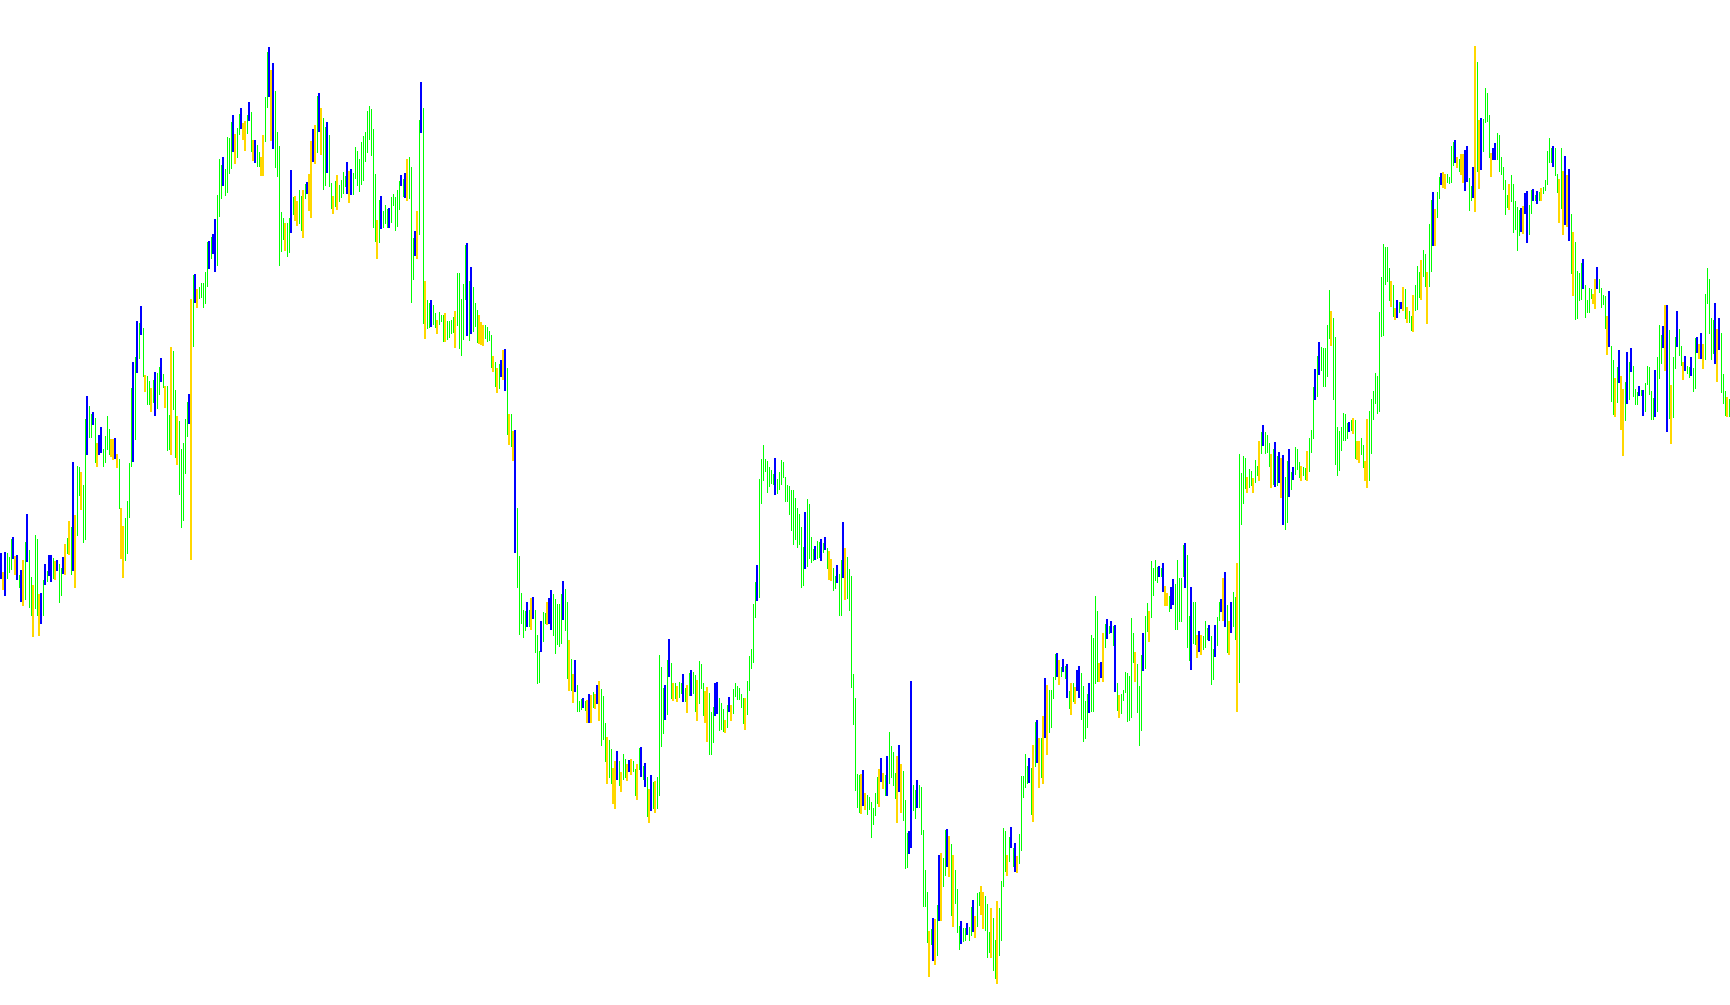
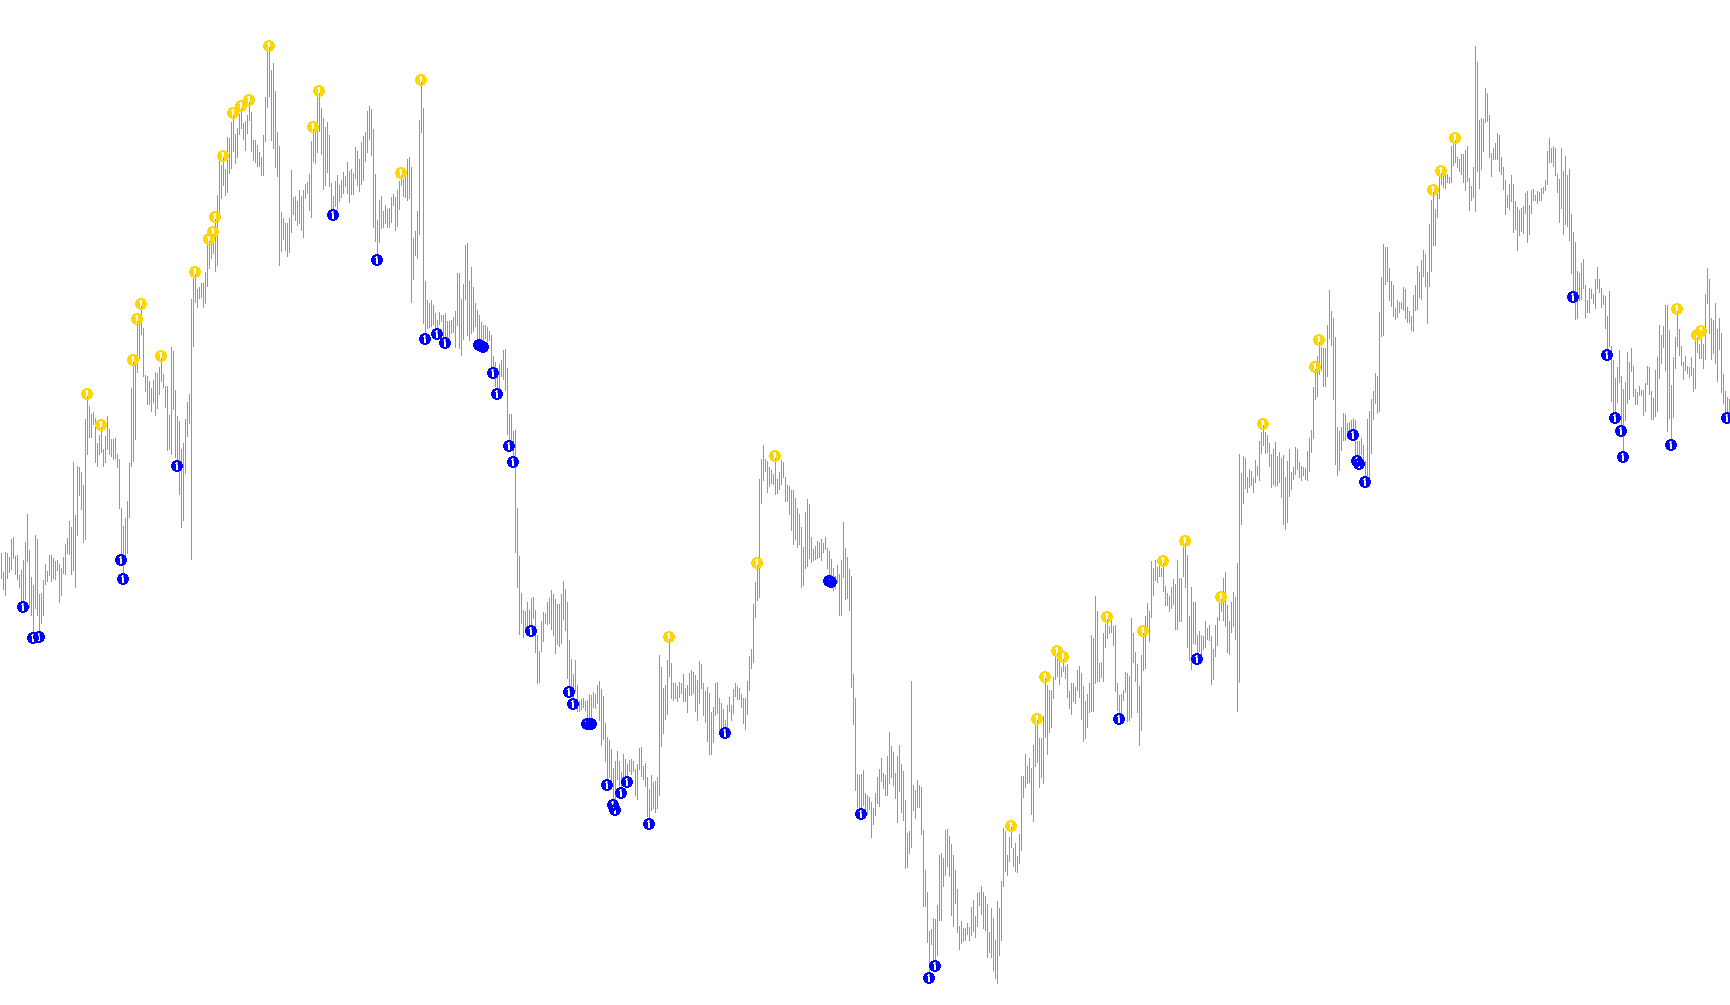
This indicator identifies potential trend reversals by detecting price action where the current candle's close contradicts the previous candle's range boundaries relative to its median point.

WithoutSunday
Indicator

WithoutSunday

This script systematically logs multi-asset price data to external binary files while intelligently merging Sunday market gaps into Monday's candles for continuous historical analysis.
wlxBW5Zone
Indicator

wlxBW5Zone

iACiAO

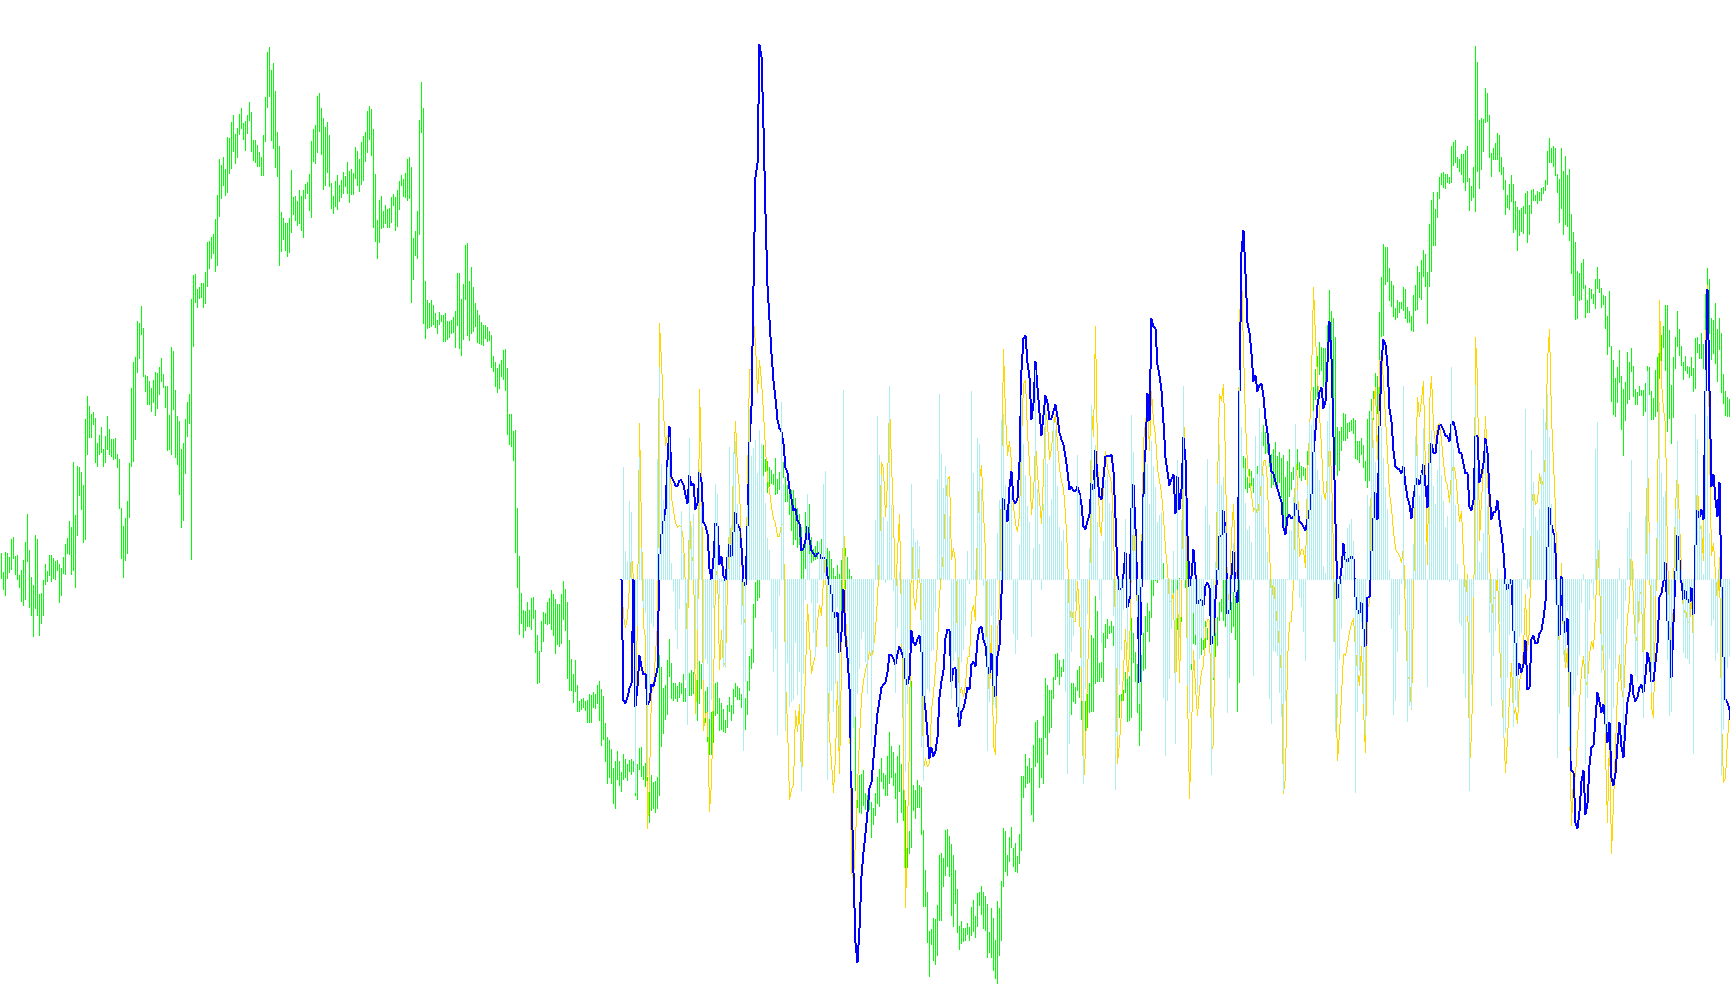
Identifies structural trend shifts by detecting simultaneous consecutive price progression in both Awesome Oscillator and Accelerator Oscillator values.

wlxBWACsig
Indicator

wlxBWACsig

iAC

This indicator identifies bullish and bearish reversal points by detecting specific sequential trend shifts and structural momentum reversals within the Awesome Oscillator metric.

wlxBWACsig_v2
Indicator

wlxBWACsig_v2

iAC

This indicator identifies trend reversal points by detecting specific directional shifts and sequential growth patterns in the Accumulation/Distribution values.

wlxBWAOsig
Indicator

wlxBWAOsig

iAO

Identifies bullish and bearish trend reversals by detecting zero-line crossovers and momentum shifts within the Awesome Oscillator.

wlxBWWiseMan-1
Indicator

wlxBWWiseMan-1

iAlligator

This indicator identifies trend exhaustion by detecting price breaches of the Alligator lines combined with specific candle midpoint closures and multi-bar peak validation.

wlxBWWiseMan-1_v1
Indicator

wlxBWWiseMan-1_v1

iAlligator

This indicator identifies potential trend reversals by detecting price action breaches of all three Alligator moving average components combined with specific candle body positioning and historical high/low structural confirmation.

wlxBWWiseMan-1_v2
Indicator

wlxBWWiseMan-1_v2

iAlligator

This indicator identifies trend reversal points by detecting price breaches of the Alligator's Jaw, Teeth, and Lips lines combined with specific candle body imbalances and historical high/low structural integrity.

wlxBWWiseMan-2
Indicator

wlxBWWiseMan-2

iAO

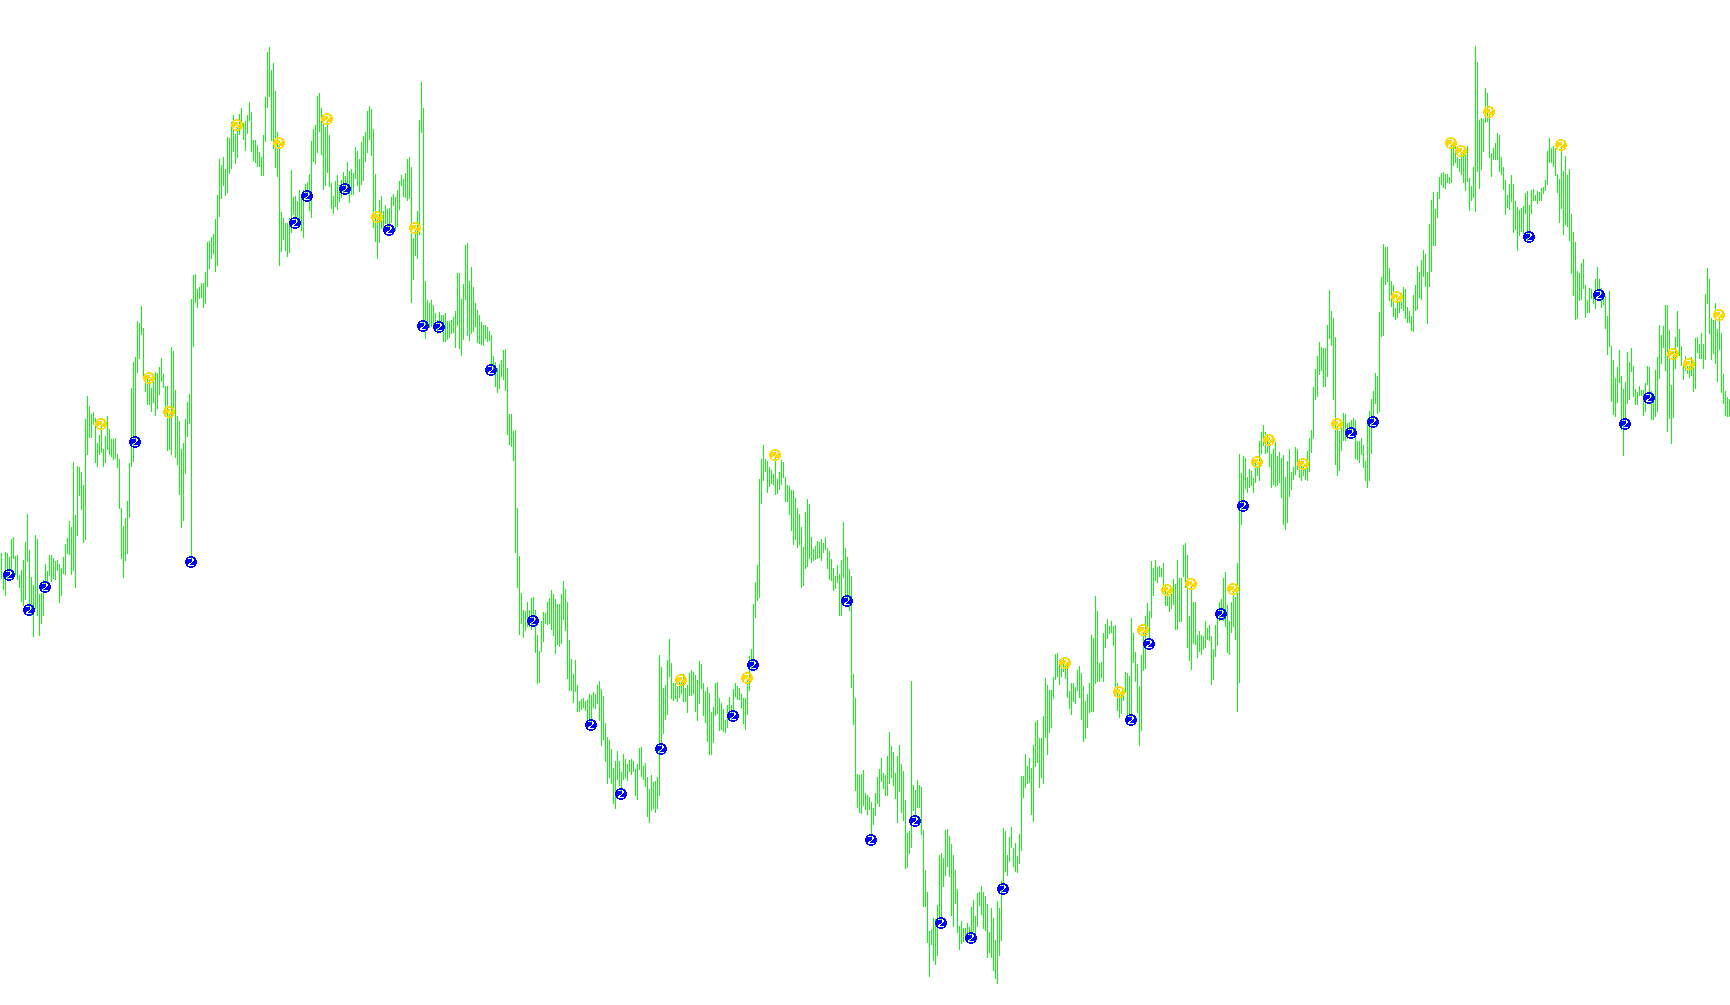
This indicator identifies trend reversal points by detecting specific sequential shifts in the Awesome Oscillator's magnitude and polarity across a five-bar lookback period.

wlxBWWiseMan-2_v1
Indicator

wlxBWWiseMan-2_v1

iAO

Identifies potential trend reversals by detecting sequential multi-bar structural shifts in the Awesome Oscillator's momentum direction.

wlxBWWiseMan-2_v2
Indicator

wlxBWWiseMan-2_v2

iAO

This indicator identifies trend reversal points by detecting specific four-period sequential fluctuations in the Awesome Oscillator's directional momentum.

wlxFractals
Indicator

wlxFractals

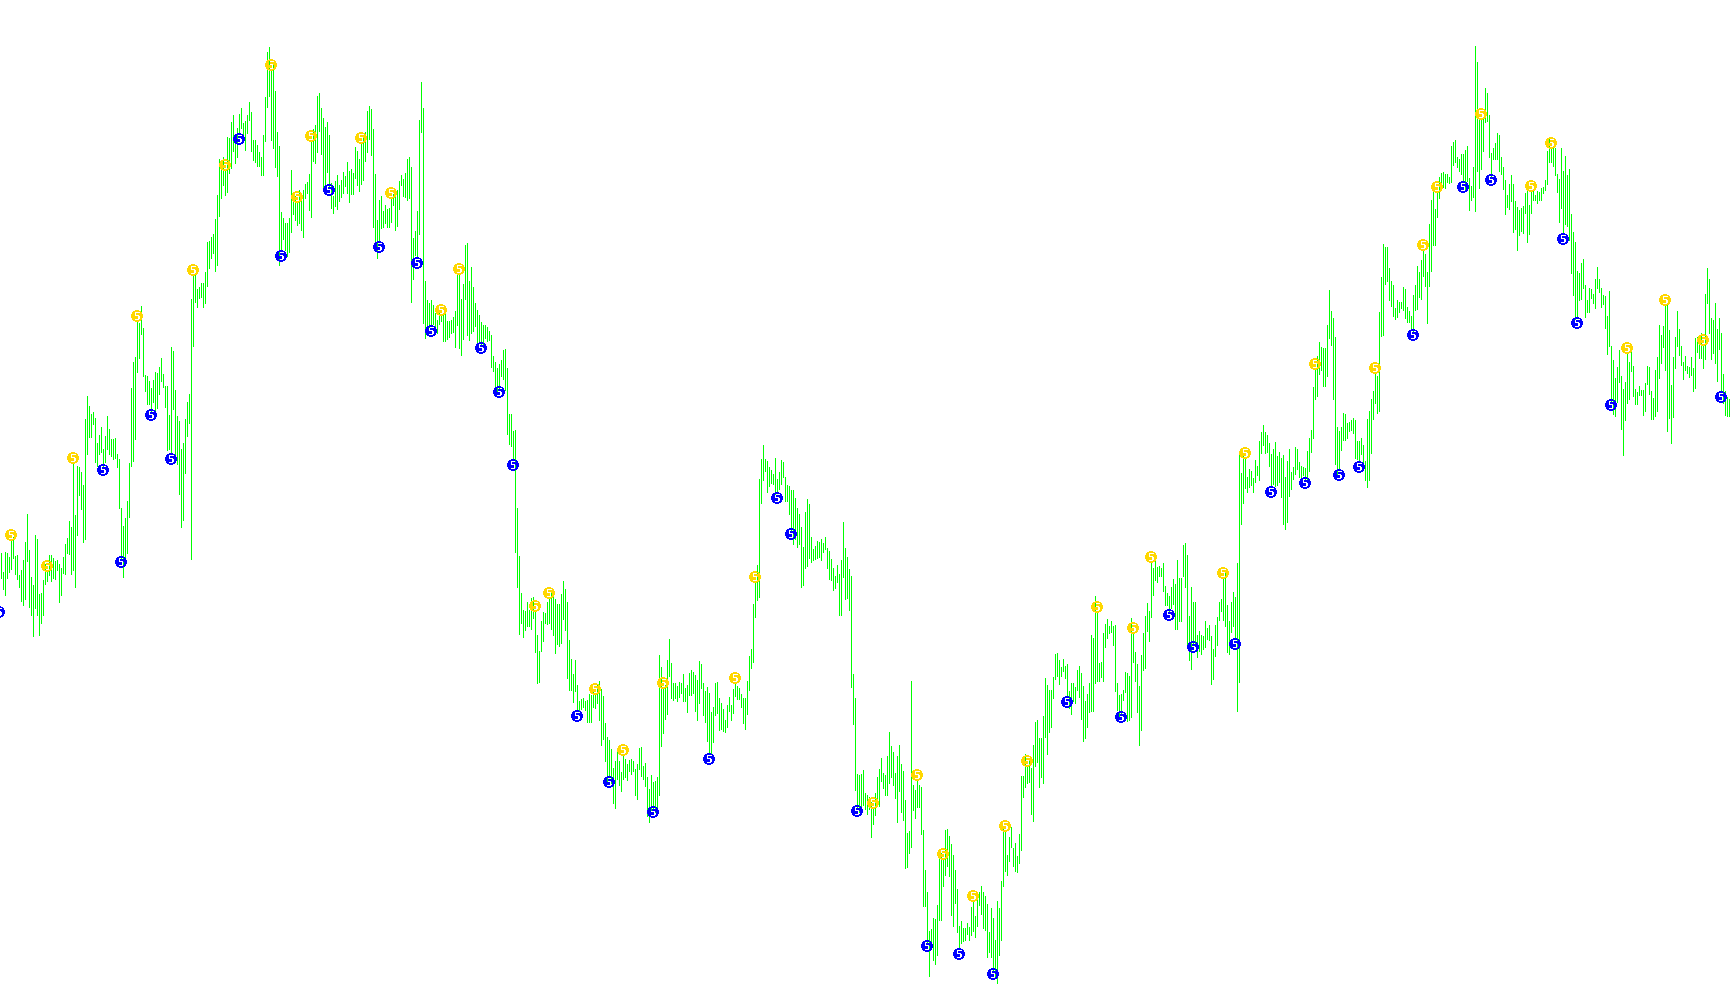
This indicator identifies local price extremes by verifying that a specific bar's high or low remains unmatched by neighboring candles within customizable left and right proximity bounds.

wlxFractals_v1
Indicator

wlxFractals_v1

This indicator identifies structural local extrema by verifying if a price peak or trough maintains dominance over a configurable number of surrounding bars on both its left and right sides.

wlxFractals_v2
Indicator

wlxFractals_v2

Identifies local price extremes by validating that a specific candle's high or low is strictly surrounded by lower or higher peaks within defined neighboring boundaries.

wlxFractals_v3
Indicator

wlxFractals_v3

Identifies local price extrema by verifying structural peaks and troughs against specific leftward and rightward neighborhood boundaries.

wlxFractals_v5
Indicator

wlxFractals_v5

Identifies localized price extrema by verifying that a candle's high or low remains the highest or lowest relative to a configurable number of preceding and succeeding bars.

wma_cross
Indicator

wma_cross

iMA

This indicator identifies directional shifts by detecting crossovers between short-term and long-term linear weighted moving averages while providing specific exit signals based on medium-period reversals relative to the primary trend line.

wma_cross1
Indicator

wma_cross1

iMA

This indicator identifies trend reversals by detecting crossovers between fast and slow linear weighted moving averages while providing dynamic exit signals based on intermediate period convergence.

wma_cross6
Indicator

wma_cross6

iMA

This indicator identifies trend reversals by detecting the specific moment short-term moving averages cross over large-period baselines with a customizable price delta buffer.

wma_cross_3ema
Indicator

wma_cross_3ema

iMA

This indicator identifies bullish and bearish reversals by detecting instances where a short-term moving average crosses simultaneously above or below both medium and long-term trend averages.

wma_cross_3emaRSI
Indicator

wma_cross_3emaRSI

iMAiRSI

This indicator identifies bullish and bearish reversals by detecting simultaneous crossovers of multiple moving average periods synchronized with Relative Strength Index threshold breaches.

wma_cross_confirm
Indicator

wma_cross_confirm

iMA

Identifies bullish and bearish entries via Linear Weighted Moving Average intersections while providing secondary exit signals based on medium-term trend deviations.

wma_cross_delta
Indicator

wma_cross_delta

iMA

This indicator identifies trend reversals by detecting specific price crossovers where a short-term moving average intersects a long-term moving average plus a defined pip delta.

Wolf
Indicator

Wolf

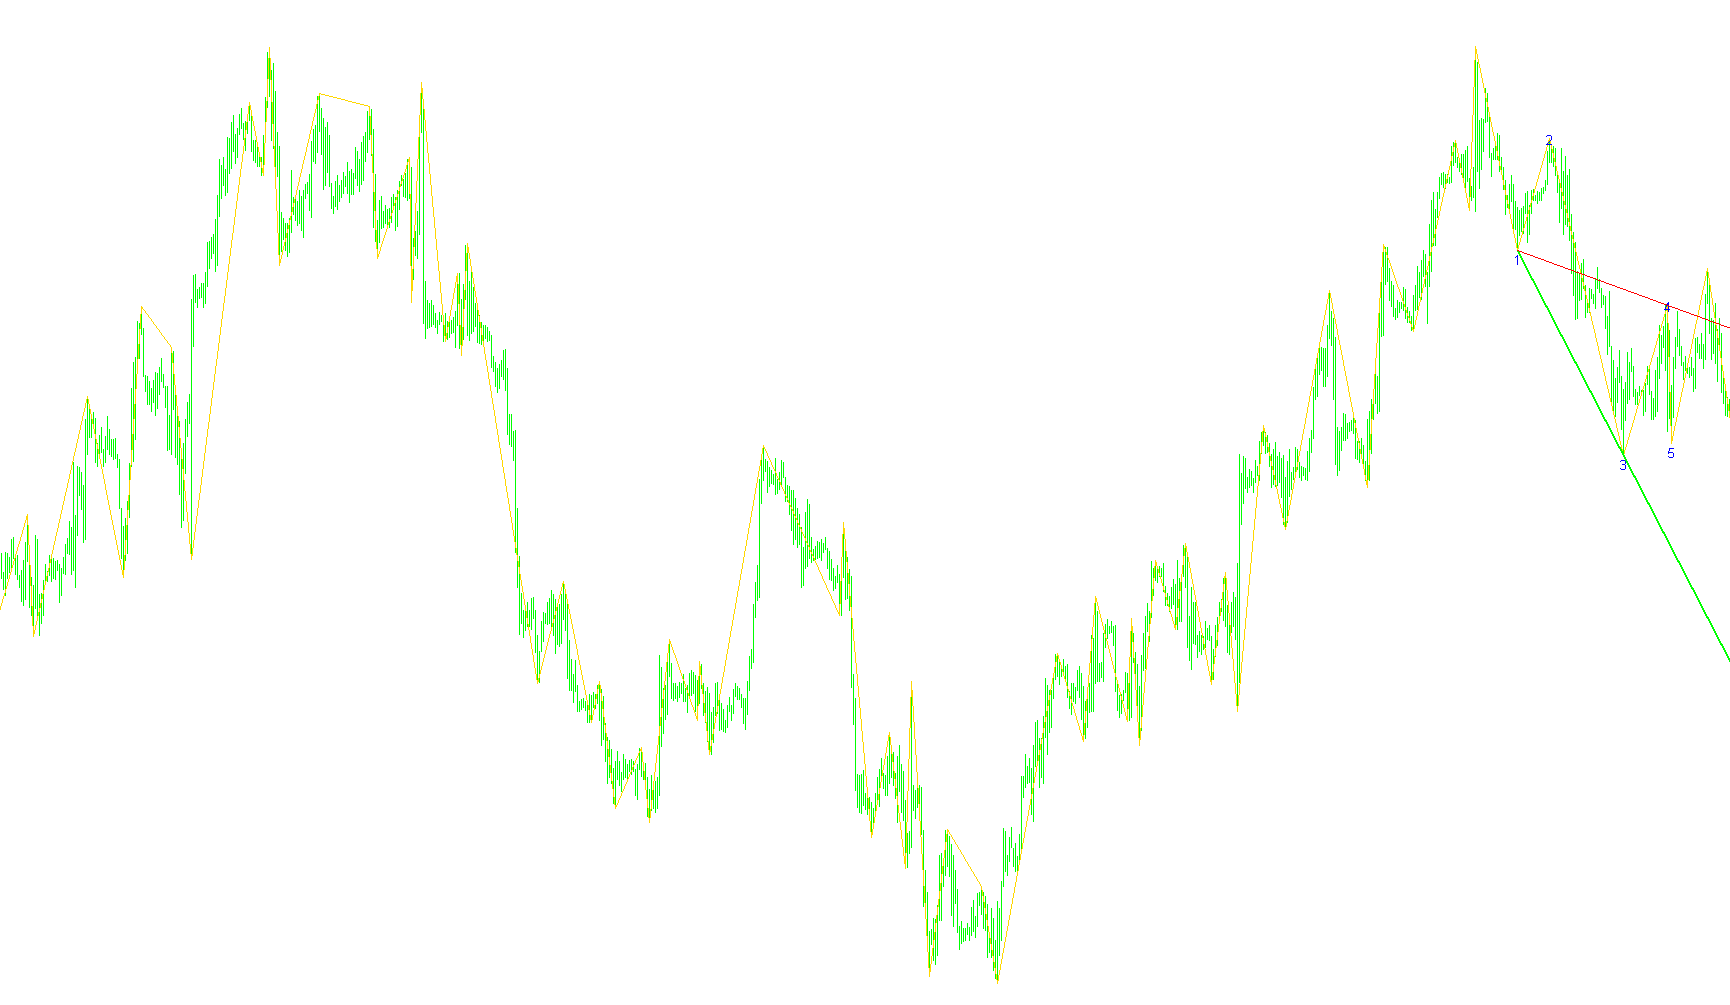
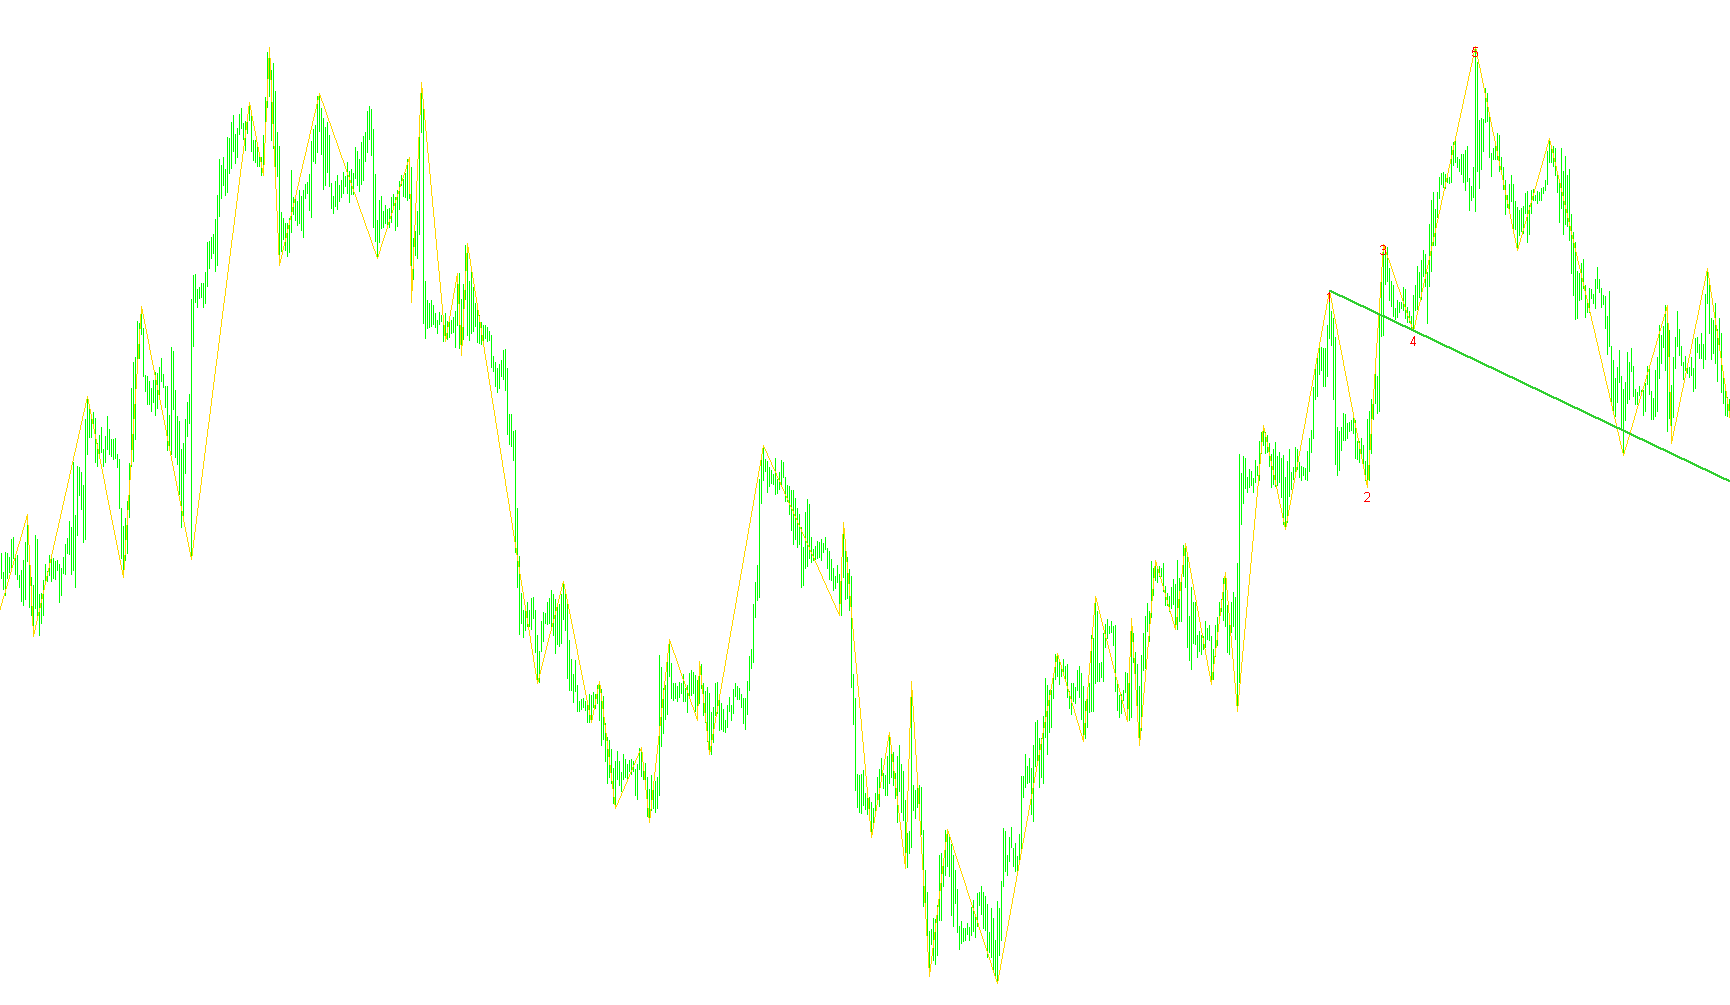
This indicator utilizes a multi-point zigzag filtration system to identify specific five-node geometric price patterns for identifying trend reversal entry points.

Wolfs
Indicator

Wolfs

This indicator identifies structural market pivots and captures multi-point trend reversals by filtering significant price extremes into sequential wave patterns.

WolfWave_nen
Indicator

WolfWave_nen

This indicator utilizes a ZigZag-based recursive algorithm to detect specific five-point geometric price patterns that signify structural trend reversals.

WolfWave_nen_v1
Indicator

WolfWave_nen_v1

This indicator identifies specific multi-point price structures by analyzing ZigZag pivots to detect bullish and bearish 'Wolf Wave' patterns based on relative highs and lows.

WolfWave_nen_v2
Indicator

WolfWave_nen_v2

This indicator identifies specific multi-peak price geometries by analyzing ZigZag pivot points to detect proprietary 'Wolf' patterns for directional bias.

Wolf_v1
Indicator

Wolf_v1

This indicator identifies specific harmonic price patterns by detecting recursive swing points and validating nested structural breaches between consecutive fractal peaks and troughs.

Wolf_v2
Indicator

Wolf_v2

This indicator identifies specific five-point geometric price patterns by filtering zigzag pivot points to detect potential bullish and bearish trend reversals.

Woodies Pivots Modified Into Fib Pivots
Indicator

Woodies Pivots Modified Into Fib Pivots

This script calculates and plots daily support and resistance levels by blending traditional pivot point arithmetic with Fibonacci retracement ratios of the previous day's price range.

WoodiesCCI
Indicator

WoodiesCCI

iCCI

This indicator calculates the divergence between fast and slow Commodity Channel Index values using typical prices to visualize momentum shifts via a comparative histogram.

WoodiesCCI_v1
Indicator

WoodiesCCI_v1

iCCI

This indicator quantifies momentum dynamics by calculating the differential between a fast and slow Commodity Channel Index (CCI) based on typical price data.

WoodiesCCI_v2
Indicator

WoodiesCCI_v2

iCCI

This indicator calculates a momentum histogram by subtracting a fast Commodity Channel Index from a slow Commodity Channel Index to identify trend velocity and potential reversals.

WoodiesCCI_v3
Indicator

WoodiesCCI_v3

iCCI

This indicator tracks price momentum by calculating the spread between a fast and slow Commodity Channel Index (CCI) to identify trend strength and potential reversals via a visual histogram.

wood_multi
Indicator

wood_multi

iCCI

This indicator synthesizes multiple Commodity Channel Index (CCI) oscillators across a wide spectrum of timeframes to visualize momentum convergence and price deviation.

Indicator

WPR ALERT

iWPR
WPR Candles
Indicator

WPR Candles

iWPR

This indicator dynamically maps Williams %R values onto the price chart by color-coding candle bodies and wicks based on predefined overbought and oversold thresholds.

WPR E-J
Indicator

WPR E-J

This indicator identifies potential market reversals by detecting synchronized extreme price momentum shifts between the EUR/USD and EUR/JPY currency pairs using a secondary Williams Percent Range calculation.

WPR G-E
Indicator

WPR G-E

Identifies trend reversal opportunities by synchronizing simultaneous overbought and oversold conditions across the EURUSD and GBPUSD currency pairs using the Williams %R oscillator.

WPR G-J
Indicator

WPR G-J

The indicator identifies bullish and bearish trend shifts by detecting concurrent positive or negative Williams Percent Range values across multiple currency pairs on a M15 timeframe.

WPR J-J
Indicator

WPR J-J

Identifies synchronized momentum extremes by cross-referencing the William's Percentage Range values of EURJPY and GBPJPY on a 15-minute timeframe.

WPR
Indicator

WPR

The logic quantifies the current price position relative to the highest high and lowest low over a rolling period to identify oversold and overbought extremes.

WPRfast
Indicator

WPRfast

iWPR

This indicator identifies extreme momentum zones by squaring and scaling the Will Rogers Percentage (WPR) to highlight price overextension beyond specific numeric boundaries.

WPRfast_v1
Indicator

WPRfast_v1

iWPR

This indicator captures extreme price momentum by applying a quadratic scaling transformation to the Williams %R, highlighting significant deviations from the mean range.

WPRfast_v2
Indicator

WPRfast_v2

iWPR

This indicator transforms the standard Williams %R into a dual-histogram signal by squaring normalized values and isolating extreme momentum shifts beyond specific user-defined upper and lower bounds.

WPROnChart
Indicator

WPROnChart

iWPRiMA

This indicator projects the Williams Percent Range (WPR) oscillator onto a price chart by calculating an offset based on the EMA of the median price.